
SUPERCHARGE YOUR ONLINE VISIBILITY! CONTACT US AND LET’S ACHIEVE EXCELLENCE TOGETHER!
AI share of voice answers a simple commercial question: when buyers ask AI systems about your category, how much of the visible answer environment belongs to your brand compared with the competitors you care about? The answer cannot be reduced to a single mention percentage. It needs to consider presence, recommendation position, citation support, prompt intent and provider differences.
| Share of voice is an AVM application ThatWare treats AI share of voice as a strategic interpretation of AVM evidence, not as a separate framework. The same visibility data is reorganized to show comparative market presence across brands, prompts and AI environments. |

What Is AI Share of Voice?
AI share of voice helps brands understand their relative presence across AI-generated recommendations and category conversations.
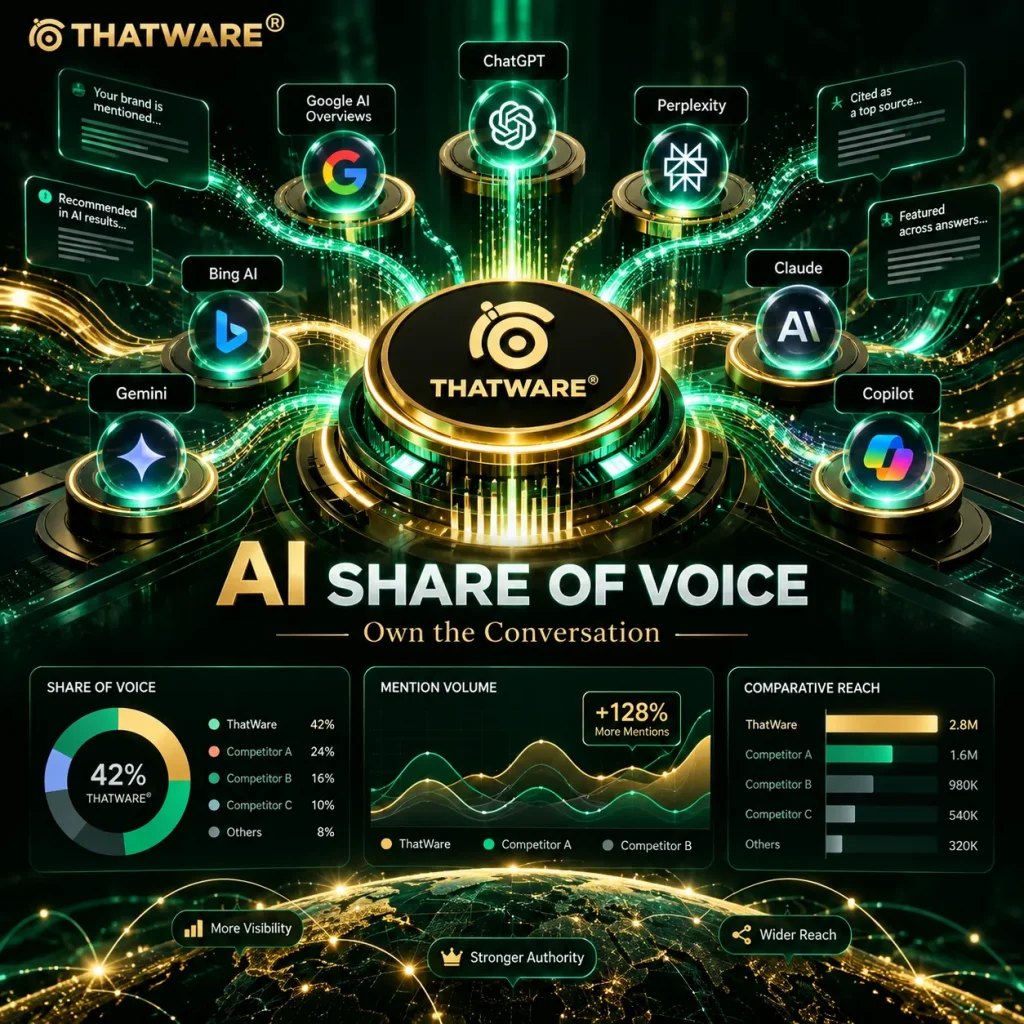
Provider-specific visibility can differ, which is why share of voice should be segmented before it is blended.
AI share of voice is a comparative view of brand visibility inside sampled AI-generated answers. It measures how often the brand enters the conversation and how strong that appearance is relative to named competitors. The analysis can be segmented by topic, prompt type, provider, market and buying stage.
This is especially useful when leadership needs to understand whether the brand is merely visible or actually competitive. A company can have reasonable overall AI visibility and still lose the commercial prompts that matter most. Share of voice makes those competitive differences easier to see.
Why Traditional Share of Voice Needs an AI Layer
Classic share of voice is often based on media mentions, paid impression share, search visibility or social conversation. AI answers create a different environment. The user may see only a few recommended brands, a compressed comparison or a generated summary. That makes inclusion, position and source support commercially meaningful even when there is no conventional search result page.
AI search share of voice extends conventional search visibility analysis into the generated answer environment.
- Measure category visibility rather than relying on branded recognition.
- See which competitors dominate high-intent recommendation and comparison prompts.
- Separate strong visibility from weak or bottom-of-answer mentions.
- Identify whether citation strength or authority is helping competitors win more answer space.
- Track whether optimization work is increasing competitive presence over time.
AI share of voice tracking makes it possible to observe how competitive answer visibility changes across repeated measurement cycles.
How AVM Powers AI Share of Voice Analysis
AVM provides the evidence foundation through presence, citation, authority, consistency and position. Advanced AVM can interpret that evidence through broader strategic signals such as market-share visibility and share of voice. The service page should therefore position AI Share of Voice Analysis as a buyer-intent application of the existing AVM methodology, not as a new model with its own unrelated score.
LLM share of voice provides a comparative view of how brands appear across large language model-generated answers.
Prompt-Level Share of Voice
AI search share of voice can reveal which brands repeatedly enter category answers for non-branded and commercial prompts. Which brands appear for each prompt, and how often? Prompt-level analysis prevents category averages from hiding important losses in commercial or transactional queries.
Position-Weighted Visibility
A brand that appears at the top of a recommendation answer has a stronger commercial presence than a brand that is named at the bottom. Position gives share of voice a quality dimension.
Citation-Supported Share
When one competitor repeatedly receives authoritative citations while another is merely mentioned, the visibility is not equivalent. Citation and authority help explain why one brand may hold a more defensible share of the answer environment.
Provider-Specific Share
Different providers can surface different sources and brands. That is why the analysis should show provider-specific share before any blended summary is used.
Intent-Specific Share
Informational visibility can create awareness, but commercial, comparative and transactional visibility is closer to buyer action. The reporting should separate those stages rather than combining everything into one percentage.
What We Measure
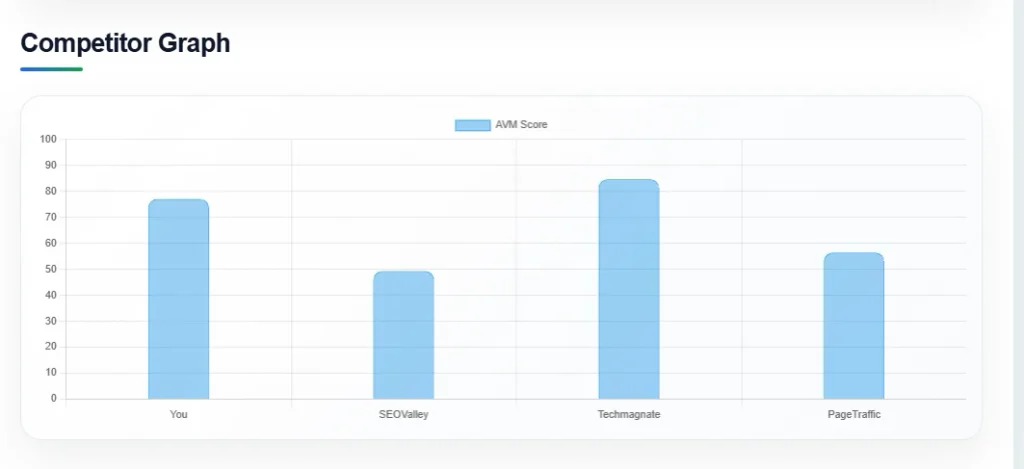
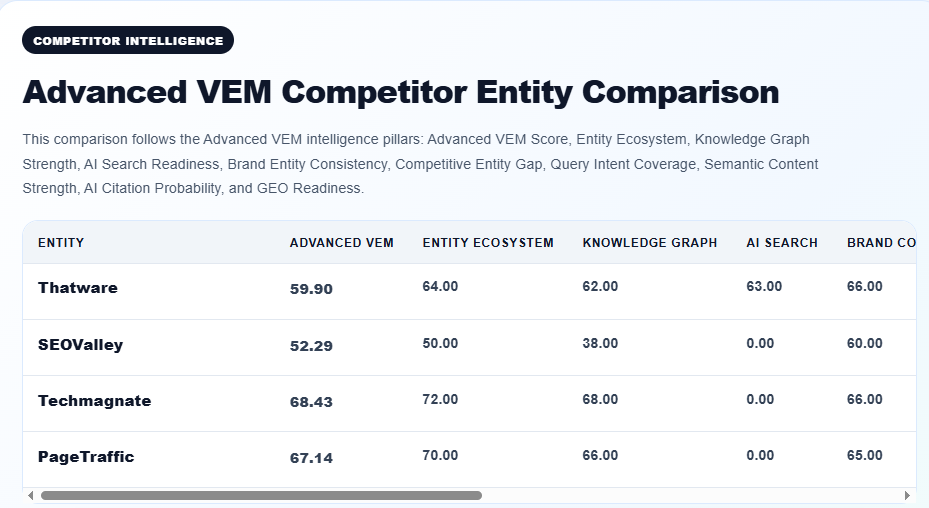
Competitive AVM example reconstructed from the published ThatWare framework page.
- Brand appearance rate across the selected query set.
- Competitor appearance rate on the same prompts.
- Position within shortlists, comparisons and recommendation structures.
- Citation and authority support around each brand.
- Share of voice by provider, topic and query intent.
- Commercial prompt dominance and missed opportunities.
- Changes in competitive visibility across repeat measurement cycles.
The Share of Voice Workflow
- Select the brand, named competitors, market and priority topics.
- Build a query portfolio that represents the buyer journey from discovery to comparison and action.
- Collect and normalize provider-specific AVM evidence.
- Calculate comparative visibility views across prompts, categories and providers.
- Identify where competitors win through stronger presence, citations, authority or position.
- Translate the gaps into a prioritized roadmap for content, entity, PR and generative search optimization.
- Repeat the same measurement design to track movement over time.
What You Receive
- Executive AI share of voice summary by priority market or service line.
- Competitor-by-competitor visibility comparison.
- Provider-specific share of voice breakdown.
- Commercial and comparison prompt dominance analysis.
- Citation and authority context behind competitive differences.
- Topic-level gaps showing where the brand is absent from important buying conversations.
- Action plan to increase qualified share of voice rather than only raw mention count.
Use Cases for AI Share of Voice
- Category leaders protecting recommendation visibility as AI discovery grows.
- Challenger brands trying to understand why established competitors enter more AI shortlists.
- Enterprise teams comparing visibility across regions, languages or business units.
- Agencies reporting whether GEO, SEO and PR work is increasing competitive answer presence.
- Product marketers monitoring launch categories and comparison prompts where buyer language changes quickly.
Why Query Design Matters
Share of voice can be distorted by a weak prompt set. If most questions contain the brand name, the result primarily measures recognition. A useful portfolio includes non-branded category prompts, solution questions, vendor comparisons, alternative searches, location-specific needs and decision-stage prompts. This is what turns share of voice from an interesting chart into a commercial measurement.
Use VEM to Explain Structural Gaps, Not Replace AVM
When a competitor wins share of voice because its entity is clearer, its topic relationships are stronger or its external references are more consistent, VEM can help diagnose those underlying conditions. The competitive measurement itself remains an AVM application.
Interpret Share of Voice Responsibly
AI share of voice is not a universal market-share statistic. It is a structured comparison of sampled answers under a defined methodology. The provider set, query portfolio, market, language and timing should be documented so changes can be compared consistently. This boundary makes the output more credible and more useful for decision-making.
| Measure Your Brand’s Share of the AI Answer Environment Benchmark your brand against the competitors that matter, identify the prompts where you are losing visibility and build a prioritized plan to increase commercial AI presence. |
Define the Competitive Market Before Calculating Share of Voice
AI share of voice is only meaningful when the comparison set reflects the market the buyer actually sees. A broad category may contain global brands, regional specialists, niche providers, marketplaces, publishers and technology platforms. Mixing all of them into one percentage can produce a number that looks precise but has little strategic value. The first step is therefore to define the competitive frame: which brands genuinely compete for the same customer, problem, location, product or service decision?
The prompt set should then be aligned with that frame. A company may compete with one group of brands for enterprise projects and another group for local or specialist demand. It may face traditional competitors in Google search but different competitors inside AI-generated recommendations. The analysis should allow those differences to surface rather than forcing every brand into one benchmark.
A practical share-of-voice study can create separate views for category discovery, commercial shortlists, comparisons, local intent, service-specific prompts and branded validation. This gives decision-makers a clearer picture of where the brand is gaining or losing answer space.
Move Beyond Mention Share With Quality-Weighted Visibility
If two brands are each mentioned in five out of ten prompts, a simple mention-share calculation would treat them as equal. In reality, one brand may appear first in commercial shortlists, receive strong third-party citations and be described as a specialist, while the other appears near the bottom with weak evidence. That is why AI share of voice should include quality signals rather than relying on raw frequency alone.
AVM provides the measurement foundation for this richer interpretation. Presence shows whether the brand appears. Position shows where it appears in recommendation structures. Citation and authority show whether the appearance is supported by credible evidence. Consistency shows whether the brand is represented reliably across queries. When these signals are viewed together, share of voice becomes a more useful picture of competitive visibility.
The goal is not to invent a new score that hides the underlying data. The goal is to use AVM evidence to explain the strength of each brand’s presence. A brand with fewer but stronger commercial appearances may be more strategically significant than a brand with many low-value mentions.
Segment Share of Voice by Intent
A single blended percentage can hide the prompts that matter most. Informational share of voice tells you whether the brand participates in educational conversations. Commercial share of voice tells you whether it enters provider research. Comparative share shows whether it is considered when users evaluate alternatives. Transactional share reveals visibility close to action. Branded share mainly reflects recognition and factual validation.
These categories should be reported separately before they are combined. A company might lead informational prompts because it publishes extensively, yet perform poorly when users ask for a shortlist or recommendation. Another company might have modest educational presence but dominate high-intent comparisons. Leadership needs to see that distinction because the commercial implications are very different.
Intent segmentation also makes optimization easier. Weak informational share may require broader topical coverage. Weak commercial share may require stronger proof, comparison content and third-party authority. Weak transactional share may indicate that service pages do not clearly communicate next steps, locations, eligibility, pricing context or buyer fit. The diagnosis becomes more precise when the prompt intent is visible.
Compare Share of Voice Across Providers Without Hiding Differences
Different AI systems can produce different brand sets, citations and recommendation structures. A company that performs strongly in one environment may be nearly absent in another. For that reason, provider-specific share should be visible before any blended summary is presented. The blended view can help executives understand overall direction, but it should never erase meaningful variation.
Provider-level reporting can answer practical questions. Is the brand consistently visible across several systems, or does its performance depend on one provider? Do the same competitors dominate everywhere? Are certain citations recurring across providers? Does one system describe the brand differently from the others? These patterns can reveal whether the brand has a broadly recognized market association or a narrower visibility footprint.
Trend reporting should preserve the same provider structure. If a blended score improves because one provider changed dramatically, that should be visible. The objective is to understand the shape of visibility, not simply celebrate movement in an aggregate number.
Use Share of Voice to Find Defensible Growth Opportunities
Competitive visibility data becomes valuable when it identifies opportunities the brand can realistically pursue. Not every lost prompt deserves equal attention. The analysis should prioritize areas where buyer intent is strong, the brand has a credible right to compete, and the evidence gap can be addressed through content, authority, entity clarity or stronger proof.
For example, a brand may already have strong presence in a service category but lose recommendation position because competitors have better case studies and independent coverage. Another brand may have excellent authority but weak visibility because its service architecture does not clearly connect the company with the relevant topic. A third may be absent in one market because local entity and location signals are thin. Share of voice highlights the competitive symptom, while AVM and supporting VEM diagnostics can help explain the cause.
This prevents the team from copying competitor content blindly. The goal is to strengthen the brand’s own evidence and category association in places that matter commercially.

Create a Share-of-Voice Opportunity Matrix
One useful way to operationalize the findings is to place prompt groups into an opportunity matrix. High-value prompts where the brand is absent and competitors are strong belong in the highest-priority quadrant. Prompts where the brand already appears but holds weak position may be faster wins. Prompts where all brands have low visibility may represent an emerging topic. Prompts where the brand already dominates should be monitored and defended rather than over-optimized.
The same matrix can include citation strength and authority gaps. A prompt family may look weak because the brand lacks coverage. Another may be weak because the brand has content but no independent validation. Another may show unstable visibility caused by inconsistent entity descriptions. The matrix should therefore show both the competitive outcome and the likely reason behind it.
This gives SEO, content, PR and brand teams a shared prioritization model. Instead of receiving a long spreadsheet, each team can see which actions are most likely to influence important parts of the answer environment.
Connect AI Share of Voice With Business Reporting
Organizations can use AI share of voice as a recurring visibility indicator alongside other digital performance measurements. Executives are familiar with market share, media share of voice and search visibility. AI share of voice can fit into that reporting structure if it is explained carefully. It should be presented as a sampled measure of answer-layer visibility across a defined prompt set, provider set, market and time period. It is not the same as revenue share, traffic share or total consumer exposure.
The executive summary can show category-level trends, high-intent prompt performance, major competitor movements and the specific AVM dimensions that explain change. For example, a brand might gain share because its presence increases across commercial prompts, because new authoritative citations improve recommendation strength, or because its average position rises in shortlists. Reporting the driver of change is more useful than reporting a percentage alone.Teams can incorporate AI search share of voice into broader reporting to monitor visibility beyond traditional search results.
This also makes AI visibility easier to connect with normal planning cycles. Quarterly reviews can track whether strategic campaigns, new research, PR activity, product launches or site changes are reflected in the answer environment. The data should inform decisions, not become another vanity metric.
Use VEM When the Share Gap Comes From Entity Clarity
Some share-of-voice gaps are not primarily content problems. A brand may publish extensively but still be described inconsistently, associated with the wrong category, confused with similarly named entities or disconnected from its key products and experts. In those cases, VEM can support the investigation by examining the entity foundation beneath the AVM outcome.
The review can look at brand naming, aliases, service relationships, product relationships, founder and expert connections, schema, structured facts, external profiles and the consistency of descriptions across the web. If competitors have clearer entity structures, they may be easier for AI systems to resolve and associate with specific topics. That can influence how reliably they appear across prompt families.
VEM should not be used to replace the share-of-voice measurement. AVM still provides the observed visibility evidence. VEM is used to understand whether structural entity issues may be contributing to the competitive gap.
Track Share of Voice as a Trend, Not a One-Time Ranking
Consistent AI share of voice tracking can reveal whether changes in visibility persist across providers and prompt groups. AI answer environments are dynamic. Models change, retrieval systems change, publishers update content and competitors launch new campaigns. A single study is useful as a baseline, but the strategic value increases when the same prompt portfolio is measured repeatedly under documented conditions.
Trend analysis should look for durable patterns. Is the brand gaining presence across several providers, or only one? Is commercial share improving while informational share is flat? Are citations becoming more authoritative? Are competitors expanding into new prompt clusters? Is the brand holding its position after a product launch or campaign ends? These questions help distinguish a temporary fluctuation from a meaningful change in market visibility.
A recurring program also creates accountability. Each optimization action can be linked to the prompt groups and AVM dimensions it is intended to influence. The measurement cannot prove simple cause and effect, but it can show whether the competitive evidence is moving in the expected direction.
What Buyers Should Expect From an AI Share of Voice Service
A credible service should explain exactly what is being compared. Buyers should know the competitor set, prompt portfolio, market, language, provider scope and measurement period. They should be able to see prompt-level evidence beneath the summary and understand how presence, position, citation, authority and consistency contribute to the interpretation.
The service should also avoid overstating precision. AI share of voice is based on sampled answers, not every possible consumer interaction. It should not be described as a universal market-share percentage. Its strength is comparative: the same brands are tested on the same questions, under the same documented conditions, so teams can identify meaningful gaps and monitor direction over time.
Effective AI share of voice tracking should preserve the same methodology so changes can be interpreted consistently over time. ThatWare’s AVM-based approach keeps that discipline at the center. The purpose of AI share of voice is not to manufacture another dashboard score. It is to show where the brand participates in the AI answer environment, how strong that participation is, and where competitors have built an advantage that can be investigated and addressed.
| Methodology boundary AVM is presented as ThatWare’s proprietary diagnostic methodology, not as an official score issued or endorsed by OpenAI, Anthropic, xAI, Perplexity, Google or another platform. Results should be interpreted as sampled evidence within a defined query, provider, market and time context. |