SUPERCHARGE YOUR Online VISIBILITY! CONTACT US AND LET’S ACHIEVE EXCELLENCE TOGETHER!
Part 1: From AI Visibility to AI Intelligence (A–D)
Introduction
For years, businesses have measured visibility through rankings, impressions, clicks, and traffic. Then came AI search.
As users began asking questions directly to ChatGPT, Claude, Gemini, Perplexity, Grok, and other AI-powered systems, a new challenge emerged.

Visibility no longer depended solely on whether a website ranked.
Visibility increasingly depended on whether AI systems recognized, trusted, remembered, and recommended a brand.
This is where traditional visibility metrics begin to fall short.
A brand may appear inside AI-generated answers, yet still have weak recommendation power. Another brand may be mentioned frequently but receive little trust. Some brands may dominate one AI model while remaining invisible in another.
This creates a new layer of measurement that goes beyond basic visibility.
That layer is called Advanced AVM Intelligence.
Where the original AI Visibility Metric (AVM) helps answer:
“Can AI see your brand?”
Advanced AVM Intelligence answers:
“How deeply does AI understand, trust, recommend, and remember your brand?”
This evolution introduces a new generation of AI visibility measurement built around twelve intelligence layers.
In this article, we will explore the first four foundational pillars:
- AI Discoverability Score
- AI Trust Score
- Entity Dominance Score
- Answer Probability Score
Together, these metrics provide a much deeper understanding of brand visibility within AI-driven search ecosystems.
The Evolution From Visibility To Intelligence
Traditional SEO measured rankings.
Modern AI visibility measures presence.
Advanced AI Visibility Metrics Intelligence measures influence.

Evolution Flow
Traditional SEO
↓
Search Visibility
↓
AI Visibility
↓
AI Discoverability
↓
AI Trust
↓
AI Recommendation
↓
AI Intelligence
The future of search will not belong to the websites with the most pages.
It will belong to the brands that AI systems understand, trust, and recommend.
Advanced AVM Intelligence Architecture
The Advanced AVM Intelligence Framework operates as a multi-layer intelligence model.
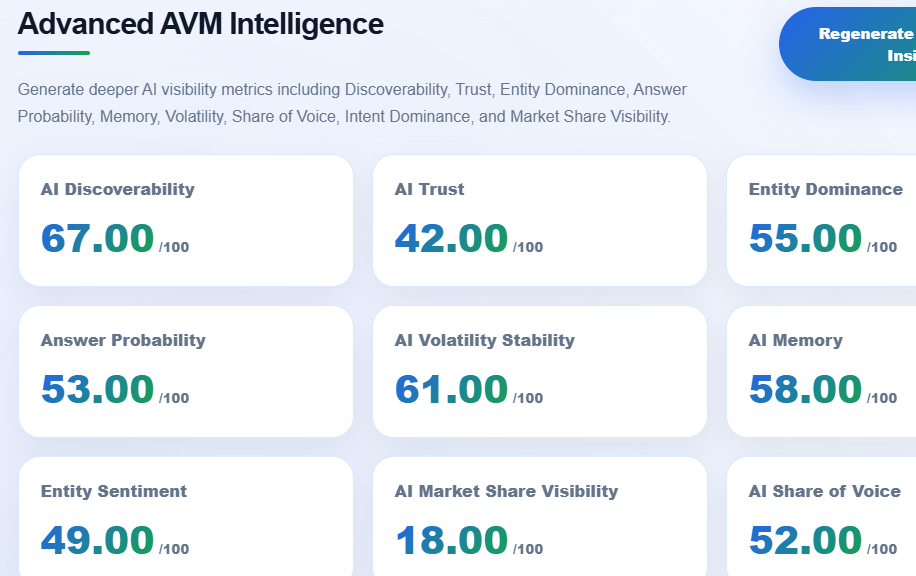
This dashboard expands beyond traditional AI visibility measurement and introduces a suite of Advanced AVM Intelligence Metrics designed to evaluate how AI systems perceive, remember, trust, and recommend a brand across a broad range of conversational and search scenarios. These advanced indicators provide a deeper understanding of a brand’s competitive position within AI-powered ecosystems and help identify the specific factors influencing recommendation behavior.
The strongest-performing metric is AI Discoverability (67/100), indicating that ThatWare is relatively easy for AI systems to identify and surface across relevant search topics. This aligns with the previously observed strong Presence Score and confirms that the brand has established a meaningful footprint within AI-generated responses.
AI Volatility Stability (61/100) and AI Memory (58/100) suggest that the brand maintains a moderately stable presence across different AI interactions and retains a reasonable level of recognition over time. These metrics are particularly important because AI-generated outputs can vary significantly based on prompt structure, context, and data availability. Higher stability and memory scores indicate stronger entity reinforcement and more predictable AI visibility performance.
Entity Dominance (55/100) and Answer Probability (53/100) reveal that the brand is beginning to establish itself as a recognized entity within its category but has not yet achieved dominant recommendation status. AI systems acknowledge the brand’s relevance, but there remains substantial room to increase recommendation frequency and category leadership.
The AI Share of Voice (52/100) score further reinforces this position. While the brand has secured a measurable presence within AI conversations, it is not yet commanding a majority share of recommendations compared to competing entities. Increasing content depth, authority signals, and third-party validation can help improve this metric over time.
The dashboard also highlights two notable growth opportunities. AI Trust (42/100) indicates that AI systems require stronger supporting evidence before consistently recommending the brand with high confidence. Similarly, Entity Sentiment (49/100) suggests that brand perception within AI-generated responses remains neutral-to-positive but could be strengthened through broader authority building, customer success narratives, thought leadership, and industry recognition.
The most significant opportunity lies within AI Market Share Visibility (18/100). This metric measures the proportion of AI-generated recommendations and visibility captured relative to the broader competitive market. The low score indicates that although the brand is visible, a significant share of AI attention remains concentrated among competing entities. Improving this metric typically requires a combination of stronger authority, broader citation coverage, increased recommendation frequency, and enhanced category ownership.
Collectively, these advanced metrics provide a strategic roadmap for evolving from basic AI visibility toward true AI market leadership. They reveal not only whether AI systems recognize a brand, but also how deeply that recognition translates into trust, memory retention, recommendation preference, and market influence.
Framework Flow
User Query
↓
AI Systems
↓
Brand Detection
↓
Trust Evaluation
↓
Entity Analysis
↓
Recommendation Assessment
↓
Intelligence Scoring
↓
Strategic Recommendations
Each layer contributes unique signals that help determine how AI systems perceive a brand.
A. AI Discoverability Score
What Is AI Discoverability Score?
AI Discoverability Score measures how easily a brand can be discovered by AI systems when users search using generic or non-branded prompts.
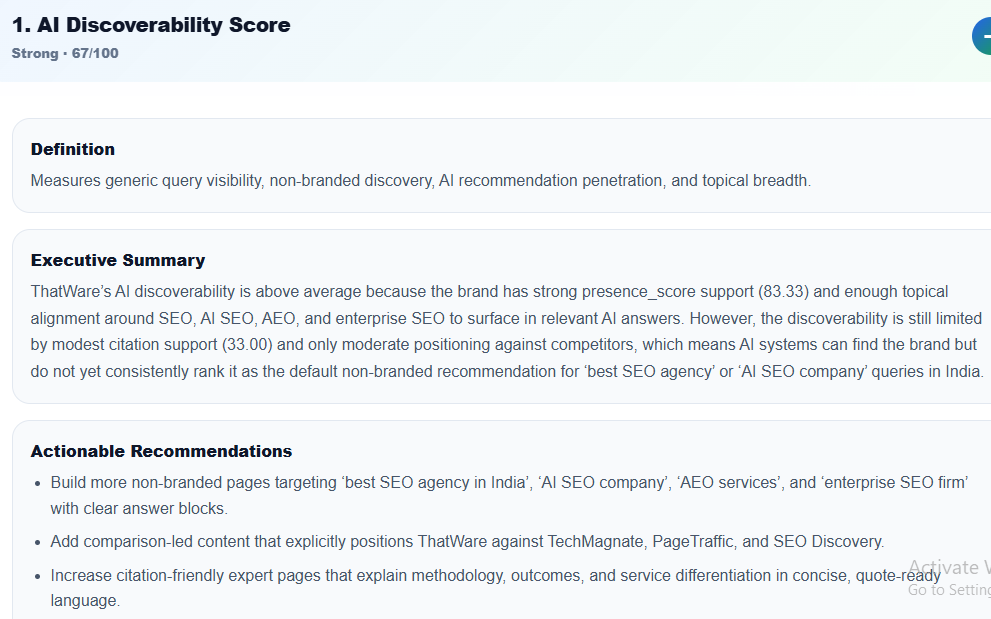
This section focuses on AI Discoverability, one of the most important indicators of a brand’s ability to be found, recognized, and recommended by AI systems beyond direct brand searches. With a score of 67 out of 100, ThatWare demonstrates a strong level of discoverability across AI-powered search environments, indicating that the brand is being surfaced for relevant industry topics even when users do not explicitly search for the company by name.
Unlike branded visibility, discoverability measures how effectively a brand appears for broader category-level and solution-oriented searches. This includes queries such as “best SEO agency in India,” “AI SEO company,” “AEO services,” and other commercial or informational searches where users are seeking solutions rather than specific brands. A strong discoverability score suggests that AI systems understand the brand’s topical relevance and are capable of associating it with important industry concepts.
The executive summary highlights that ThatWare’s discoverability performance is largely supported by its strong presence score and clear topical alignment across SEO, AI SEO, AEO, and enterprise SEO-related subjects. These signals help AI systems recognize the brand as a relevant entity within the digital marketing ecosystem and increase its chances of being surfaced in AI-generated responses.
However, the report also identifies important limitations. While AI systems can discover the brand, it is not yet consistently positioned as the default recommendation for highly competitive non-branded searches. This gap is primarily linked to moderate citation strength and competitive positioning challenges. In AI search environments, discoverability alone is not enough; brands must also demonstrate strong authority, trust, and recommendation signals to secure top-tier visibility.
This is one of the most important metrics in the framework because it evaluates visibility before the user even knows your company exists.
Many brands appear only when users search their exact name.
That is not true discoverability.
True discoverability occurs when a user searches for a category, problem, solution, or industry topic and AI systems naturally recommend the brand.
Why It Matters
Most future AI searches will be non-branded.
Users will ask:
- Best AI SEO agency
- Top enterprise marketing firms
- Best cybersecurity providers
- Recommended CRM platforms
They will not search your company name first.
If AI systems cannot discover your brand through these generic prompts, you may never enter the buyer’s consideration process.
How It Is Measured
The score evaluates:
| Signal | Weight |
|---|---|
| Generic Query Visibility | 35% |
| Non-Branded Discovery | 30% |
| Recommendation Penetration | 20% |
| Topic Breadth | 15% |
Formula
AI Discoverability Score
=
(Generic Visibility × 0.35)
+
(Non-Branded Discovery × 0.30)
+
(Recommendation Penetration × 0.20)
+
(Topic Breadth × 0.15)
Example Calculation
Suppose a brand receives:
| Metric | Score |
|---|---|
| Generic Visibility | 90 |
| Non-Branded Discovery | 75 |
| Recommendation Penetration | 80 |
| Topic Breadth | 70 |
Calculation:
(90 × 0.35)
+
(75 × 0.30)
+
(80 × 0.20)
+
(70 × 0.15)
=
80.5
Final Discoverability Score:
81/100
Flowchart
Topic Search
↓
Generic Query Detection
↓
Brand Mention Analysis
↓
Recommendation Frequency
↓
Topic Coverage Analysis
↓
Discoverability Score
Interpretation Guide
| Score | Meaning |
|---|---|
| 90–100 | Exceptional Discoverability |
| 75–89 | Strong Discoverability |
| 60–74 | Moderate Discoverability |
| 40–59 | Weak Discoverability |
| Below 40 | AI Discovery Risk |
Optimization Recommendations
Increase:
- Industry authority content
- Comparative content
- Category pages
- Entity relationships
- Topic clusters
- Digital PR campaigns
Reduce reliance on branded-only traffic.
Impact On AI Visibility
A strong Discoverability Score means AI systems can find and recommend the brand before users know it exists.
This creates a significant competitive advantage in AI search ecosystems.
B. AI Trust Score
What Is AI Trust Score?
AI Trust Score measures how much confidence AI systems place in the information associated with a brand.
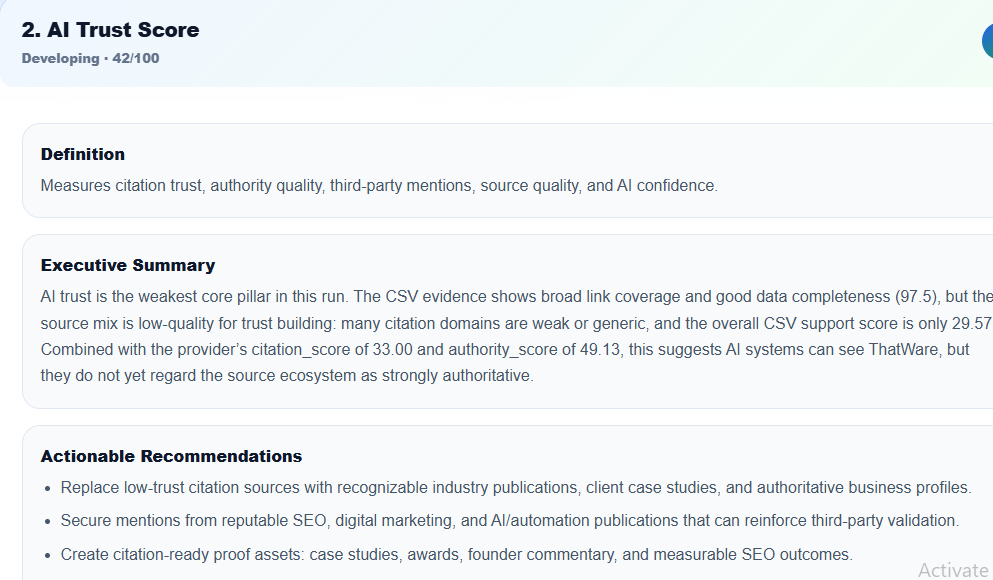
This section analyzes ThatWare’s AI Trust Score, which measures how much confidence AI systems place in the brand based on its authority signals, citation quality, source credibility, third-party validation, and overall trustworthiness. With a score of 42 out of 100, the brand falls within the Developing category, making trust the weakest-performing pillar within the broader AI Visibility framework.
AI trust extends beyond simple visibility or recognition. While a brand may appear in AI-generated responses, trust determines whether AI systems consider the available evidence strong enough to confidently recommend, cite, or position that brand as a leading solution. Modern AI platforms increasingly rely on authoritative external signals to validate claims before incorporating them into recommendations and comparative analyses.
Being visible is not enough.
AI must also trust what it sees.
Modern AI systems evaluate:
- Citations
- Source quality
- External references
- Authority domains
- Validation signals
before recommending a brand.
Why It Matters
Imagine two companies.
Both appear in AI-generated answers.
One is supported by Forbes, Clutch, research publications, and industry references.
The other is supported only by its own website.
Which company is more likely to be recommended?
The answer is obvious.
Trust becomes a recommendation multiplier.
| Signal | Weight |
|---|---|
| Citation Trust | 30% |
| Authority Domains | 25% |
| Third-Party Mentions | 20% |
| AI Confidence Signals | 15% |
| Source Quality | 10% |
Formula
AI Trust Score
=
(Citation Trust × 0.30)
+
(Authority Domains × 0.25)
+
(Third Party Mentions × 0.20)
+
(AI Confidence × 0.15)
+
(Source Quality × 0.10)
| Signal | Score |
|---|---|
| Citation Trust | 85 |
| Authority Domains | 90 |
| Mentions | 70 |
| Confidence | 80 |
| Source Quality | 75 |
| Result | Value |
|---|---|
| AI Trust Score | 84/100 |
Flowchart
Brand Mention
↓
Citation Analysis
↓
Authority Validation
↓
Third Party Verification
↓
Confidence Assessment
↓
Trust Score
Interpretation Guide
| Score | Meaning |
|---|---|
| 90+ | Highly Trusted |
| 75–89 | Trusted |
| 60–74 | Moderately Trusted |
| 40–59 | Weak Trust |
| Under 40 | Trust Deficiency |
Optimization Recommendations
Focus on:
- Industry awards
- Digital PR
- High-authority mentions
- Research publications
- Expert commentary
- Third-party validation
Impact On AI Visibility
Trust dramatically influences recommendation behavior.
High-trust brands often receive preferential treatment within AI-generated recommendations.
C. Entity Dominance Score
What Is Entity Dominance Score?
Entity Dominance Score measures how strongly AI systems associate a brand with a specific topic, category, or industry.
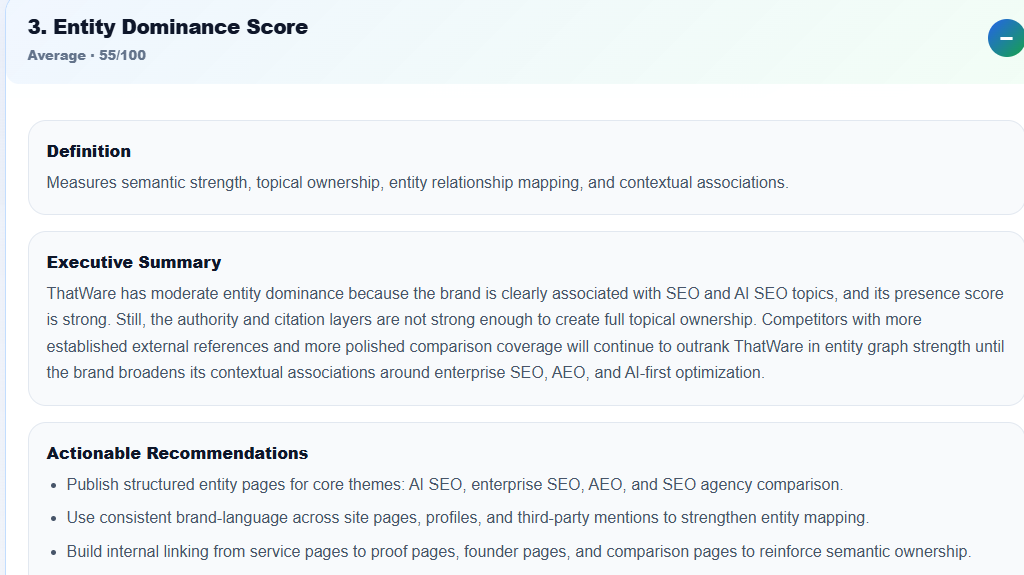
This section evaluates ThatWare’s Entity Dominance Score, which measures how strongly the brand is associated with its core topics, services, and industry concepts within AI systems and knowledge graphs. With a score of 55 out of 100, the brand falls into the Average category, indicating that AI platforms recognize ThatWare as a relevant entity in the SEO and AI SEO space, but it has not yet achieved full topical ownership within its target market.
Entity dominance is a critical concept in modern AI Search Optimization (AISO), Answer Engine Optimization (AEO), and Generative Engine Optimization (GEO). Unlike traditional SEO, which focuses primarily on keyword rankings, entity dominance evaluates whether AI systems consistently associate a brand with specific topics, categories, expertise areas, and industry conversations. The stronger these associations become, the more likely AI engines are to recommend the brand as a default authority when answering relevant queries.
The executive summary reveals that ThatWare has already established meaningful semantic connections with topics such as SEO, AI SEO, and digital marketing. This is supported by the brand’s strong presence score, which indicates that AI systems regularly recognize and surface the company within relevant conversations. However, the report also highlights a key limitation: while visibility is strong, the supporting authority and citation ecosystem is not yet powerful enough to secure complete topical ownership.
Think of it this way.
When someone says:
- Electric Cars → Tesla
- Search Engine → Google
- CRM → Salesforce
those brands have established entity dominance.
AI systems make similar associations.
The stronger the association, the greater the dominance.
Why It Matters
AI systems increasingly organize knowledge around entities instead of keywords.
The brands that own an entity space gain a disproportionate visibility advantage.
Entity dominance is often what separates industry leaders from everyone else.
How It is Measured
| Signal | Weight |
|---|---|
| Semantic Strength | 35% |
| Topic Ownership | 30% |
| Relationship Mapping | 20% |
| Contextual Associations | 15% |
Formula
Entity Dominance
=
(Semantic Strength × 0.35)
+
(Topic Ownership × 0.30)
+
(Relationship Mapping × 0.20)
+
(Contextual Associations × 0.15)
Example
| Signal | Score |
|---|---|
| Semantic Strength | 90 |
| Topic Ownership | 85 |
| Relationship Mapping | 70 |
| Contextual Associations | 80 |
| Result | Value |
|---|---|
| Entity Dominance Score | 83.5 |
Flowchart
Brand Entity
↓
Topic Associations
↓
Knowledge Relationships
↓
Context Mapping
↓
Ownership Analysis
↓
Dominance ScoreInterpretation Guide
Score Meaning 90+ Category Owner 75–89 Strong Entity 60–74 Recognized Entity 40–59 Weak Entity Under 40 Entity Ambiguity Optimization Recommendations
Strengthen:
- Topic clusters
- Knowledge graph presence
- Industry mentions
- Author entities
- Entity schema
- Category-specific content
Impact On AI Visibility
Strong entity dominance makes AI systems more likely to associate the brand with relevant searches automatically.
D. Answer Probability Score
What Is Answer Probability Score?
This metric estimates:
What are the chances AI systems will recommend this brand when answering a relevant query?
This is one of the most strategic metrics in the framework.
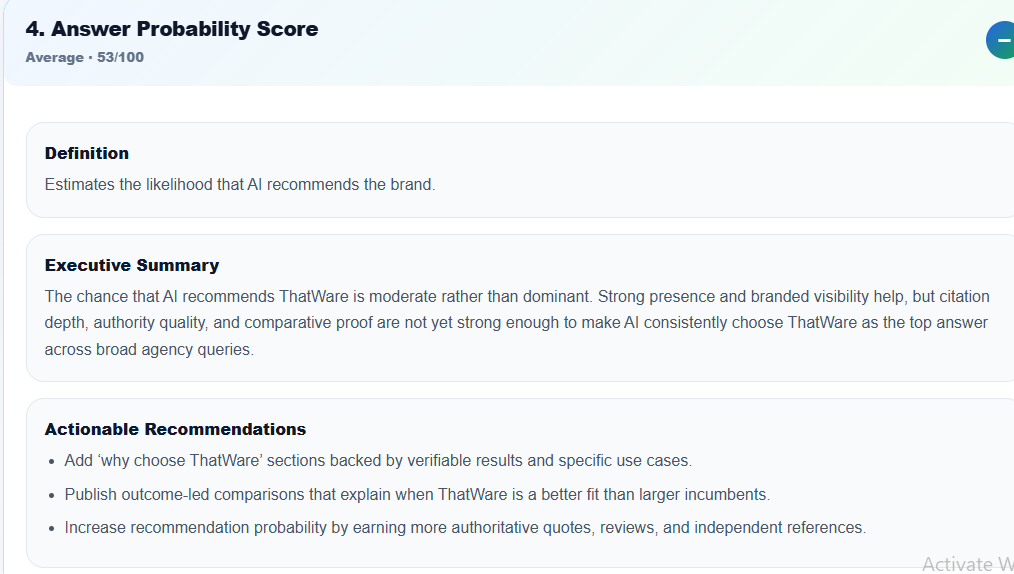
This section evaluates ThatWare’s Answer Probability Score, a metric that estimates how likely AI systems are to recommend the brand when responding to relevant user queries. With a score of 53 out of 100, the brand falls within the Average category, indicating that AI platforms recognize ThatWare as a viable solution but do not yet consistently prioritize it as a top recommendation across broader industry searches.
Answer Probability is one of the most commercially important AI visibility metrics because it directly measures recommendation potential. While discoverability determines whether a brand can be found and entity dominance measures topical ownership, answer probability focuses on the ultimate outcome: whether AI systems actually choose to recommend the brand when users ask for solutions, service providers, or industry leaders.
The executive summary reveals that ThatWare benefits from strong branded visibility and a well-established presence within AI-generated responses. These strengths increase the likelihood that AI systems will include the brand in relevant discussions. However, the score also highlights a key challenge: recommendation dominance requires more than visibility alone. AI systems rely heavily on citation depth, authority signals, proof-based content, and comparative validation when deciding which brands deserve top placement within generated answers.
It moves beyond visibility and focuses on recommendation likelihood.
Why It Matters
Ultimately, AI search is becoming recommendation search.
Users increasingly ask:
- Which company should I hire?
- Which software should I buy?
- Which agency should I choose?
The answer probability score measures how likely a brand is to appear in those recommendations.
How It Is Measured
Inputs include:
- Discoverability
- Trust
- Entity Dominance
- Historical Recommendation Rate
- Competitive Position
Formula
Answer Probability = (Discoverability + Trust + Dominance + Recommendation History + Competitive Position) ÷ 5
| Metric | Score |
|---|---|
| Discoverability | 82 |
| Trust | 84 |
| Dominance | 83 |
| Recommendation History | 90 |
| Competitive Position | 80 |
Calculation:
Answer Probability = (82 + 84 + 83 + 90 + 80) ÷ 5
= 419 ÷ 5
= 83.8%
Result: 83.8%
Meaning:
The brand has an estimated 84% probability of being recommended by AI systems within relevant industry searches.
Flowchart
User Query
↓
Brand Visibility
↓
Trust Evaluation
↓
Entity Analysis
↓
Competitor Comparison
↓
Recommendation Probability
Interpretation Guide
| Score | Meaning |
|---|---|
| 90+ | Highly Recommended |
| 75–89 | Frequently Recommended |
| 60–74 | Occasionally Recommended |
| 40–59 | Rarely Recommended |
| Under 40 | Recommendation Risk |
Optimization Recommendations
Improve:
- Discoverability
- Trust
- Entity Strength
- Citation Quality
- AI Mentions
- Industry Recognition
Impact On AI Visibility
This metric acts as a predictive indicator.
Instead of measuring where the brand stands today, it estimates how likely AI systems are to recommend the brand tomorrow.
Closing Thoughts For Part A – D
The first generation of AI visibility focused on appearances.
The next generation focuses on intelligence.
AI Discoverability measures whether AI systems can find you.
AI Trust determines whether they believe you.
Entity Dominance determines whether they associate you with your category.
Answer Probability determines whether they recommend you.
Together, these four layers create the foundation of Advanced AVM Intelligence.
In Part 2, we will explore how AI systems remember brands, react to market changes, interpret sentiment, and measure visibility share across AI-generated ecosystems through:
- AI Volatility Score
- AI Memory Score
- Entity Sentiment Score
- AI Market Share Visibility
These metrics move beyond recommendation and begin measuring long-term AI influence.
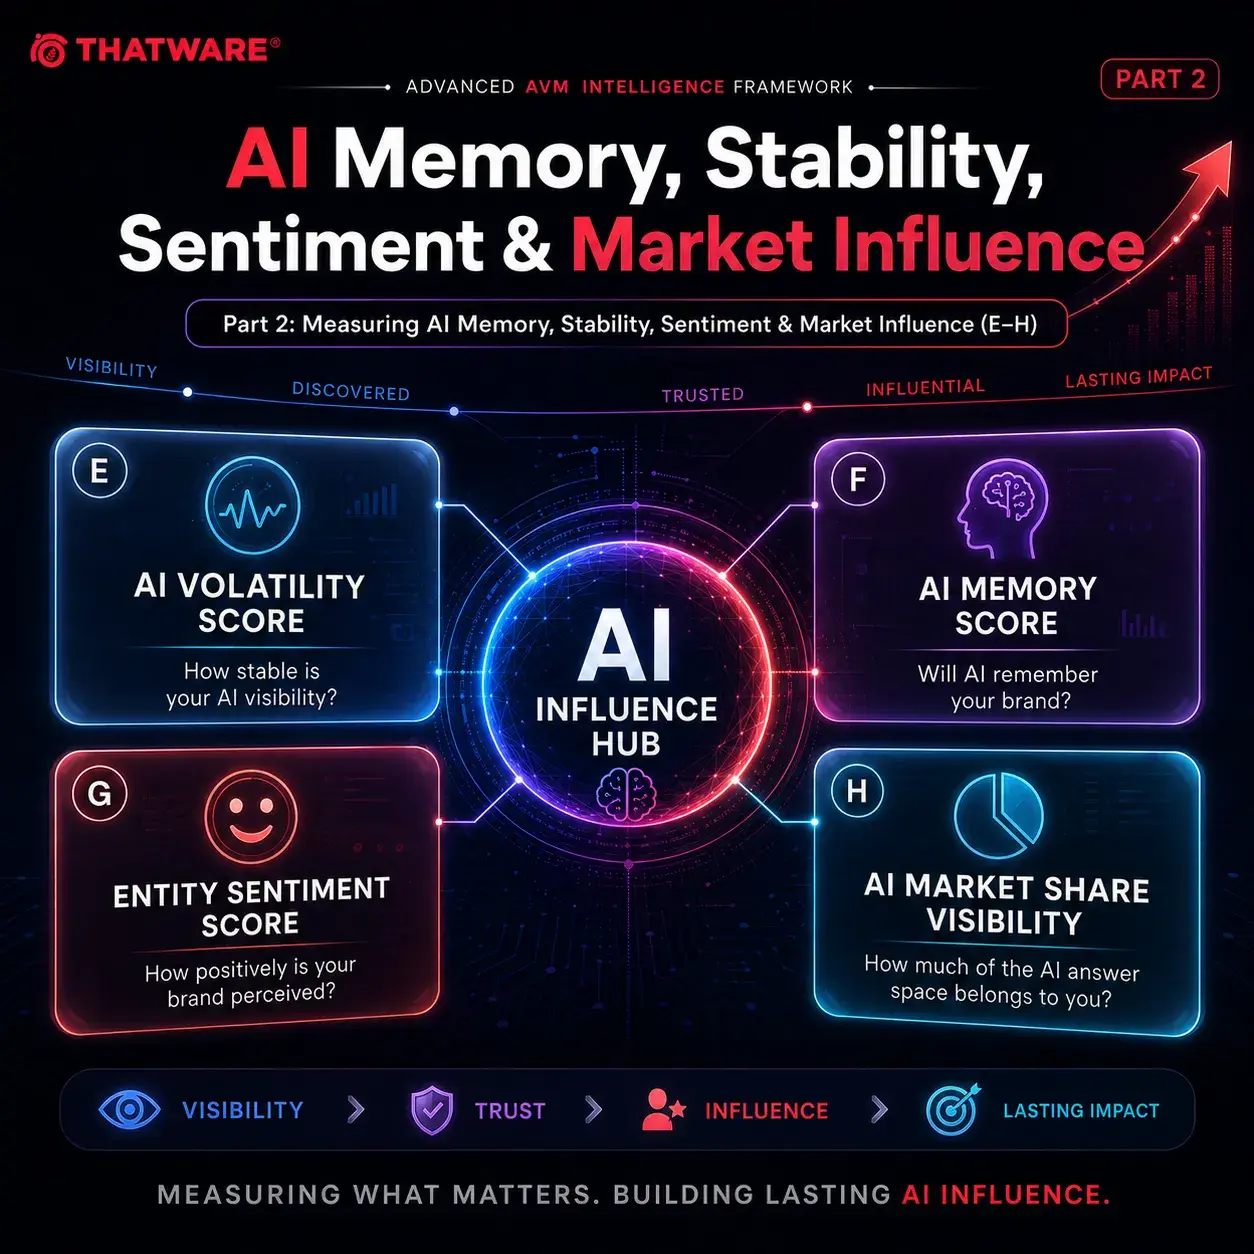
Part 2: Measuring AI Memory, Stability, Sentiment & Market Influence (E–H)
In Part 1, we explored the foundational intelligence layers of Advanced AVM:
- AI Discoverability
- AI Trust
- Entity Dominance
- Answer Probability
Together, those metrics helped us understand whether AI systems can find, trust, understand, and recommend a brand.
But recommendation alone is not enough.
The next challenge is understanding what happens after AI recognizes a brand.
Questions such as:
- Does AI consistently remember the brand?
- Does visibility remain stable over time?
- Is the brand mentioned positively or negatively?
- How much market influence does the brand hold across AI-generated answers?
These questions form the second layer of Advanced AVM Intelligence.
This section introduces four new intelligence models:
- AI Volatility Score
- AI Memory Score
- Entity Sentiment Score
- AI Market Share Visibility
These metrics help brands understand not only visibility, but also stability, perception, and long-term influence within AI ecosystems.
E. AI Volatility Score
What Is AI Volatility Score?
AI Volatility Score measures how stable or unstable a brand’s visibility is across AI systems over time.
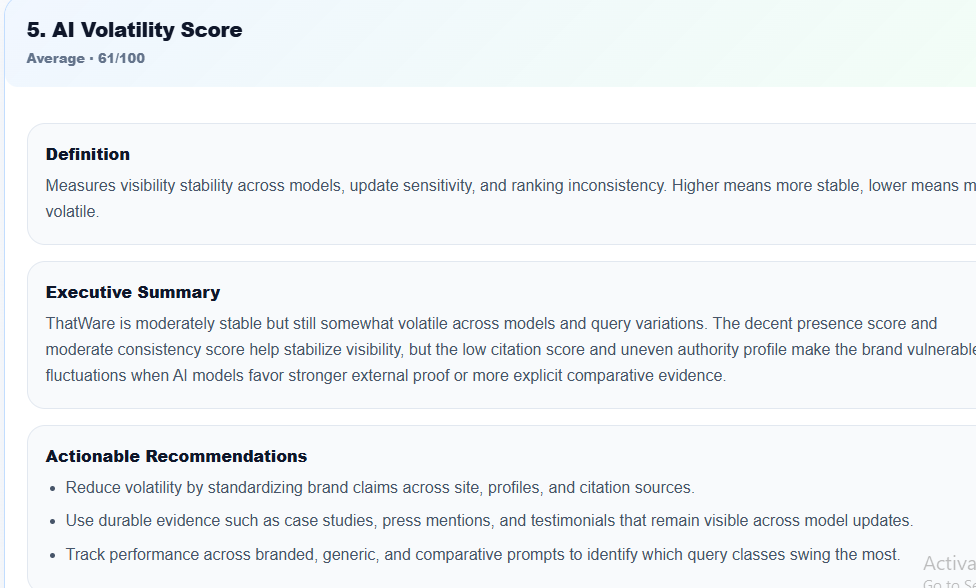
This section evaluates ThatWare’s AI Volatility Score, a metric designed to measure how consistently the brand maintains visibility across different AI models, prompt variations, platform updates, and recommendation scenarios. With a score of 61 out of 100, ThatWare falls within the Average category, indicating a reasonably stable AI presence but one that remains susceptible to fluctuations under changing conditions.
Volatility is an increasingly important concept in the era of generative search because AI-generated responses are not static. Unlike traditional search rankings, AI outputs can vary significantly depending on model updates, prompt wording, training data adjustments, contextual interpretation, and competitive signals. As a result, brands that appear prominently today may experience visibility shifts tomorrow if their authority signals are not sufficiently reinforced.
The executive summary suggests that ThatWare benefits from a strong presence score and moderate consistency performance, which help create a foundation of stability across AI-generated responses. These factors indicate that the brand has established enough topical relevance to remain visible in many query environments. However, the report also highlights that weaker citation strength and an uneven authority profile can create vulnerability when AI systems place greater emphasis on external validation, comparative evidence, or trusted third-party sources.
A brand may appear prominently today and disappear tomorrow.
It may rank highly in ChatGPT but poorly in Claude.
It may perform well for one topic but collapse for another.
Volatility measures these fluctuations.
Think of it as the stock market equivalent of AI visibility.
Some brands are stable blue-chip assets.
Others experience dramatic visibility swings.
Why It Matters
Future AI optimization will not be about achieving visibility once.
It will be about maintaining visibility consistently.
Many organizations mistakenly assume visibility equals dominance.
In reality:
Visibility + Stability = Sustainable AI Influence
If your brand’s visibility fluctuates wildly between models, updates, or query types, your long-term AI presence becomes unreliable.
What Causes AI Volatility?
Common causes include:
- AI model updates
- Knowledge refresh cycles
- Weak entity signals
- Insufficient citations
- Seasonal content trends
- Competitor improvements
- Inconsistent authority signals
How It Is Measured
| Signal | Weight |
|---|---|
| Cross-Model Stability | 35% |
| Query Stability | 25% |
| Update Resistance | 20% |
| Recommendation Consistency | 20% |
Formula
AI Volatility Score = 100 − [(Cross Model Variation × 0.35) + (Query Variation × 0.25) + (Update Sensitivity × 0.20) + (Recommendation Fluctuation × 0.20)]
Interpretation:
Higher scores indicate lower volatility and greater stability in AI-generated recommendations.Example Calculation
Signal Variation Cross Model Variation 15 Query Variation 10 Update Sensitivity 20 Recommendation Fluctuation 12
Calculation:
100
–
(
15 × 0.35
+
10 × 0.25
+
20 × 0.20
+
12 × 0.20
)= 85.85
Final Volatility Score:
86/100 (rounded from 85.85)
Flowchart
Brand Analysis
↓
Multi-Model Comparison
↓
Time-Based Tracking
↓
Update Impact Assessment
↓
Visibility Stability Analysis
↓
Volatility ScoreInterpretation Guide
Score Meaning 90–100 Extremely Stable 75–89 Stable 60–74 Moderate Stability 40–59 Unstable Below 40 Highly Volatile
Optimization Recommendations
Improve:
- Topic authority
- Citation diversity
- Knowledge graph strength
- Cross-platform consistency
- High-authority references
Reduce dependency on:
- Single content assets
- Single AI ecosystems
- Short-term trends
Impact On AI Visibility
Brands with low volatility become easier for AI systems to trust and recommend repeatedly.
Stability often becomes a competitive advantage.
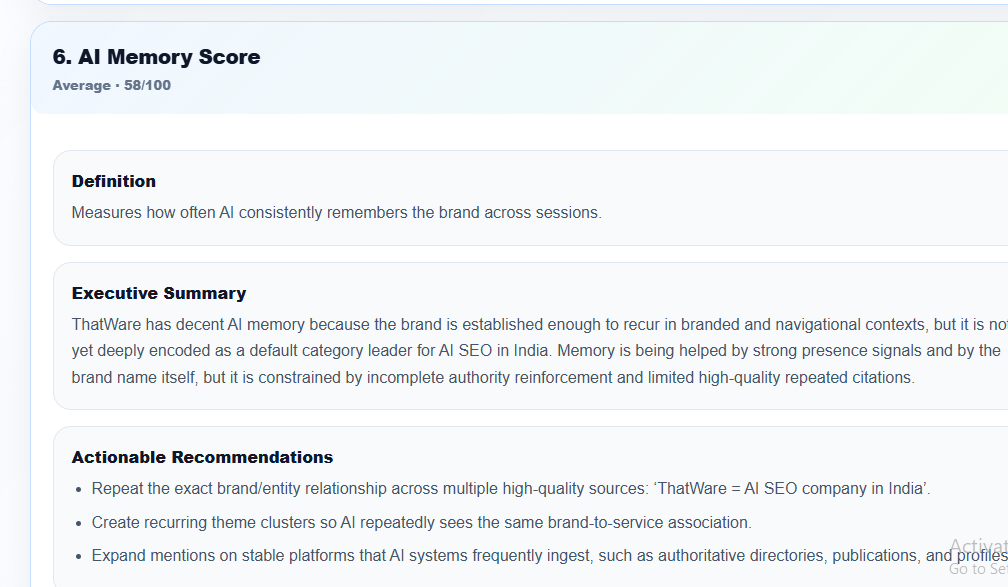
F. AI Memory Score
What Is AI Memory Score?
AI Memory Score measures how consistently AI systems recognize and recall a brand across different sessions, prompts, and discovery environments.
This metric answers a powerful question:
How likely is AI to remember your brand tomorrow?
Many brands achieve temporary visibility.
This section analyzes ThatWare’s AI Memory Score, a metric that measures how consistently AI systems retain and recall the brand across multiple interactions, sessions, prompts, and contextual scenarios. With a score of 58 out of 100, the brand falls within the Average category, indicating that AI platforms can recognize and recall ThatWare in many situations, but the brand has not yet achieved the level of memory persistence typically associated with category-defining market leaders.
AI memory is an emerging concept within AI Search Optimization (AISO) and Generative Engine Optimization (GEO). Unlike traditional search engines, which primarily retrieve indexed information, modern AI systems build contextual associations between brands, topics, services, and industry concepts. The stronger these associations become, the more likely a brand is to reappear consistently across future AI-generated responses.
The executive summary indicates that ThatWare has developed a respectable level of AI memory due to its established brand presence and recurring visibility within branded and navigational searches. This means AI systems already recognize the company as a known entity within the SEO and AI SEO ecosystem. However, the report also highlights an important limitation: the brand has not yet achieved deep category-level memory as a default authority for AI SEO, AEO, or enterprise SEO-related topics.
Few achieve persistent memory.
Why It Matters
Human memory influences brand recognition.
AI memory influences AI recognition.
When AI repeatedly associates a company with a topic, category, service, or industry, memory begins to form.
Eventually, the brand becomes a default recommendation.
This is often how category leaders emerge.
The AI Memory Principle
Repeated exposure creates stronger associations.
AI SEO
↓
ThatWare
CRM
↓
Salesforce
Electric Vehicles
↓
Tesla
The stronger these associations become, the higher the memory score.
How It Is Measured
| Signal | Weight |
|---|---|
| Repeated Mentions | 30% |
| Cross Session Recall | 30% |
| Entity Persistence | 25% |
| Topic Recall Strength | 15% |
Formula
AI Memory Score = (Repeated Mentions × 0.30) + (Session Recall × 0.30) + (Entity Persistence × 0.25) + (Topic Recall × 0.15)
Example
Signal Score Repeated Mentions 90 Session Recall 80 Entity Persistence 85 Topic Recall 75
Result
AI Memory Score = 83.50
Final Memory Score
84/100 (rounded from 83.50)
Flowchart
AI Query
↓
Brand Recognition
↓
Repeated Exposure
↓
Entity Reinforcement
↓
Recall Validation
↓
Memory Score
Interpretation Guide
| Score | Meaning |
|---|---|
| 90+ | Deep Memory |
| 75–89 | Strong Memory |
| 60–74 | Moderate Memory |
| 40–59 | Weak Memory |
| Below 40 | Memory DeficitOnly one has positive sentiment |
Optimization Recommendations
Increase:
- Consistent entity references
- Founder visibility
- Branded citations
- Category ownership content
- Knowledge graph connections
Strengthen:
- Semantic consistency
- Topic specialization
- Industry recognition
Impact On AI Visibility
High-memory brands require fewer signals to trigger recommendations.
AI systems naturally recall them more often.
This creates a compounding visibility advantage.
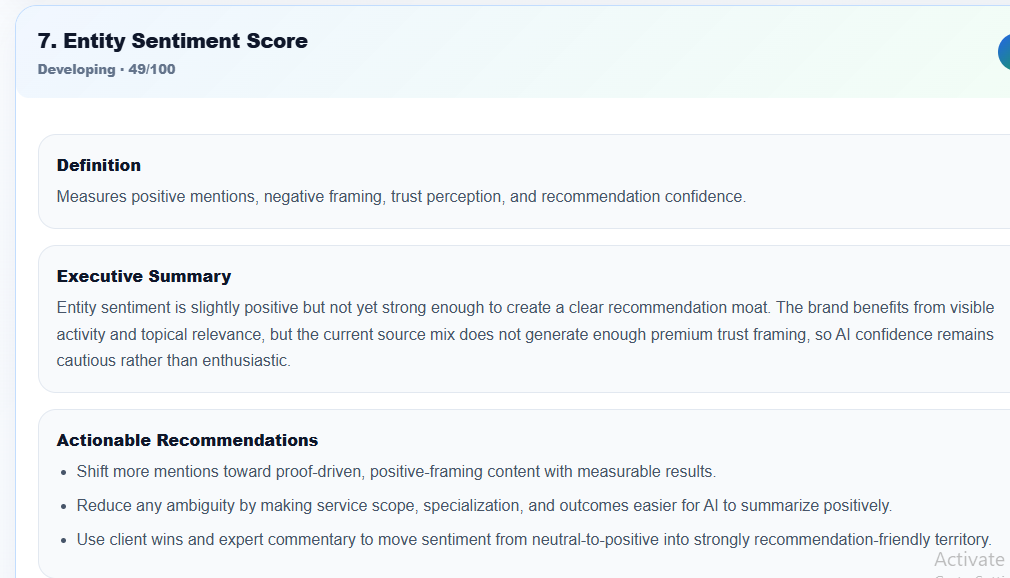
G. Entity Sentiment Score
What Is Entity Sentiment Score?
Entity Sentiment Score evaluates how AI systems perceive the brand emotionally and contextually.
Not all mentions are positive.
This section evaluates ThatWare’s Entity Sentiment Score, which measures how positively AI systems perceive, describe, and recommend the brand across generated responses. With a score of 49 out of 100, the brand is classified within the Developing category, indicating that overall sentiment is moderately positive but not yet strong enough to create a significant competitive advantage in AI-driven recommendations.
Entity sentiment extends beyond simple brand mentions. It assesses how AI systems frame a brand when discussing its expertise, credibility, value proposition, and competitive positioning. In modern AI search environments, brands with strong positive sentiment are more likely to receive enthusiastic recommendations, favorable comparisons, and higher recommendation confidence. Conversely, neutral sentiment often results in cautious or less prominent recommendations, even when visibility and authority signals are present.
The executive summary reveals that ThatWare benefits from strong topical relevance and active visibility within the SEO, AI SEO, and AEO ecosystem. AI systems clearly recognize the brand and associate it with relevant industry topics. However, the current source ecosystem does not yet provide enough premium trust-building signals to create a highly favorable recommendation profile. As a result, AI-generated responses may acknowledge the brand as a legitimate option but stop short of positioning it as a clear market leader.
Some brands are frequently mentioned but negatively framed.
Others receive highly favorable recommendations.
Sentiment helps measure the quality of visibility.
Why It Matters
Being visible is not enough.
Being positively visible matters.
Consider two brands:
Brand A:
- Frequently recommended
- Positive reviews
- Trusted authority
Brand B:
- Frequently mentioned
- Negative complaints
- Weak trust
Both have visibility.
Only one has positive sentiment.
How It Is Measured
| Signal | Weight |
|---|---|
| Positive Mentions | 35% |
| Recommendation Confidence | 25% |
| Trust Perception | 20% |
| Negative Context Suppression | 20% |
Formula
Entity Sentiment = (Positive Mentions × 0.35) + (Recommendation Confidence × 0.25) + (Trust Perception × 0.20) + (Negative Suppression × 0.20)
Example
Signal Score Positive Mentions 90 Recommendation Confidence 85 Trust Perception 80 Negative Suppression 75
Result
Entity Sentiment Score = 83.75
Flowchart
Brand Mentions
↓
Context Analysis
↓
Positive Signal Extraction
↓
Negative Signal Detection
↓
Trust Assessment
↓
Sentiment ScoreInterpretation Guide
Score Meaning 90+ Highly Positive 75–89 Positive 60–74 Neutral 40–59 Negative Below 40 Reputation Risk
Optimization Recommendations
Focus on:
- Reputation management
- Reviews
- Case studies
- Thought leadership
- Authority content
- Customer success stories
Reduce:
- Negative press
- Inconsistent messaging
- Weak customer experiences
Impact On AI Visibility
Positive sentiment increases recommendation confidence.
Negative sentiment suppresses AI recommendations.
Over time, sentiment becomes a major ranking factor in AI-driven recommendations.
H. AI Market Share Visibility
What Is AI Market Share Visibility?
AI Market Share Visibility measures how much of the total AI-generated answer space belongs to your brand within a niche.
Think of it as:
The percentage of AI-generated answers in which your brand appears.
This transforms visibility into market share.
Why It Matters
Traditional SEO measures rankings.
Advanced AVM measures ownership.
If 100 AI-generated answers are produced within your niche:
- How many mention your brand?
- How many mention competitors?
- How much answer territory do you control?
This creates an entirely new way to think about digital visibility.
Example
Suppose AI systems generate:
1000 niche-specific answers
Your brand appears in:
120
Calculation:
120 ÷ 1000 × 100Result:
12%
AI Market Share Visibility
How It Is Measured
Signal Weight Mention Frequency 35% Recommendation Share 30% Query Coverage 20% Competitor Exclusion Rate 15%
Formula
AI Market Share Visibility = (Brand Mentions ÷ Total AI Mentions) × 100
Example Calculation
Metric Value Brand Mentions 220 Total Mentions 1800
Calculation
AI Market Share Visibility
= (220 ÷ 1800) × 100
= 0.1222 × 100
= 12.2%
Result
AI Market Share Visibility = 12.2%
Flowchart
Industry Queries
↓
AI Generated Answers
↓
Brand Mentions
↓
Competitor Mentions
↓
Share Calculation
↓
Market Share Visibility
Interpretation Guide
Score Meaning 25%+ Market Leader 15–24% Strong Presence 8–14% Competitive 4–7% Emerging Below 4% Weak Presence
Optimization Recommendations
Increase:
- Discoverability
- Trust
- Citation coverage
- Topic authority
- Entity dominance
Expand:
- Query coverage
- Comparative content
- Industry references
Impact On AI Visibility
This metric represents one of the clearest indicators of AI market leadership.
The higher the market share visibility, the more frequently AI systems expose users to the brand.
Closing Thoughts for Part 2 (E-H)
If Part 1 (A – D) focused on whether AI systems can discover, trust, understand, and recommend a brand, Part 2 focuses on something even more valuable:
Whether those recommendations can endure.
AI Volatility measures stability.
AI Memory measures recall.
Entity Sentiment measures perception.
AI Market Share Visibility measures influence.
Together, these four metrics reveal how deeply a brand is embedded within the AI discovery ecosystem.
In Part 3 (I – L), we will complete the Advanced AVM Intelligence Framework with:
- Query Intent Dominance
- AI Citation Depth
- AI Share of Voice
- Public AVM Intelligence Layer
These final metrics move beyond visibility and influence into true AI market ownership.
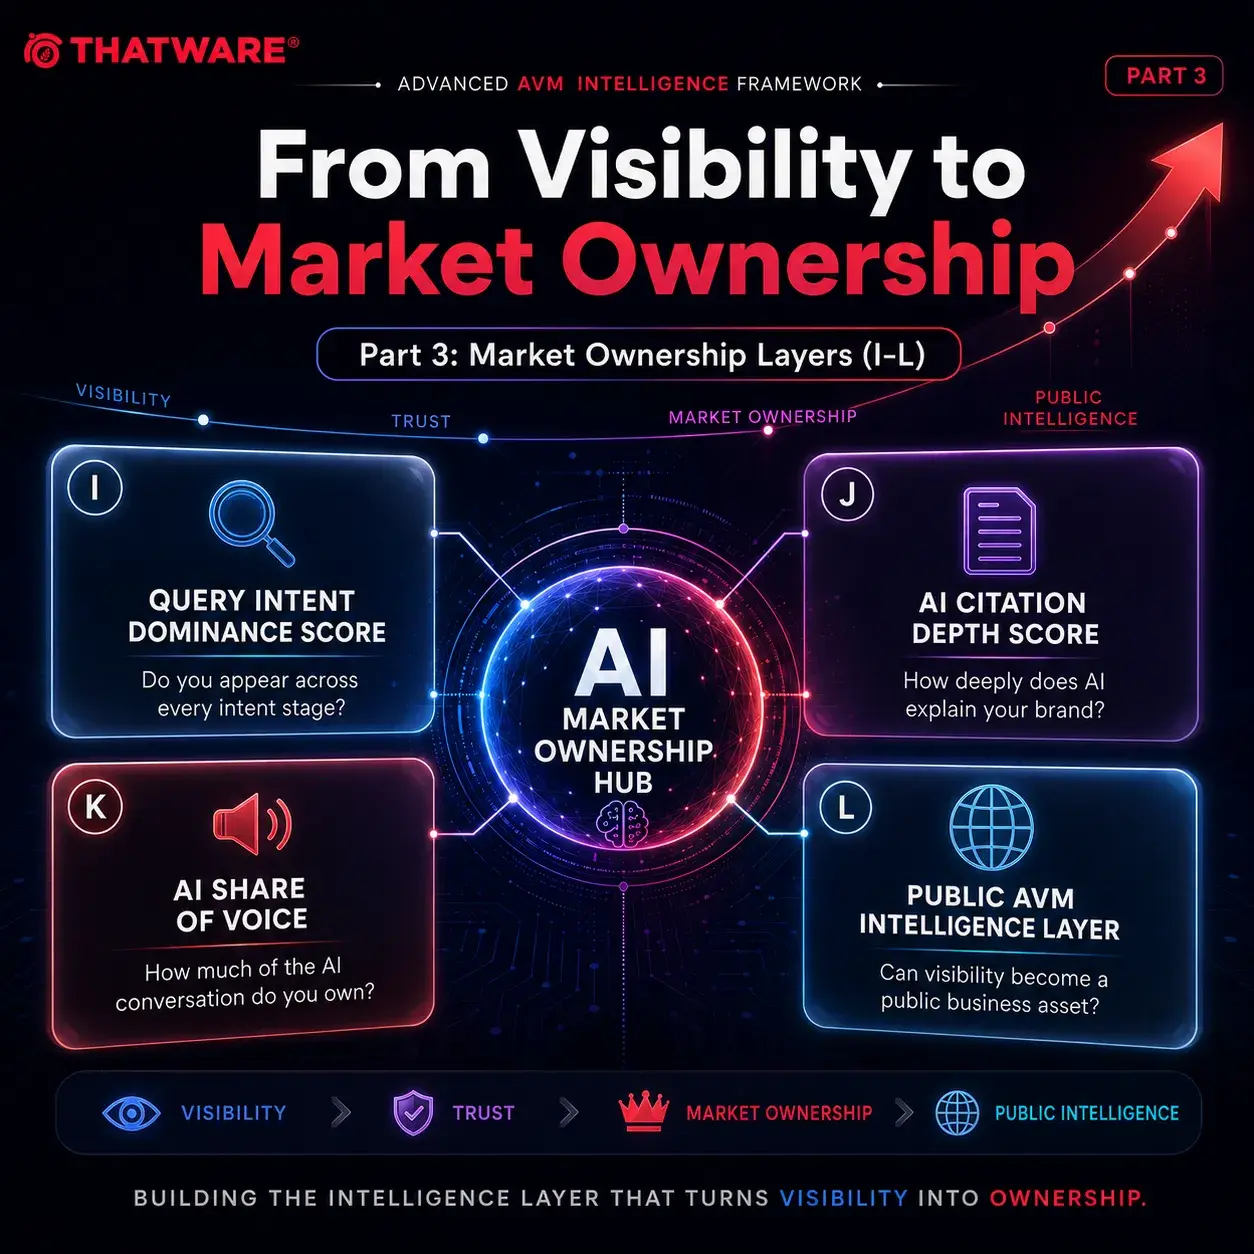
Part 3: From Visibility to Market Ownership (I–L)
In Part 1, we explored whether AI systems can discover, trust, understand, and recommend a brand.
In Part 2, we examined how AI systems remember brands, perceive sentiment, measure market influence, and maintain visibility stability.
Now we arrive at the final layer of the Advanced AVM Intelligence Framework.
This is where visibility transforms into ownership.
These metrics answer questions such as:
- Which types of user intent does your brand dominate?
- How deeply does AI explain your brand?
- How much of the AI conversation belongs to you?
- How can visibility become a publicly measurable business asset?
These are the metrics that separate participants from leaders.
Welcome to the final stage of Advanced AVM Intelligence.
I. Query Intent Dominance Score
What Is Query Intent Dominance?
Query Intent Dominance measures how effectively a brand appears across different search intent categories within AI-generated answers.
Most visibility systems treat all searches equally.
AI systems do not.
Different query types represent different stages of the customer journey.
For example:
- “What is AI SEO?” → Informational
- “Best AI SEO agency” → Commercial
- “Hire AI SEO company” → Transactional
- “ThatWare” → Navigational
- “ThatWare vs Competitor” → Comparative
A brand may dominate informational searches while being absent from commercial searches.
That distinction matters.
Why It Matters
Not all visibility creates revenue.
Being visible in informational searches builds awareness.
Being visible in commercial and transactional searches drives business.
Brands that dominate multiple intent categories gain disproportionate market influence.
Query Intent Categories
| Intent Type | Purpose |
|---|---|
| Informational | Education |
| Commercial | Evaluation |
| Transactional | Purchase |
| Navigational | Brand Discovery |
| Comparative | Competitive Analysis |
How It Is Measured
| Signal | Weight |
|---|---|
| Informational Dominance | 20% |
| Commercial Dominance | 25% |
| Transactional Dominance | 25% |
| Navigational Dominance | 10% |
| Comparative Dominance | 20% |
Formula
Query Intent Dominance = (Informational × 0.20) + (Commercial × 0.25) + (Transactional × 0.25) + (Navigational × 0.10) + (Comparative × 0.20)
Example Calculation
Intent Score Informational 90 Commercial 80 Transactional 70 Navigational 95 Comparative 75
Calculation
Query Intent Dominance
= (90 × 0.20) + (80 × 0.25) + (70 × 0.25) + (95 × 0.10) + (75 × 0.20)
= 18.00 + 20.00 + 17.50 + 9.50 + 15.00
= 80.00
Result
Query Intent Dominance Score = 80.00
Flowchart
User Queries
↓
Intent Classification
↓
Brand Mention Analysis
↓
Visibility Per Intent
↓
Intent Weighting
↓
Dominance ScoreInterpretation Guide
Score Meaning 90+ Intent Leader 75–89 Strong Intent Coverage 60–74 Moderate Coverage 40–59 Intent Gap Below 40 Weak Presence
Optimization Recommendations
Strengthen:
- Commercial landing pages
- Comparison content
- Product/service explainers
- Case studies
- Buyer-focused content
Ensure visibility exists across all intent stages.
Impact On AI Visibility
Brands dominating multiple intent categories become significantly harder for competitors to displace.
J. AI Citation Depth Score
What Is AI Citation Depth?
Most visibility systems measure whether a brand is mentioned.
Citation Depth measures how deeply AI systems discuss the brand.
There is a major difference between:
“ThatWare is an SEO company.”
And
“ThatWare is an AI-driven SEO company known for Hyper-Intelligence SEO, AVM, VEM, AIEO, and advanced AI visibility frameworks.”
Both are mentions.
Only one is a meaningful citation.
Why It Matters
The future of AI search is not mention-based.
It is explanation-based.
Brands receiving deeper explanations gain:
- More trust
- More authority
- More recommendation strength
- More visibility persistence
Citation Levels
Level 1
Shallow Mention
Example:
ThatWare is an SEO company.Level 2
Basic Explanation
Example:
ThatWare is an AI SEO agency.Level 3
Detailed Explanation
Example:
ThatWare specializes in AI SEO,AEO, GEO, and advancedvisibility frameworks.Level 4
Comparative Recommendation
Example:
Compared to competitors,ThatWare offers proprietaryAI visibility technologies.
How It Is Measured
| Signal | Weight |
|---|---|
| Mention Depth | 30% |
| Explanation Quality | 30% |
| Comparative Context | 20% |
| Recommendation Detail | 20% |
Optimization Recommendations
Increase:
- Original research
- Industry frameworks
- Proprietary methodologies
- Expert content
- Authoritative resources
Give AI systems more material to explain.
Impact On AI Visibility
Deeper citations increase recommendation confidence and long-term AI trust.
K. AI Share of Voice (AI SOV)
What Is AI Share of Voice?
AI Share of Voice measures how much of the AI conversation belongs to your brand compared to competitors.
This is one of the most powerful competitive metrics in Advanced AVM.
Instead of asking:
“Do we appear?”
It asks
“How much of the conversation do we own?”
Why It Matters
Imagine a market generating:
- 10,000 AI recommendations
Competitor A appears:
- 4,000 times
Competitor B appears:
- 3,000 times
Your brand appears:
- 2,500 times
Others:
- 500 times
You do not own the market.
You own only part of it.
SOV quantifies that ownership.
Formula
AI SOV = (Brand Mentions ÷ Total Industry Mentions) × 100
Example
| Metric | Value |
|---|---|
| Brand Mentions | 2500 |
| Industry Mentions | 10000 |
Calculation
AI SOV (Share of Voice)
= (2500 ÷ 10000) × 100
= 0.25 × 100
= 25%
Result
AI Share of Voice = 25%
Flowchart
Industry Queries
↓
AI Responses
↓
Brand Mentions
↓
Competitor Mentions
↓
Market Comparison
↓
SOV Score
Interpretation Guide
Score Meaning 30%+ Category Leader 20–29% Strong Market Influence 10–19% Competitive Presence 5–9% Emerging Brand Below 5% Limited Voice
Optimization Recommendations
Increase:
- Category authority
- AI discoverability
- Trust signals
- Citation depth
- Entity dominance
Impact On AI Visibility
Share of Voice often predicts future market leadership before traditional rankings do.
L. Public AVM Intelligence Layer
What Is Public AVM Intelligence?
The Public AVM Layer transforms AI visibility from an internal metric into a public business asset.
Traditionally:
Visibility reports stay inside organizations.
With Advanced AVM Intelligence:
Visibility becomes shareable.
Example:
Our AVM increased from 43 to 71.This turns visibility into:
- Social proof
- Brand credibility
- Market differentiation
- Public performance validation
Why It Matters
Humans trust visible success.
Public AVM creates:
- Competitive differentiation
- Public accountability
- Market awareness
- Community engagement
How It Is Measured
The public layer combines:
- AVM Score
- Discoverability
- Trust
- Dominance
- Share of Voice
- Recommendation Probability
into a shareable intelligence snapshot.
Example
Brand:ThatWareAVM:87Discoverability:91Trust:89Recommendation Probability:88%AI SOV:27%Market Position:LeaderFlowchart
AVM Analysis
↓
Intelligence Scores
↓
Performance Snapshot
↓
Public Share Link
↓
Social Distribution
↓
Brand Amplification
Interpretation Guide
Level Meaning Elite Top Market Leader Advanced Strong Visibility Competitive Above Average Emerging Growing Presence Weak Limited Visibility
Optimization Recommendations
Encourage:
- Public reporting
- Benchmark sharing
- Industry comparisons
- Quarterly visibility reports
Impact On AI Visibility
Public visibility creates additional mentions, discussions, references, and citations.
This often strengthens future AI visibility loops.
How All Advanced AVM Metrics Work Together
The twelve intelligence layers form a complete AI visibility ecosystem.
Discoverability ↓Trust ↓Entity Dominance ↓Answer Probability ↓Volatility ↓Memory ↓Sentiment ↓Market Share ↓Intent Dominance ↓Citation Depth ↓Share of Voice ↓Public IntelligenceEach metric strengthens the next.
Together they create a comprehensive model for measuring AI influence.
Enterprise Applications
Advanced AVM Intelligence can be applied across multiple industries.
Enterprise Brands
Monitor AI market leadership.
SEO Agencies
Demonstrate AI visibility performance.
SaaS Companies
Track recommendation share.
Ecommerce Brands
Measure category ownership.
Reputation Teams
Monitor trust and sentiment.
Investors
Evaluate AI-driven brand strength.
Marketing Teams
Identify visibility gaps before competitors do.
The Future of AI Visibility Intelligence
The future of search will not be based solely on rankings.
It will be based on:
- Recommendation frequency
- Trust signals
- Entity ownership
- Memory persistence
- Market influence
- AI-driven decision making
Search engines ranked pages.
AI systems rank confidence.
That shift changes everything.
Organizations that understand AI intelligence today will have a significant advantage tomorrow.
Final Conclusion
The original AI Visibility Metric introduced a new way to measure whether brands appear within AI-generated answers.
Advanced AVM Intelligence goes much further.
It measures:
- Whether AI can discover you.
- Whether AI trusts you.
- Whether AI remembers you.
- Whether AI recommends you.
- Whether AI explains you.
- Whether AI perceives you positively.
- Whether you dominate user intent.
- Whether you own market share.
- Whether you control the conversation.
These twelve intelligence layers collectively represent a new generation of AI visibility measurement.
As AI-driven discovery continues to reshape search behavior, businesses will increasingly need more than rankings, traffic, and backlinks.
They will need visibility intelligence.
They will need recommendation intelligence.
They will need market ownership intelligence.
That is the vision behind the Advanced AVM Intelligence Framework.
The future winners of AI search will not simply be the brands that are visible.
They will be the brands that AI systems trust, remember, explain, recommend, and ultimately choose.
