SUPERCHARGE YOUR Online VISIBILITY! CONTACT US AND LET’S ACHIEVE EXCELLENCE TOGETHER!
Introduction
As AI search continues to evolve, businesses are increasingly asking a new question:
How visible is my brand inside AI-generated answers?
This question has led to the rise of AI Visibility Metrics (AVM), an AVM framework designed to measure brand visibility across AI-powered search ecosystems.

However, visibility scores often create another question:
How is the score actually calculated?
This is where scoring AVM Scoring Methodology becomes important.
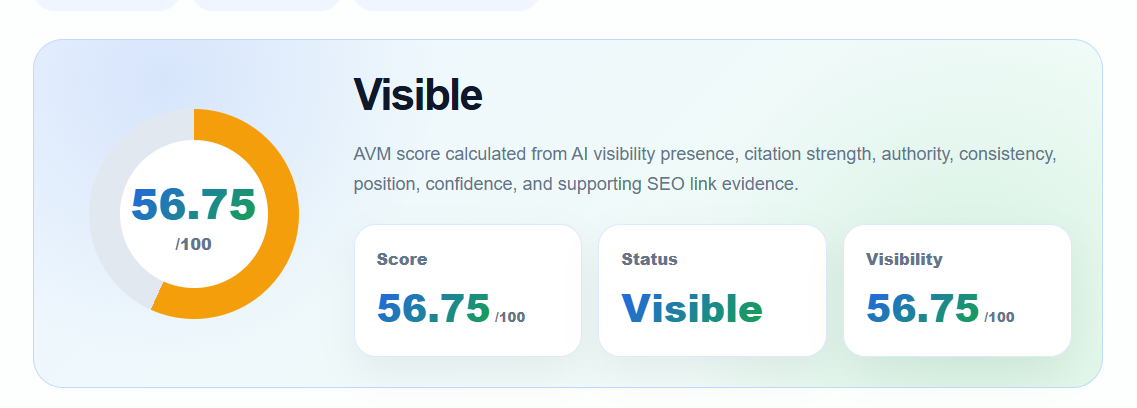
This dashboard presents the final AI Visibility Metric (AVM) score for ThatWare, serving as the consolidated outcome of all visibility, authority, citation, consistency, position, confidence, and supporting evidence analyses conducted throughout the assessment. The brand achieves an overall AVM score of 56.75 out of 100, placing it within the “Visible” category.
The AVM score functions as a holistic measurement of how effectively a brand is recognized, referenced, validated, and recommended across AI-powered search ecosystems. Unlike traditional SEO metrics that focus primarily on rankings, traffic, and backlinks, AVM evaluates a broader spectrum of signals that influence how AI systems discover and interpret brands when generating answers.
A visibility score without a methodology is simply a number.
A visibility score backed by a structured scoring engine becomes actionable intelligence.
Understanding how scores are generated helps organizations identify strengths, weaknesses, opportunities, and future optimization priorities.
This article explores the logic behind AI visibility scoring and explains how raw AI visibility data can be transformed into meaningful business intelligence.
Why Scoring Methodology Matters
Imagine two brands.
Brand A receives an AVM Score of:
78Brand B receives:
64At first glance, Brand A appears stronger.
But without understanding the scoring process, the numbers themselves provide very little value.
The real question becomes:
- Why did Brand A score higher?
- Which signals contributed most?
- Which signals need improvement?
- What actions could increase the score?
This is where a scoring methodology becomes useful.
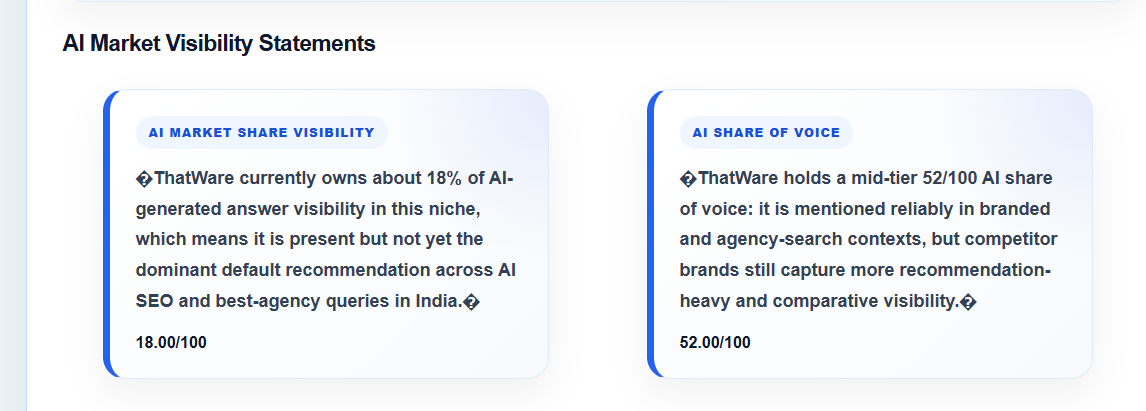
This section provides a strategic view of ThatWare’s competitive standing within AI-powered search ecosystems through two critical metrics: AI Market Share Visibility and AI Share of Voice. Together, these indicators measure not only whether the brand appears in AI-generated responses, but also how much of the overall AI conversation and recommendation landscape it currently controls compared to competing entities.
The first metric, AI Market Share Visibility (18/100), reveals that ThatWare currently captures approximately 18% of AI-generated answer visibility within its target niche. This indicates that the brand has established a measurable presence in AI search environments and is being surfaced for relevant industry queries. However, the score also highlights that the company has not yet achieved dominant market ownership within AI-generated recommendations. A significant portion of visibility is still distributed among competing brands that possess stronger authority, citation networks, and recommendation signals.
The second metric, AI Share of Voice (52/100), paints a more encouraging picture. This score indicates that ThatWare maintains a moderate presence across AI-generated discussions and is regularly mentioned within branded, agency-related, and service-specific search contexts. AI systems clearly recognize the brand and include it in relevant conversations. However, competitors continue to command a larger share of recommendation-focused and comparison-driven responses, limiting ThatWare’s ability to dominate category-level discussions.
It transforms data into direction.
From Raw Data to Visibility Intelligence
AI systems generate enormous amounts of information.
Some of that information can be measured.
Examples include:
- Brand mentions
- AI recommendations
- Citations
- Competitive appearances
- Visibility consistency
- Positioning strength
However, raw data alone does not create insight.
It must first be processed.
AVM Scoring Architecture
Together, these metrics illustrate an important distinction between visibility and influence. While the brand is visible and recognized by AI systems, it does not yet control a large enough share of AI-generated recommendations to establish category leadership. To increase market share visibility and share of voice, the brand must strengthen its authority ecosystem, improve citation quality, expand comparative content, and secure broader third-party validation across trusted industry sources.
From an AI Search Optimization (AISO) perspective, these metrics are particularly valuable because they measure competitive ownership rather than individual performance. They help organizations understand how much attention, recommendation exposure, and conversational influence they control relative to other brands competing for the same audience.
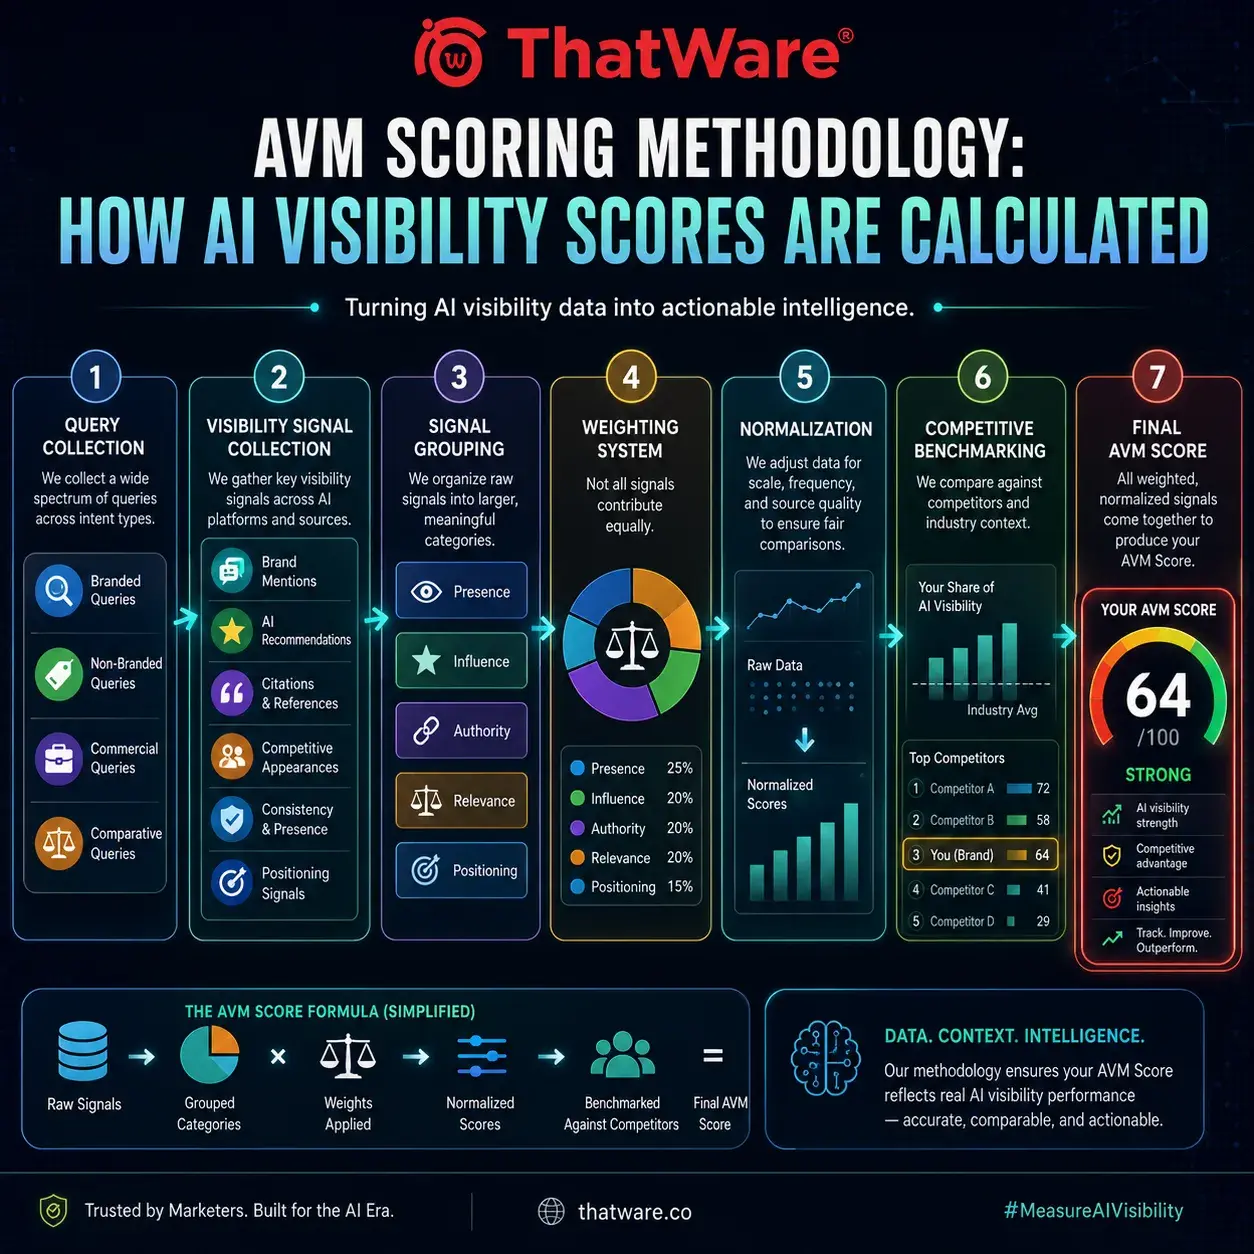
Query Collection
↓
AI Analysis
↓
Visibility Signals
↓
Weight Assignment
↓
Normalization
↓
Score Generation
↓
AVM Score
The goal of the scoring engine is to convert hundreds or thousands of visibility signals into a single understandable number.
Step 1: Query Collection
The process begins by collecting queries.
These queries may include:
Branded Queries
ThatWareThatWare SEOThatWare AI SEONon-Branded Queries
Best SEO AgencyAI SEO CompanyAEO ServicesCommercial Queries
Hire SEO AgencyBest Enterprise SEO FirmComparative Queries
ThatWare vs CompetitorBest SEO Agencies in IndiaThe wider the query set, the more reliable the visibility analysis becomes.
Step 2: Visibility Signal Collection
Once queries are analyzed, visibility signals are extracted.
Examples include:
| Signal Type | Description |
|---|---|
| Brand Mentions | How often the brand appears |
| Citations | References supporting the mention |
| Position | Placement within AI answers |
| Consistency | Frequency of appearance |
| Confidence | Reliability of appearance |
| Authority Indicators | Trust-based supporting sign |
These become the raw ingredients used by the scoring engine.
Step 3: Signal Grouping
Individual signals are grouped into larger scoring categories.
For example:
Raw Mention Data
↓
Presence Signals
Reference Data
↓
Citation Signals
Authority Data
↓
Authority Signals
This allows the system to evaluate visibility from multiple perspectives rather than relying on a single metric.
The Six Core Signal Groups
Most AI visibility scoring models rely on six primary signal groups.
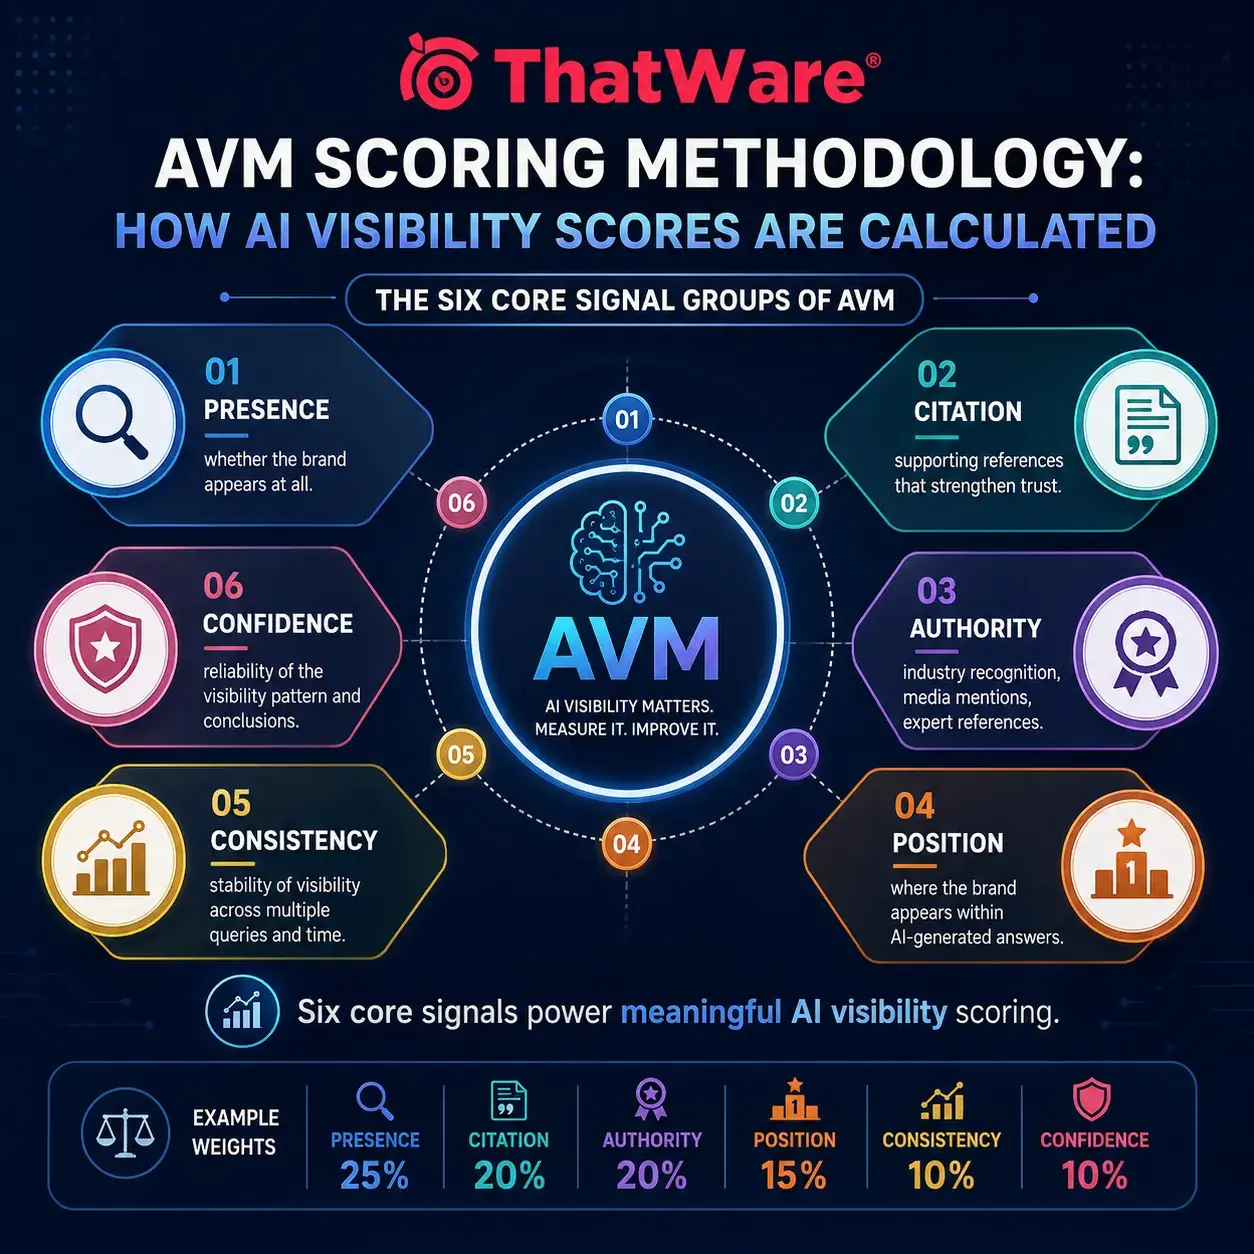
1. Presence Signals
Presence measures whether the brand appears.
Without presence, no other signal matters.
Example:
| Query | Mentioned? |
|---|---|
| Best AI SEO Agency | Yes |
| Enterprise SEO Company | Yes |
| AI Marketing Agency | No |
Presence forms the foundation of visibility scoring.
2. Citation Signals
Citation signals measure supporting references.
Example:
Brand Mention +Supporting Citationgenerally creates stronger visibility than:
Brand Mention Onlybecause supporting references increase trust.
3. Authority Signals
Authority signals evaluate credibility.
Examples include:
- Industry recognition
- Research publications
- Media mentions
- Expert references
Authority strengthens visibility confidence.
4. Position Signals
Position evaluates placement.
Example:
Response A
1. Brand A2. Brand B3. Brand CResponse B
1. Brand C2. Brand B3. Brand AAll brands appear.
But visibility value differs.
Position influences scoring.
5. Consistency Signals
Consistency measures stability.
Example:
Query Mention Query 1 Yes Query 2 Yes Query 3 Yes Query 4 Yes
6. Confidence Signals
Confidence evaluates reliability.
The goal is to determine whether visibility patterns are strong enough to support meaningful conclusions.
Why Weighting Matters
Not all signals contribute equally.
For example:
Being visible matters more than ranking highly if the brand never appears.
This creates the need for weighting.
Example Weight Distribution
| Signal | Weight |
|---|---|
| Presence | 25% |
| Citation | 20% |
| Authority | 20% |
| Position | 15% |
| Consistency | 10% |
| Confidence | 10% |
This weighting creates balance across multiple visibility dimensions.
Understanding Normalization
One of the most misunderstood aspects of scoring systems is Normalization Logic.
Raw numbers can be misleading.
Example:
| Brand | Mentions |
|---|---|
| Brand A | 500 |
| Brand B | 250 |
At first glance, Brand A appears twice as visible.
However:
- Query volume may differ
- Industry size may differ
- Competitor density may differ
Normalization adjusts data so meaningful comparisons can occur.
Normalization Flow
Raw Data
↓
Scale Adjustment
↓
Relative Comparison
↓
Standardized Values
Without normalization, scoring becomes unreliable.
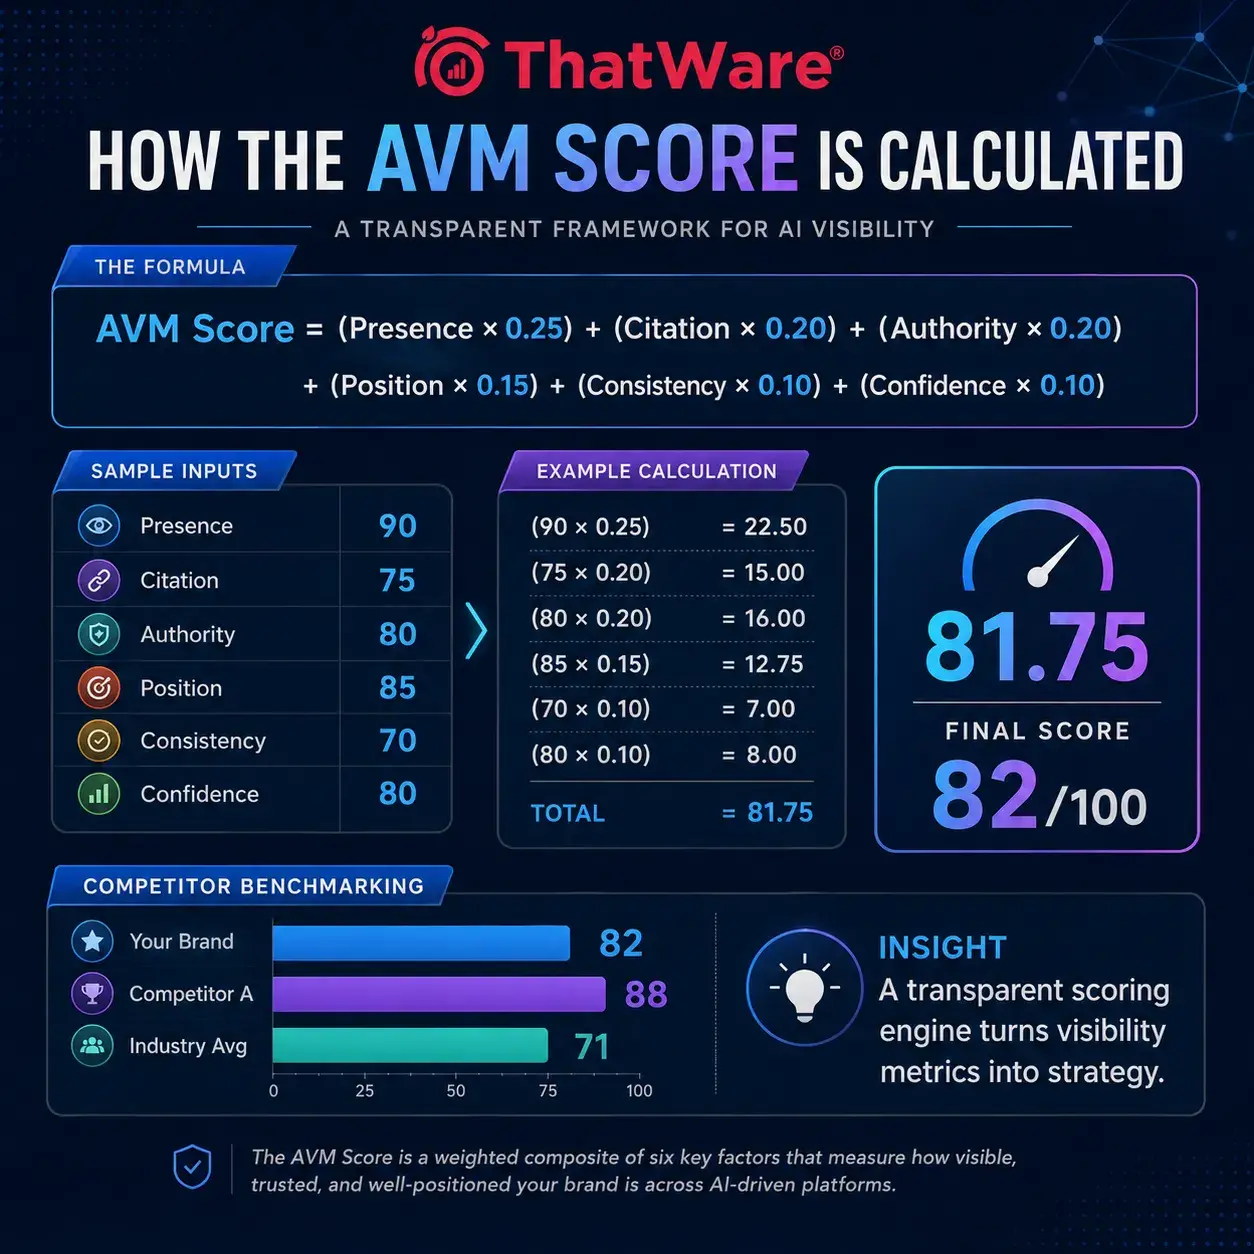
Example Score Calculation
Imagine the following results:
| Signal | Score | Weight |
|---|---|---|
| Presence | 90 | 25% |
| Citation | 75 | 20% |
| Authority | 80 | 20% |
| Position | 85 | 15% |
| Consistency | 70 | 10% |
| Confidence | 80 | 10% |
Formula
AVM Score=(Presence × 0.25)+(Citation × 0.20)+(Authority × 0.20)+(Position × 0.15)+(Consistency × 0.10)+(Confidence × 0.10)Calculation
(90 × .25)+(75 × .20)+(80 × .20)+(85 × .15)+(70 × .10)+(80 × .10)=81.75Final Score:
82/100
This number becomes significantly more meaningful because the methodology is transparent.
Why Competitor Benchmarking Matters
Visibility does not exist in isolation.
A score should always be interpreted relative to competitors.
Example:
| Brand | Score |
|---|---|
| Competitor A | 87 |
| Your Brand | 82 |
| Competitor B | 70 |
Although 82 appears strong, competitor benchmarking reveals improvement opportunities.
Competitive Visibility Flow
Your Brand
↓
Competitor Comparison
↓
Relative Position
↓
Market Standing
This creates context.
And context creates insight.
What Increases An AVM Score?
Several factors can positively influence visibility performance.
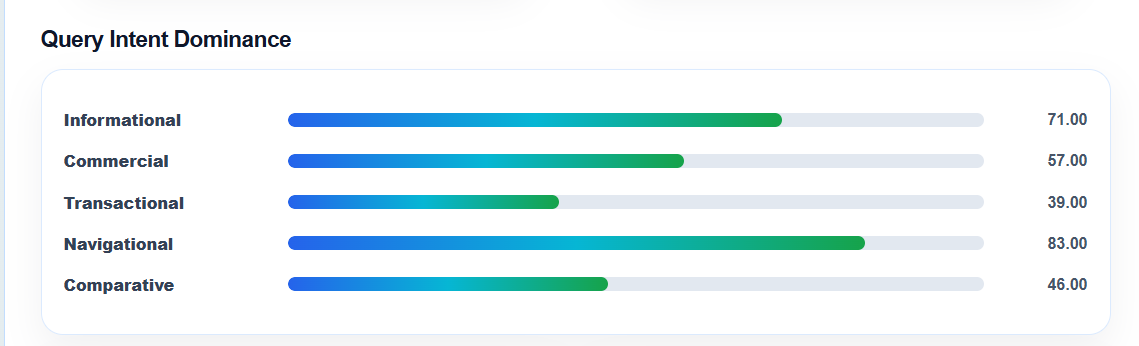
This visualization measures ThatWare’s Query Intent Dominance, providing insight into how effectively the brand performs across different categories of user intent within AI-generated search and recommendation environments. Rather than treating all searches equally, this analysis evaluates visibility and recommendation strength across five distinct intent categories: Informational, Commercial, Transactional, Navigational, and Comparative.
The strongest-performing category is Navigational Intent (83/100), indicating that AI systems have a clear understanding of the brand and can reliably surface ThatWare when users search for the company directly or seek information specifically related to its services. This reflects strong brand recognition and reinforces earlier findings regarding high presence and discoverability scores.
Informational Intent (71/100) also performs strongly, demonstrating that AI systems frequently associate ThatWare with educational and knowledge-based topics related to SEO, AI SEO, AEO, and digital marketing. This suggests that the brand has established meaningful topical relevance and is visible within informational search journeys where users are researching solutions and industry concepts.
The Commercial Intent Score (57/100) represents moderate performance. While AI systems recognize the brand for solution-oriented searches, ThatWare has not yet secured dominant positioning for high-value commercial queries where users are actively evaluating agencies or service providers. Strengthening authority, trust signals, and proof-based content could significantly improve performance in this category.
The largest opportunities emerge within Comparative Intent (46/100) and Transactional Intent (39/100). Comparative searches involve users evaluating alternatives, competitors, and best-in-class solutions, while transactional searches typically indicate strong buying intent. The lower scores suggest that AI systems do not yet consistently position ThatWare as a preferred recommendation when users are making final purchasing decisions or comparing providers side-by-side.
Examples include:
Improved Brand Presence
More AI appearances.
Better Citations
Stronger supporting references.
Enhanced Authority
More trustworthy recognition.
Improved Positioning
Higher placement inside responses.
Greater Consistency
Stable appearances across multiple queries.
Common Misconceptions About Visibility Scores
Misconception #1
More backlinks automatically create higher AVM scores.
Reality:
Backlinks may influence authority, but visibility remains dependent on AI appearances.
Misconception #2
One successful mention guarantees strong visibility.
Reality:
Consistency matters more than isolated appearances.
Misconception #3
High rankings automatically create high AI visibility.
Reality:
Ranking visibility and AI visibility are related but different concepts.
Misconception #4
Scores never change.
Reality:
AI ecosystems evolve constantly.
Visibility is dynamic.
How Businesses Can Use AVM Scores
AVM scores can support:
Competitive Analysis
Understanding relative market visibility.
Trend Monitoring
Tracking visibility changes over time.
Strategic Planning
Identifying areas requiring improvement.
Executive Reporting
Communicating AI visibility performance.
Future Readiness
Preparing for the next generation of search.
The Future of Visibility Scoring
As AI search ecosystems mature, visibility scoring will continue evolving.
Future systems may incorporate:
- Recommendation strength
- Entity intelligence
- Predictive visibility
- AI memory
- Market ownership
- AI ecosystem influence
However, the underlying principle will remain the same.
A score should simplify complexity.
It should help businesses understand visibility in a way that is actionable and measurable.
Final Thoughts
An AI visibility score is not simply a number.
It is the result of a structured methodology designed to evaluate how brands appear across AI-driven search ecosystems.
The purpose of a scoring engine is not to create a score.
The purpose is to create clarity.
By combining visibility signals, weighting systems, normalization processes, and competitive analysis, organizations gain a clearer understanding of their position within AI search.
As AI-generated answers become an increasingly important discovery channel, scoring methodologies will become just as important as the AI Visibility Scores themselves.
After all, visibility is valuable.
But understanding how visibility is measured is what makes improvement possible.
