Lighthouse has always been one of the best tools to check User Experience and Website performance as well as is useful in checking various SEO factors as well.

However recently it has been difficult to generate a Lighthouse report for various other aspects such as:
- Page loads with a warm cache
- Pages with an activated Service Worker
- Accounting for potential user interactions
Most core web vitals metrics are based on or measured on page loads. However, metrics like Cumulative Layout Shift (CLS) is measured for the entire span of a user’s session.
However, the fact that Lighthouse could not measure the above factors meant that it was missing vital information.
Introduction of Lighthouse User Flow
To counteract this, Google has released the new Lighthouse User flow API which allows us to do lab testing at any point during the entire span of a user’s session.
With the help of a puppeteer, we can imitate any user action using puppeteer scripts. During these various interactions, Lighthouse can be invoked at any time to capture multiple key insights in real-time. This means that with the help of the API, we can do performance checks not just during page load, but at any point of user interactions. Accessibility checks can also be done not just in the initial frames but through the entire span of the user session.
Lighthouse can be called at any point while executing almost any puppeteer script to check key metrics and best practices.
Below we will show you a Step by step guide to executing Lighthouse audits on both Warm and Cold navigation.
SetUp
We are going to generate a LightHouse Report using Node.js for both Cold and Warm Navigation
Follow the steps below.
- Download Node.js > https://nodejs.org/en/download/ for Windows
- Install it.
- Download Visual Studio Code and Install.
- Create a Folder with the name “Lighthouse Web”.
- Open the same folder in Visual Studio, in the Screenshot my Folder name is “Lighthouse 2”
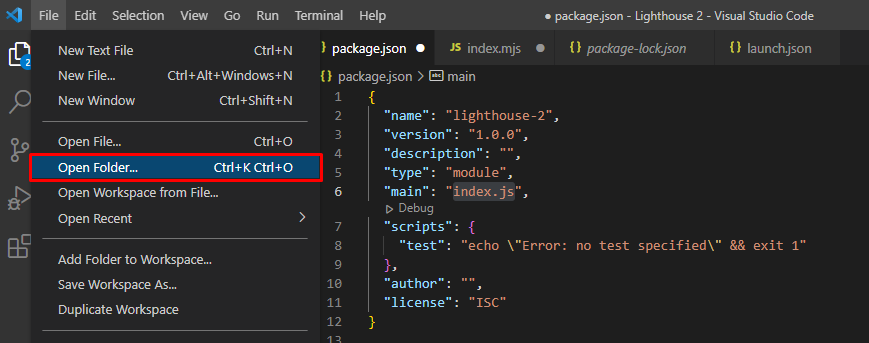

- Open a new terminal, and enter the command npm init, > press enter until package.json shows in the left panel.
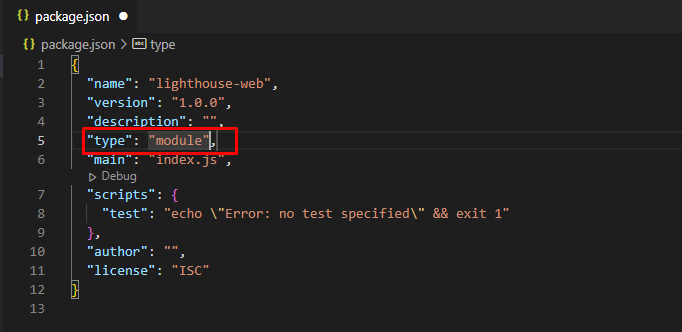
- Click on package.json > enter the following line below the description.
“type”: “module”,
Change the “main” filename to “index.mjs”
- Create a file with the name “index.mjs” under the “Lighthouse Web” folder.
- Go to this URL > https://web.dev/lighthouse-user-flows/
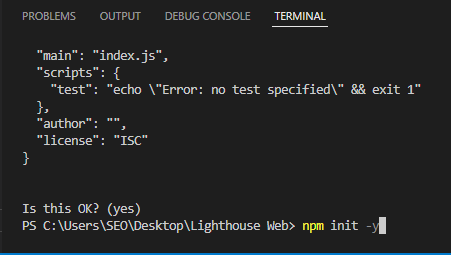
- Enter the following lines in the Terminal Window:
npm init -y
npm install lighthouse puppeteer open
npm install chromium
Wait until the installation is complete
Running Lighthouse Audit on Cold Navigation
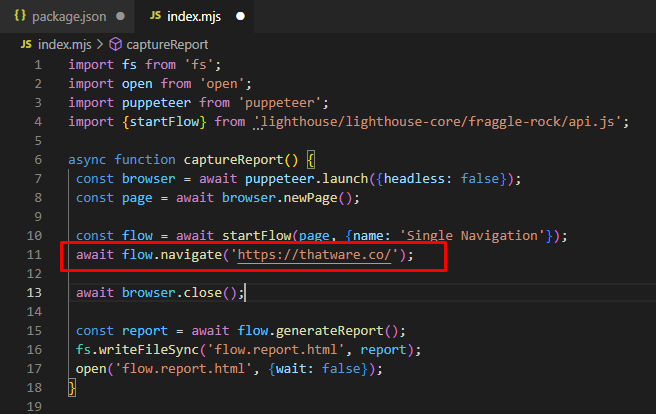
- Click on the index.mjs file and enter the following lines of code.
import fs from ‘fs’;
import open from ‘open’;
import puppeteer from ‘puppeteer’;
import {startFlow} from ‘lighthouse/lighthouse-core/fraggle-rock/api.js’;
async function captureReport() {
const browser = await puppeteer.launch({headless: false});
const page = await browser.newPage();
const flow = await startFlow(page, {name: ‘Single Navigation’});
await flow.navigate(‘https://web.dev/performance-scoring/’);
await browser.close();
const report = await flow.generateReport();
fs.writeFileSync(‘flow.report.html’, report);
open(‘flow.report.html’, {wait: false});
}
captureReport();
- Change the URL in “await flow.navigate(‘https://web.dev/performance-scoring/‘);” to https://thatware.co/
- Run and Debug > select Chrome
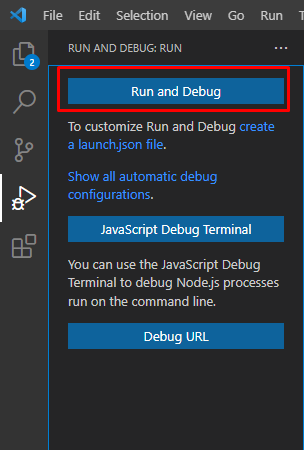
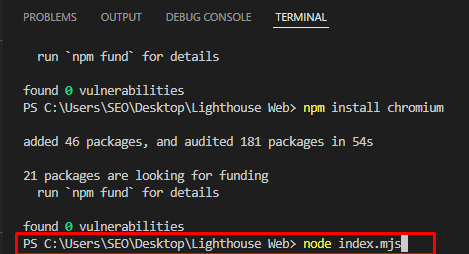
- Click back on the index.mjs tab and go to the Terminal Window.
- Enter the following Line to Run the Code: node index.mjs
This script opens a simple traditional lighthouse report which reports on the important performance metrics and best practices, by deleting the user cache by default.
- The following report will be generated > download it.

As is typical with Lighthouse, this page is loaded with any cache or local storage cleared first, but real users visiting a site will have a mixture of visits with cold and warm caches, and there can be a large performance difference between a cold load like this and a user returning to the page with a still-warm cache.
Running Lighthouse Audit on Warm Navigation
In this mode, Lighthouse disables cache clearing which it does by default. In this way, it can imitate a user loading the page with a warm cache. This type of navigation is called Warm Navigation.
- Go to the Lighthouse Web folder and delete the .vscode folder

- Clear the code in index.mjs file, and enter the following lines of code:
import fs from ‘fs’;
import open from ‘open’;
import puppeteer from ‘puppeteer’;
import {startFlow} from ‘lighthouse/lighthouse-core/fraggle-rock/api.js’;
async function captureReport() {
const browser = await puppeteer.launch({headless: false});
const page = await browser.newPage();
const testUrl = ‘https://thatware.co/’;
const flow = await startFlow(page, {name: ‘Cold and warm navigations’});
await flow.navigate(testUrl, {
stepName: ‘Cold navigation’
});
await flow.navigate(testUrl, {
stepName: ‘Warm navigation’,
configContext: {
settingsOverrides: {disableStorageReset: true},
},
});
await browser.close();
const report = await flow.generateReport();
fs.writeFileSync(‘flow.report.html’, report);
open(‘flow.report.html’, {wait: false});
}
captureReport();
- Run and Debug > Select Chrome
- Run the new code by entering node index.mjs in the Terminal Window.
- The following report will be generated:
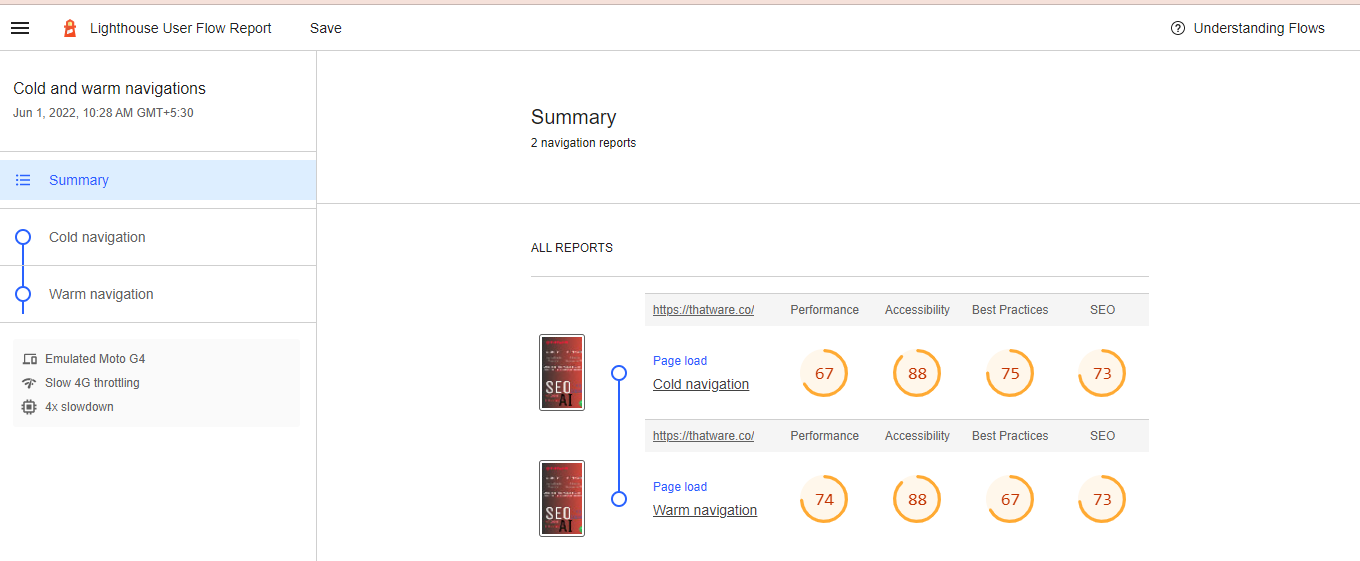
The combination of cold and warm loads offers a fuller picture of what real users are experiencing. If you have a site where users load many pages in the same visit, this may be able to give you a more realistic look at what they’re experiencing in the field.
Enabling User Flow Recording
You can record and examine user interactions on the target web page by turning on the User Flow Recording feature in the Lighthouse audit settings. Here’s how to set this feature up and enable it:
1. Getting into Lighthouse Audit Preferences:
Start with the target webpage by launching a Lighthouse audit with the DevTools feature of the Chrome browser. Click anywhere on the page to open DevTools, or use the keyboard shortcut Ctrl+Shift+I (Cmd+Option+I on Mac) to open it.
To begin a new audit session, navigate to the “Audits” tab in DevTools and select “Run audits.”
2. Activating the User Flow Recorder:
Find the “User Flow Recording” option in the Lighthouse audit settings. To make this feature available, flip the switch.
3. Setting Up Recording Settings:
Give specific instructions on how to record user interactions, such as how many interactions to record and how long to record for:
- Number of Interactions: Select how many keyboard inputs, clicks, scrolls, and other user interactions you want to record for the session. This facilitates the collection of a representative sample of online user activity.
- Duration of Recording Session: Indicate how long you want the recording session to last in minutes or seconds. This establishes the duration for which Lighthouse will record user actions on the webpage.
4. Setting Off the Audit:
Click the “Generate report” or “Run audit” button to start the Lighthouse audit after setting up the User Flow Recording settings. Based on the given parameters, Lighthouse will begin to record user interactions on the target webpage.
Lighthouse will mimic user actions such as clicking links, navigating through content, and utilizing form fields while conducting the audit. Because these exchanges are observed and documented, you can examine user behavior and spot possible problems with usability or areas for improvement.
After the audit is finished, Lighthouse will produce a report with thorough analysis and suggestions based on the user flow that was observed. The report is available for review in DevTools or export for additional analysis and distribution.
By enabling User Flow Recording in Lighthouse audits, you can gain important insights into how users interact with your website, which can help you pinpoint problem areas and successfully optimize the user experience.
Interacting with the Web Page
Understanding and improving the user experience requires interacting with the website to mimic user interactions. Clicks, scrolls, form submissions, and keyboard inputs can all be mimicked to record different user flows and evaluate the functionality, usability, and overall performance of your website. Here’s how to successfully mimic typical user interactions:
1. Scrolls and Clicks:
Clicks on buttons, links, and other navigational elements to move through the website’s sections are simulated by the user. To programmatically initiate click events, use JavaScript or browser automation tools such as Puppeteer. Furthermore, mimics the scrolling motions needed to view content both above and below the fold to give users a smooth browsing experience.
2. Form Submissions:
Fill out forms on the internet by choosing options, entering data, and submitting it. JavaScript can be used to start form submission events and fill form fields with test data or pre-defined values. Verify the behavior of the form, how errors are handled, and the feedback messages to make sure users can submit their work with ease.
3. Keyboard Input:
Use keyboard events to mimic user inputs into text fields, drop-down menus, and other input elements. JavaScript can be used to mimic keystrokes, including character typing, field selection, and keyboard-based actions like tabbing or form submission.
4. Getting Around the Sections:
Go through the website’s various sections to record different user paths and journeys. By visiting landing pages, looking through product categories, examining product details, and gaining access to more resources or information, you can mimic user behavior. Examine the website’s navigability and accessibility to ensure that users can easily explore it.
5. Carrying Out Typical Tasks:
Execute standard procedures that stand in for typical user tasks or workflows. This could be putting products in a shopping cart, checking out, signing up for a newsletter, or using interactive features like accordions, sliders, or carousels. Through the simulation of these actions, it is possible to pinpoint areas of friction, streamline processes, and improve the user experience in general.
Analyzing Lighthouse User Flow Report
You can discover usability problems, obtain important insights into user behavior, and effectively optimize the website to meet user expectations by simulating user interactions on the page. Consistent testing and user engagement with the website contribute to maintaining a user experience that is efficient, intuitive, and pleasurable for users.
Finding opportunities to enhance the user experience and gaining insightful knowledge about how users engage with your website are two benefits of analyzing the Lighthouse User Flow Report. The following describes how to view and analyze the user flow recordings and performance metrics found in the Lighthouse audit results:
1. Getting at the Lighthouse Audit Data:
Once your website has undergone a Lighthouse audit, you can view the audit findings in the DevTools section of the Chrome browser. Click anywhere on the page to open DevTools, or use the keyboard shortcut Ctrl+Shift+I (Cmd+Option+I on Mac) to open it. To view the audit report, navigate to the “Audits” tab in DevTools and select the “Lighthouse” option.
2. Seeing Recordings of User Flow:
To view the recorded user interactions, select the “User Flow Report” tab in the Lighthouse audit report. A visual depiction of user flows, complete with navigation routes, interaction timings, and user engagement metrics, can be found under the User Flow Report tab.
3. Examining Captured User Flows:
You can examine the recorded user flows under the User Flow Report tab to learn more about how users engage and navigate your website. During analysis, keep the following important factors in mind:
- Navigation Paths: Examine the recorded paths to gain insight into how visitors navigate your website. Determine the typical entry and exit points as well as the routes that users take to get to the various parts or functionalities of the website.
- Timings of Interactions: Examine the order and timing of user interactions to gauge how well your website performs and is responsive. Determine the source of any delays or bottlenecks that could affect the user experience, then take action to improve responsiveness and loading times.
- User Engagement Metrics: Determine user satisfaction and level of interest by analyzing user engagement metrics like session duration, bounce rate, and page views. To comprehend user preferences and pain points, observe patterns in user behavior, such as high bounce rates on particular sections or frequent returns to particular pages.
- Error Handling and User Feedback: Take note of any mistakes or strange actions that are noted when interacting with users. To enhance the user experience overall, find the places where users run into mistakes, broken links, or usability problems, then rank the necessary fixes.
4. Putting Insights into Practice:
Implement concrete measures to improve the user experience and optimize your website based on the Lighthouse User Flow Report analysis. Think about putting these tactics into practice:
- To improve user experience and make it simpler for users to find what they’re looking for, optimize navigation routes.
- To decrease friction and increase user engagement, speed up page loads and responsiveness.
- Fix any errors, broken links, and usability problems that the user flow analysis revealed.
- Validate gains in user experience by testing and iterating design and functionality improvements.
You can learn a lot about user behavior, pinpoint areas that need work, and optimize your website to provide a smooth and interesting user experience by examining the Lighthouse User Flow Report. To continuously improve the overall user experience and increase user satisfaction, monitor user flows regularly and iterate on optimizations.
