Recently Google launched a new Core Web Vital metric which will be integrated along with the remaining performance-related metrics shown with the page speed insights test of Google.
Check out > https://pagespeed.web.dev/
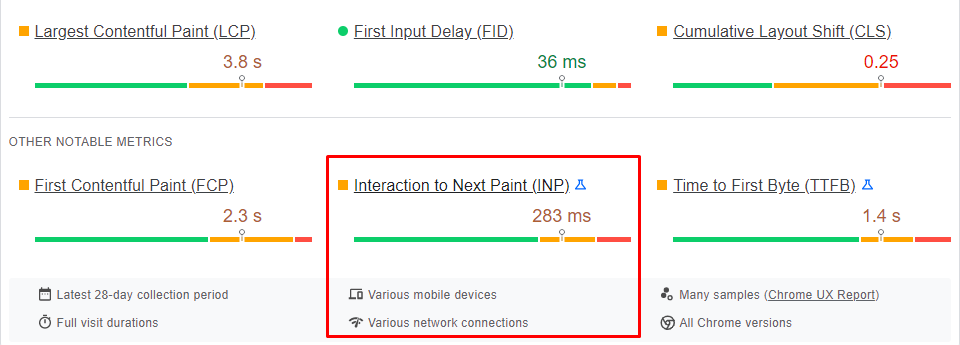
As you can see the INP metric is integrated with the pagespeed insights report.
As per Google’s Definition
“Interaction to Next Paint (INP) is an experimental field metric that assesses responsiveness. INP logs the latency of all interactions throughout the entire page lifecycle. The highest value of those interactions—or close to the highest for pages with many interactions—is recorded as the page’s INP. A low INP ensures that the page will be reliably responsive at all times.”
Google chrome is used by about 52% of all internet users. Hence as per Chrome’s user data, 90% of the user’s session time is spent after the page loads, hence scrutiny of website responsiveness is important as more website’s rely on Javascript for responsiveness.
Responsiveness is measured by Visual Feedback. Visual feedback is what tells us that “when a user clicks on a product” then that product is being added to the cart. The following example can help you differentiate between Good and Bad responsiveness.

Visual feedback for Responsiveness
Good responsiveness is critical to a good user experience. In this article, we’ll talk about how INP works and how to measure it.
How does INP Work?
Basically, INP measures the latency of how pages respond to a particular interaction, also called interaction latency.
For pages with less than 50 interactions, INP is the interaction with the worst latency. For pages with most interactions, INP is often in the 98th percentile.
“An interaction is a set of related input events that fire during the same logical user gesture. For example, “tap” interactions on a touchscreen.”
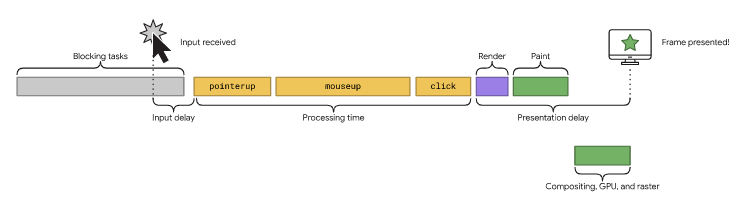
The total duration of interaction consists of the following components.
- The input delay is the time between when the user interacts with the page, and when event handlers execute.
- The processing time is the total amount of time it takes to execute code in associated event handlers.
- The presentation delay is the time between when event handlers have finished executing, and when the browser presents the next frame.
What is an interaction?
When we are considering INP value, and interaction consists of the following:
- Clicking on an interactive element with a mouse.
- Tapping on an interactive element on a device with a touchscreen.
- Pressing a key on either a physical or onscreen keyboard.
Similar to CLS web vital, the INP metric is measured at the end of a user’s session, i.e, when a user leaves the page. This returns a single value which represents the overall responsiveness of the entire web page lifecycle. This is because as per Google
“If high percentile page interactions are responded to quickly, that means that interactions at all lower percentiles are fast as well.”
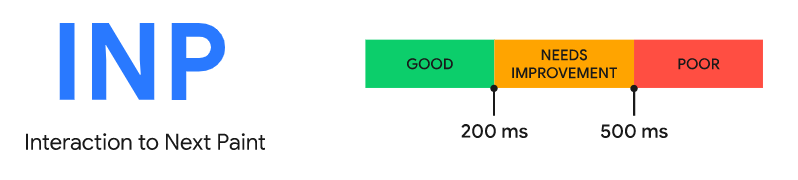
So what’s a good INP Value?
- An INP below or at 200 milliseconds means that your page has good responsiveness.
- An INP above 200 milliseconds and below or at 500 milliseconds means that your page’s responsiveness needs improvement.
- An INP above 500 milliseconds means that your page has poor responsiveness.
When does the Worst Interaction Latency not Considered?
While for many websites whose number of interactions is low, measuring the worst interaction latency might suffice. However, there are other websites which might have a high number of interactions. For example gaming websites.
In these cases measuring the worst latency might be misleading as all websites with heavy interaction, face hiccups, even if they are optimized to be responsive. Hence in these cases, measuring the worst latency may give us the wrong data. These so-called failed or high latency interactions due to server issues must be ignored.
In a nutshell, by focusing on a high percentile of interactions, it can be fairly examined whether the website responds to a vast majority of interactions in a timely fashion.
How is INP different from First Input Delay(FID)?
| Interaction to Next Paint | First Input Delay |
| INP considers all Page interaction | FID only reports the first interaction. It also only measures the input delay, not the processing time of event handlers, or the delay in presenting the next frame. |
| INP is more than about first impressions. It covers the entire spectrum of interactions that can occur from the time the page begins loading to the time the user leaves the page. By sampling all interactions, responsiveness can be assessed comprehensively. This makes INP a more reliable indicator of responsiveness than FID. | The idea behind FID is that during the page loading phase if there is little to no input delay then the page has made a good first impression. |
What happens if the Users never interacted with a Webpage?
Sometimes a page is loaded but no interaction happens. This occurs when:
- User bounced from the page.
- User navigated through the page but didn’t click on any button
- The page is being accessed by a bot.
How to Measure Lighthouse
Field tools
- PageSpeed Insights.
- Chrome User Experience Report (CrUX).
- Via BigQuery in the CrUX dataset’s experimental.interaction_to_next_paint table.
- CrUX API via experimental_interaction_to_next_paint.
- CrUX Dashboard.
- web-vitals JavaScript library.
Lab tools
- Lighthouse Panel in DevTools, available in “Timespan Mode”.
- Lighthouse npm module.
- Lighthouse User Flows.
- Web Vitals extension for Chrome.
Measure INP in Javascript
INP can also be measured using Node.js code.
Enter the following in the Terminal Window of the Node.js editor.
npm install web-vitals@next –save
We can get the INP value by running the following code.
import {onINP} from ‘web-vitals’;
onINP(({value}) => {
// Log the value to the console, or send it to your analytics provider.
console.log(value);
});
So How do I improve INP?
INP can be improved in two stages:
- Improve INP during page startup.
- Improve INP after page startup.
Improve INP during Page Startup
- Remove unused code using the coverage tool in Chrome’s DevTools.
- Find code-splitting opportunities so you can lazy load JavaScript not needed during page load. The coverage tool can help with this.
- Identify slow third-party JavaScript that you may be loading during startup.
- Use the performance profiler to find long tasks that you can optimize.
- Ensure you aren’t asking too much out of the browser rendering after your JavaScript is done—that is, large component tree re-rendering, large image decodes, too many heavy css effects, and so on.
Improve INP after Page StartUp
- Use the postTask API to appropriately prioritize tasks.
- Schedule non-essential work when the browser is idle with requestIdleCallback.
- Use the performance profiler to assess discrete interactions (for example, toggling a mobile navigation menu) and find long tasks to optimize.
- Audit third-party JavaScript in your website to see if it’s affecting page responsiveness.
The Role of INP in Mobile Optimization
Understanding the Importance of Mobile Responsiveness
The global shift toward mobile browsing has transformed the digital landscape, with over half of web traffic originating from mobile devices. For users, speed and responsiveness are paramount; they expect websites to load quickly and interactions to be seamless. Google’s Interaction to Next Paint (INP) metric provides an essential tool for evaluating and enhancing the responsiveness of web pages, particularly for mobile users. INP’s focus on measuring interaction latency aligns perfectly with the challenges and expectations of mobile web optimization.
Why INP is Crucial for Mobile Devices
Mobile Traffic Dominance
Mobile internet usage has outpaced desktop browsing, making mobile optimization a necessity for businesses and developers. Unlike desktops, mobile devices operate on varied hardware capabilities and network conditions, making them more susceptible to performance bottlenecks. INP helps identify these issues by measuring how quickly mobile devices respond to user interactions, such as tapping buttons or navigating menus.
Limited Resources on Mobile Devices
Compared to desktops, mobile devices typically have:
Lower Processing Power: Limited CPU and GPU resources make heavy scripts more taxing.
Constrained Memory: High memory usage can lead to app crashes or sluggish performance.
Variable Network Conditions: Mobile users often rely on slower and less reliable networks, such as 3G or public Wi-Fi.
Optimizing INP on mobile ensures that websites deliver responsive interactions even under these constraints.
Factors Affecting INP on Mobile Devices
JavaScript Execution
Heavy JavaScript execution can significantly impact INP on mobile. When scripts block the main thread, it delays the browser’s ability to process user inputs. This leads to increased interaction latency and a poor INP score.
Touchscreen Interactions
Mobile devices rely heavily on touchscreen gestures like taps, swipes, and pinches. Poor responsiveness to these gestures can frustrate users and cause high INP values. For example, a delayed response to a tap gesture could discourage users from continuing their interaction with the site.
Visual Feedback
Visual feedback is critical for mobile users to confirm that their interactions are registered. If a button doesn’t visually indicate a click or if scrolling feels laggy, it diminishes the user experience and raises INP metrics.
Media Content
High-resolution images, videos, or animations can overload mobile devices, causing delays in rendering and interaction feedback. Efficient media optimization is essential to maintain good INP scores.
How to Optimize INP for Mobile Devices
Reduce JavaScript Blocking Time:
Minify and compress JavaScript files to reduce load times.
Defer or asynchronously load non-critical scripts to prioritize user interaction.
Frameworks like React and Vue.js offer optimized solutions for mobile performance, but ensure you’re not overloading the page with unused components.
Load content dynamically as users scroll or interact with the page, reducing initial load times and freeing up resources for interactions.
Optimizing Touchscreen Responsiveness
Implement Gesture-Optimized Libraries:
Use libraries like Hammer.js to handle gestures efficiently and reduce latency.
Test for All Devices:
Ensure responsiveness across devices with varied screen sizes and input types by simulating touch events in development tools.
Enhancing Visual Feedback
Provide Instant Feedback:
Buttons and interactive elements should visually indicate state changes (e.g., change color or display a loading icon) immediately upon interaction.
Optimize Animations:
Use lightweight CSS animations or GPU-accelerated rendering to maintain smooth feedback without overloading resources.
Media Optimization
Compress Images:
Use modern formats like WebP for smaller file sizes and faster loading.
Optimize Videos:
Stream videos at resolutions appropriate for mobile screens to minimize buffering and rendering delays.
Tools for Measuring INP on Mobile
Lighthouse in Chrome DevTools
Lighthouse provides an excellent platform for testing mobile performance. By emulating a mobile environment, you can identify long interaction delays and areas for improvement.
Web Vitals Extension
The Web Vitals Chrome extension helps developers monitor INP and other Core Web Vitals in real time, providing insights into interaction latency.
PageSpeed Insights
Google’s PageSpeed Insights evaluates INP alongside other performance metrics, offering recommendations tailored to mobile performance.
Real-User Monitoring (RUM)
RUM tools like New Relic and Datadog capture performance data from real users, providing a realistic view of how mobile interactions perform under diverse conditions.
Future of INP in Mobile Optimization
As technology advances, web performance metrics evolve to meet the increasing demands of users for seamless experiences. Among these metrics, Interaction to Next Paint (INP) has gained significant attention for its ability to measure responsiveness, especially in scenarios where user interactions dictate the perceived performance. As mobile usage continues to dominate the digital landscape, the role of INP in mobile optimization is becoming increasingly critical. This article explores the future of INP in mobile optimization, focusing on enhanced metrics, AI-driven optimization, and integration with Progressive Web Apps (PWAs).
1. Understanding INP and Its Role in Mobile Optimization
What is INP?
Interaction to Next Paint (INP) is a user-centric metric introduced to measure the responsiveness of web applications. Unlike traditional metrics such as First Input Delay (FID), which only measures the time from user interaction to the browser’s acknowledgment, INP considers the entire process—from interaction to the next visual update on the screen. This comprehensive approach makes it particularly relevant for mobile optimization, where responsiveness significantly impacts user satisfaction.
The Importance of Mobile Optimization
Mobile devices account for a significant portion of global web traffic. The diverse range of devices, varying network speeds, and unique interaction patterns make mobile optimization challenging yet indispensable. INP’s focus on user interaction aligns perfectly with the need for creating fast, responsive, and smooth mobile experiences.
2. Enhanced Metrics: Expanding the Scope of INP
As INP matures, it is poised to integrate more nuanced metrics tailored to the complexities of mobile interactions. These enhancements aim to address the specific needs of mobile users.
a. Multi-Touch Gestures
Mobile interactions often go beyond single taps or clicks. Users rely on multi-touch gestures such as pinching, zooming, and swiping, which require smooth and responsive feedback. Future iterations of INP may include metrics that specifically measure the latency and fluidity of multi-touch gestures, ensuring that these interactions feel natural and intuitive.
b. Device Orientation Changes
Mobile devices offer unique interaction possibilities through orientation changes, such as switching between portrait and landscape modes. These transitions should occur seamlessly without interrupting the user experience. Enhanced INP metrics could measure the performance impact of orientation changes, encouraging developers to optimize for such scenarios.
c. Environmental Context Awareness
With mobile devices increasingly integrating sensors like gyroscopes, accelerometers, and GPS, applications can adapt dynamically to the user’s environment. Future INP metrics might evaluate how effectively apps leverage these contextual data points while maintaining responsiveness, offering a more immersive experience.
3. AI-Driven Optimization: Transforming INP Analysis
Artificial intelligence (AI) has the potential to revolutionize how INP data is analyzed and leveraged for mobile optimization. By harnessing AI’s computational power, developers can gain deeper insights and implement targeted improvements.
a. Large-Scale INP Data Analysis
AI algorithms can process vast amounts of INP data across various devices, network conditions, and user demographics. This analysis can reveal patterns and identify bottlenecks in responsiveness that might be overlooked through manual inspection.
For example, AI could detect that certain device models consistently exhibit higher INP values for specific interactions. Developers could then prioritize optimizing their applications for these devices, ensuring a better experience for a broader audience.
b. Tailored Recommendations
AI-driven tools could offer personalized recommendations for optimizing INP, catering to the unique characteristics of a website or application. For instance, an e-commerce platform with complex user flows might receive suggestions to streamline checkout interactions, while a media-rich application might focus on optimizing content loading.
c. Predictive Modeling
AI can predict how changes in code or infrastructure might impact INP. By simulating different scenarios, developers can evaluate the trade-offs of various optimization strategies before implementing them, saving time and resources.
d. Real-Time INP Optimization
In the future, AI could enable real-time optimization of INP by dynamically adjusting application behavior based on user interactions. For instance, AI might prioritize rendering visible content over background tasks during moments of high user engagement, ensuring a consistently responsive experience.
4. Integration with Progressive Web Apps (PWAs)
Progressive Web Apps (PWAs) represent the intersection of web and mobile, offering native app-like experiences through web technologies. As PWAs continue to gain traction, optimizing their INP will be essential for their widespread adoption.
a. The Role of PWAs in Mobile Optimization
PWAs are inherently designed to be mobile-friendly, combining the best of web and native apps. They are lightweight, fast, and accessible across devices, making them ideal for mobile users. However, the success of a PWA depends heavily on its responsiveness, as users expect instant feedback when interacting with app-like interfaces.
b. Enhancing INP for PWAs
Future advancements in INP could focus on specific PWA features, such as offline capabilities and service worker performance. For example:
Offline Interactions: INP metrics might evaluate how smoothly PWAs handle user interactions while offline, ensuring a seamless experience even without an active internet connection.
Background Syncs: Metrics could assess the responsiveness of PWAs during background sync operations, helping developers balance performance with functionality.
c. Driving PWA Adoption
By prioritizing INP optimization, PWAs can offer superior user experiences, encouraging more businesses and developers to adopt this technology. Improved INP metrics could also serve as benchmarks for evaluating the performance of PWAs, further driving innovation in this space.
5. The Broader Impact of INP on Mobile Optimization
a. Elevating User Experience
A well-optimized INP ensures that users experience minimal delays between their actions and the corresponding visual feedback. This responsiveness is crucial for maintaining user engagement and reducing bounce rates, especially on mobile devices where patience is limited.
b. Empowering Developers
INP provides developers with actionable insights into the performance of their applications. By focusing on user interactions, it encourages a shift from purely technical optimization to user-centric design, resulting in more intuitive and enjoyable experiences.
c. Aligning with Core Web Vitals
As part of Google’s Core Web Vitals initiative, INP is likely to play a central role in future updates. Its integration with other metrics like Largest Contentful Paint (LCP) and Cumulative Layout Shift (CLS) ensures a holistic approach to web performance, aligning technical benchmarks with real-world user experiences.
6. Challenges and Considerations
While the future of INP in mobile optimization is promising, several challenges must be addressed to unlock its full potential.
a. Standardization
For INP to be widely adopted, it must be standardized across devices and browsers. This requires collaboration among industry stakeholders to ensure consistent measurement and interpretation of the metric.
b. Complexity of Mobile Ecosystems
The diversity of mobile devices, operating systems, and network conditions adds complexity to INP optimization. Developers must account for these variables while striving to deliver consistent performance.
c. Balancing Performance and Features
Optimizing INP often involves trade-offs between performance and features. Developers must strike a balance to ensure that applications remain responsive without compromising functionality or design.
7. Looking Ahead: Innovations in INP and Mobile Optimization
As web technologies evolve, INP is expected to undergo continuous refinement, incorporating new metrics and methodologies to address emerging challenges. Some potential innovations include:
a. Cross-Platform Optimization
Future INP metrics could extend beyond web applications to include native and hybrid apps, providing a unified framework for evaluating responsiveness across platforms.
b. User-Centric Benchmarks
INP could integrate subjective user feedback to complement quantitative measurements, offering a more holistic view of responsiveness and user satisfaction.
c. Edge Computing Integration
By leveraging edge computing, applications could process user interactions closer to the device, reducing latency and improving INP performance. This approach is particularly relevant for mobile devices, where network speed can be a limiting factor.
d. Gamification of Performance Metrics
To encourage widespread adoption, INP optimization could be gamified, with tools that reward developers for achieving specific benchmarks or milestones in responsiveness.
