SUPERCHARGE YOUR ONLINE VISIBILITY! CONTACT US AND LET’S ACHIEVE EXCELLENCE TOGETHER!
The purpose of using Mean Shift Clustering for a website is to analyze and group similar user behaviors, web pages, or traffic patterns to better understand how visitors interact with the website. By applying this clustering technique, you can automatically identify clusters or groups of similar data points (such as web pages, keywords, or user sessions) based on their characteristics without predefining the number of groups. This helps in uncovering patterns and insights that might not be obvious at first glance.

What is Mean Shift Clustering?
- Mean Shift Clustering is a method used to group data into clusters based on how densely packed they are. Imagine you have several points on a map, and you want to find where most of them are crowded together. The algorithm moves these points (“shifts” them) toward the areas where points are most densely packed, eventually creating clusters (groups) around these high-density regions.
Here’s how it generally helps in the context of a website:
- Grouping Similar Pages or Keywords: Mean Shift Clustering can group web pages or keywords based on similar performance metrics like traffic, engagement rates, or average session duration. This helps identify which pages or keywords are performing similarly, making it easier to understand what content is resonating with users or where improvements are needed.
- Understanding User Behavior: By clustering user behavior data, you can see how different groups of visitors interact with the site. For example, it can show you clusters of users who spend similar amounts of time on the site, have similar engagement patterns, or follow similar paths through the website. This can help in tailoring content or improving user experience for different user segments.
- Identifying High and Low Performing Areas: The clustering will automatically highlight which pages or sections of the website are high performers and which are underperforming. High-density clusters might indicate pages that receive a lot of traffic and have high engagement, while low-density clusters could highlight areas of the website that need attention.
- Improving Website Optimization: By understanding these clusters, you can make data-driven decisions on how to optimize the website. For example, if certain clusters reveal keywords that bring high traffic but have low engagement, it might suggest that the content needs to be improved to better match user intent. Similarly, clusters with high engagement but low traffic could indicate opportunities for better promotion or SEO optimization.
- Personalizing Content and Marketing: The insights from clustering can be used to personalize content or marketing efforts based on the specific behaviors and interests of different user groups. This helps in delivering a more targeted and effective experience for website visitors.
1. Collecting the Data for Mean Shift Clustering
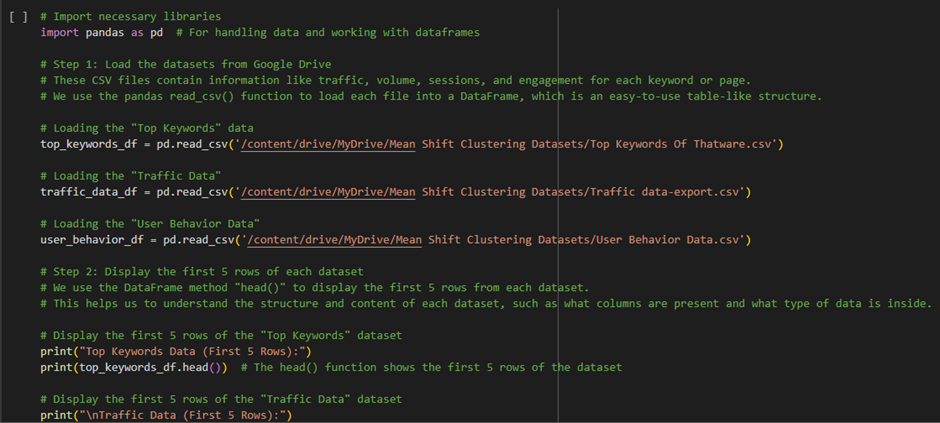
To build a model, you need data that the Mean Shift Clustering algorithm can analyze. Let’s look at three kinds of data you might collect:
- Keyword Frequency Data: This refers to how many times specific keywords (words or phrases people search for on Google) are searched. For example, if the keyword “SEO services” is searched 1,000 times per month, that’s its frequency.
- How to collect: You can use tools like Google Keyword Planner, Ahrefs, SEMrush, or Ubersuggest. These tools allow you to input a keyword and see how often people search for it, along with related terms.
- Number of Visits to Specific Pages: This refers to how many times users visit specific pages on the website.
- How to collect: You can use Google Analytics or Ahrefs. Google Analytics will give you data on the traffic (visits) for each page of the website. Ahrefs will give you similar data but also provides insights into how users are finding the pages.
- User Engagement Metrics: These include data like click-through rates (CTR), bounce rates (how many people leave the website quickly without interacting), and time spent on a page.
- How to collect: Google Analytics is the best tool to gather engagement data. You’ll get metrics like how long users stay on pages, what they click on, and whether they leave quickly.
2. Understanding the Numerical Data (Keywords, Visits, and User Behavior)
Once you have gathered the data, the Mean Shift Clustering algorithm will work with numerical data. Here’s how:
- Keyword Popularity: This is simply how many times a keyword is searched. The higher the number, the more popular the keyword.
- Click Rates/Visits: The number of clicks or visits a specific webpage gets. A page with more visits will have a higher numerical value.
- Bounce Rate: This is usually given as a percentage (e.g., 40% of users leave quickly), but you can convert it into a number for clustering.
3. How Does Mean Shift Clustering Work?
Now that you understand the data, let’s talk about how the algorithm works to “shift” the data points and form clusters:
- Step 1: The algorithm starts by taking your data points (keyword frequency, clicks, or bounce rates) and looks at how they are spread out. Imagine all your data points as dots on a chart.
- Step 2: The algorithm then starts shifting these data points toward the areas where more points are packed together, which represents higher density (more popular keywords or web pages).
- Step 3: This process repeats until the algorithm finds the center of the high-density areas. Once these “clusters” are identified, you’ll have groups of similar keywords or web pages. For example, one cluster might be high-traffic SEO-related keywords, while another might be low-traffic but highly engaged keywords.
- Step 4: The clusters can now tell you which keywords, pages, or behaviors are most common, helping you understand which areas to focus on.
4. Data to Collect from the Website
- Keyword Data: Use a tool like Ahrefs or SEMrush to pull keyword data related to SEO services. This will give you the search frequency for keywords that the site is targeting.
- Page Traffic Data: Use Google Analytics to gather traffic numbers for the most important pages on the site (like the homepage, service pages, and blog posts). This will show you how many visitors these pages get.
- Engagement Data: Again, from Google Analytics, collect data on bounce rates, time spent on pages, and click-through rates (how often people click on links within the site).
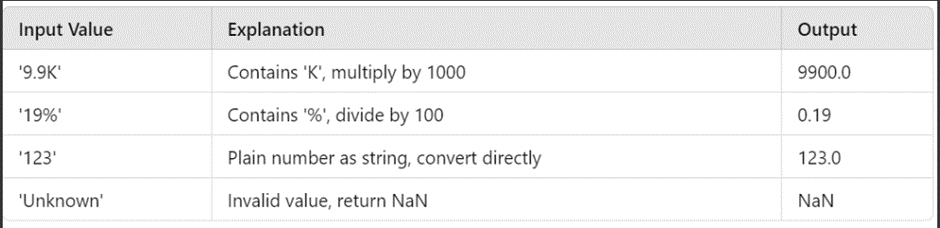
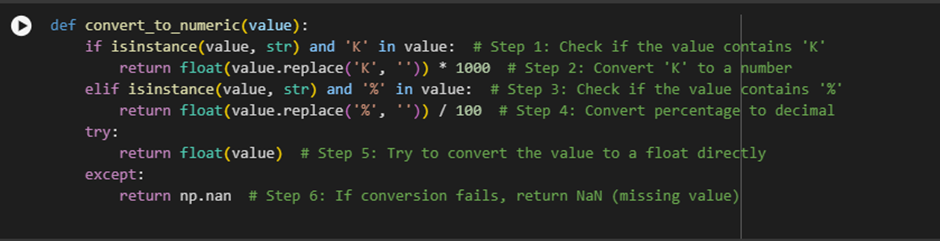
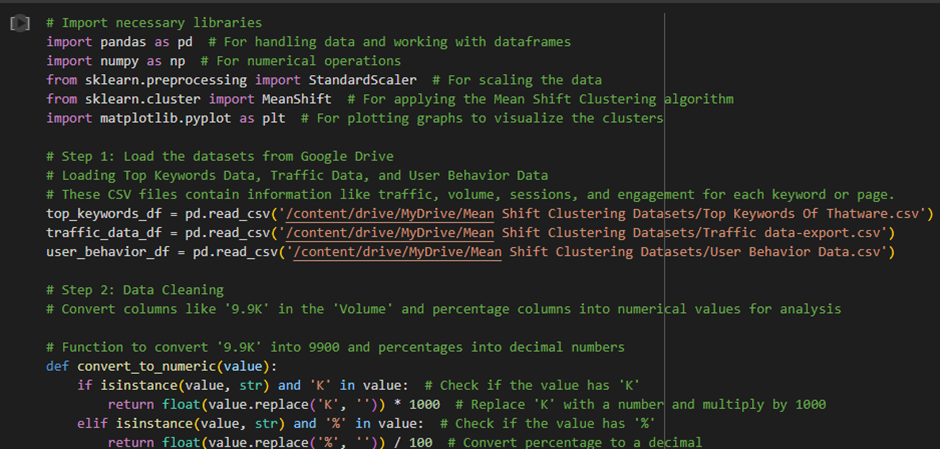
The Purpose of This Function:
The purpose of this function is to clean and convert non-numeric data (such as strings like ‘9.9K’ or ‘19%’) into numeric values so they can be used in calculations and analysis.
For example:
· ‘9.9K’ should be converted to 9900.
· ‘19%’ should be converted to 0.19.
Step-by-Step Explanation:
Step 1: Check if the value contains ‘K’

What this does: This line checks if the value is a string and if the string contains the letter ‘K’. The ‘K’ is often used to represent thousands in numbers, like 9.9K means 9900.
Example:
· If the value is ‘9.9K’, it meets this condition because:
o It’s a string (isinstance(value, str) is True).
o It contains ‘K’ (‘K’ in value is True).
This step tells the program that it has found a value like ‘9.9K’ that needs conversion.
Step 2: Convert ‘K’ to a Number

What this does: Once the function finds a ‘K’ in the value, it removes the ‘K’ (value.replace(‘K’, ”)) and converts the remaining part of the string to a float. Then it multiplies the number by 1000 to convert the thousands into a full number.
Example:
For the value ‘9.9K’:
· ‘9.9K’ becomes ‘9.9’ after removing the ‘K’.
· ‘9.9’ is converted to the float number 9.9.
· 9.9 is then multiplied by 1000, resulting in 9900.
Step 3: Check if the value contains ‘%’

What this does: If the value is not a ‘K’ value, this step checks if the value is a percentage (contains the symbol ‘%’).
Example:
- If the value is ‘19%’, it meets this condition because:
- It’s a string (isinstance(value, str) is True).
- It contains ‘%’ (‘%’ in value is True).
Step 4: Convert Percentage to Decimal

What this does: If the value contains a percentage symbol (‘%’), the function removes the ‘%’ symbol and divides the number by 100 to convert it to a decimal format.
Example:
For the value ‘19%’:
- ‘19%’ becomes ’19’ after removing the ‘%’.
- ’19’ is converted to the float number 19.0.
- 19.0 is then divided by 100, resulting in 0.19.
Step 5: Try to Convert the Value to a Float Directly

What this does: If the value does not contain ‘K’ or ‘%’, the function tries to convert the value directly to a float. This is useful for numbers that are already in numeric form but stored as strings (like ‘123’).
Example:
- If the value is ‘123’, this step simply converts the string ‘123’ into the float number 123.0.
Full Example of the Function in Action:
Step-by-Step Explanation:
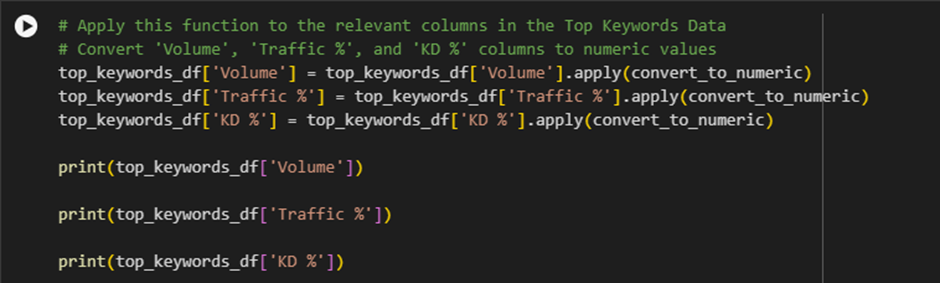
Step 1: Apply the convert_to_numeric Function to the ‘Volume’ Column

What this does: This line applies the convert_to_numeric function to the ‘Volume’ column in the top_keywords_df DataFrame.
How it works: The apply() function goes through each value in the ‘Volume’ column and applies the convert_to_numeric function to it. Any values like ‘9.9K’ will be converted to 9900, while values like ‘123’ remain as 123. If the function encounters an invalid value (like ‘N/A’), it will replace it with NaN (Not a Number).
Example:
If the column ‘Volume’ contains values like [‘9.9K’, ’15K’, ‘120’, ‘N/A’]:
- ‘9.9K’ becomes 9900.0.
- ’15K’ becomes 15000.0.
- ‘120’ remains 120.0.
- ‘N/A’ becomes NaN.
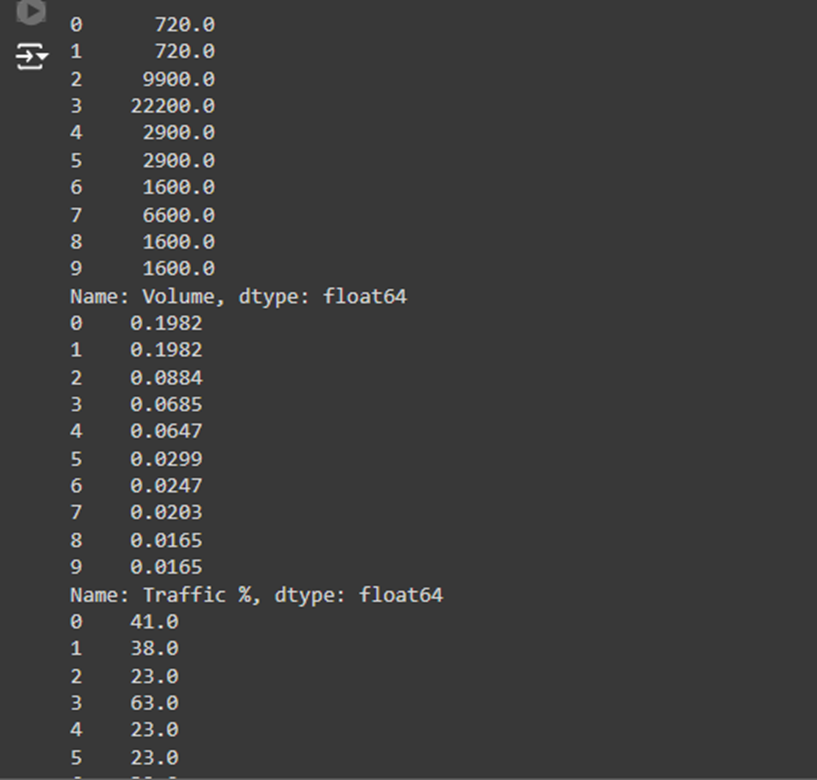
Result: After this step, the ‘Volume’ column will only contain numeric values that represent the volume of searches, making it suitable for analysis.
Step 2: Apply the convert_to_numeric Function to the ‘Traffic %’ Column

What this does: This line applies the convert_to_numeric function to the ‘Traffic %’ column.
How it works: Just like in Step 1, the apply() function goes through each value in the ‘Traffic %’ column and converts any percentage values (like ‘19%’) into decimal values. For instance, ‘19%’ becomes 0.19.
Example:
If the column ‘Traffic %’ contains values like [‘19%’, ‘45%’, ‘N/A’, ‘35.5%’]:
- ‘19%’ becomes 0.19.
- ‘45%’ becomes 0.45.
- ‘N/A’ becomes NaN.
Result: The ‘Traffic %’ column will now contain decimal values, representing the percentage of traffic in a numeric format.
Step 3: Apply the convert_to_numeric Function to the ‘KD %’ Column

What this does: This line applies the convert_to_numeric function to the ‘KD %’ column. KD % (Keyword Difficulty percentage) might also be in percentage format (e.g., ‘41%’), so it needs to be converted into a decimal for analysis.
How it works: Similar to the previous steps, the apply() function processes each value in the ‘KD %’ column. If it’s a percentage like ‘41%’, it will be converted to 0.41.
Example:
If the column ‘KD %’ contains values like [‘41%’, ‘20%’, ‘N/A’, ‘75%’]:
- ‘41%’ becomes 0.41.
- ‘20%’ becomes 0.20.
- ‘N/A’ becomes NaN.
- ‘75%’ becomes 0.75.
Result: The ‘KD %’ column will now have numeric values in decimal format, ready for analysis.
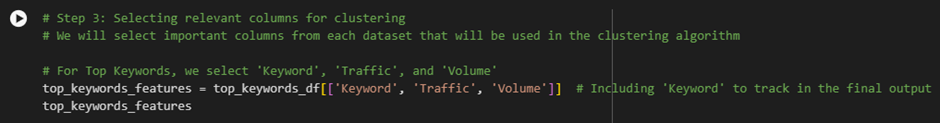
Step 3: Deciding Which Columns to Select
The process of selecting relevant columns for clustering is crucial because clustering relies on the features (columns) we choose. The quality of the clustering results depends on selecting the right metrics that can best represent the patterns we are trying to find.
How Do We Decide Which Columns to Select?
The key idea here is to select columns that contain important information that can help us group similar items (keywords or pages) based on their performance and behavior. Here’s how we decide which columns are relevant:
1. Relevance to the Business Problem:
· We focus on columns that are directly related to website performance and user engagement. This is because the clustering will group keywords or pages based on how similar their metrics are.
· The metrics we choose should help us answer questions like:
o Which keywords are performing well in terms of traffic?
o Which pages are engaging users the most?
o How are users interacting with different parts of the site?
2. Columns that Contain Useful Metrics:
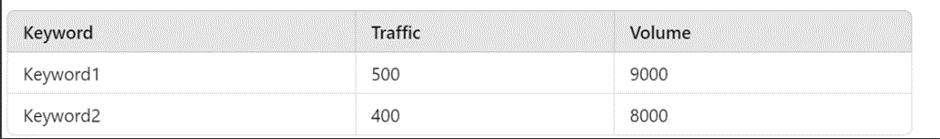
· Top Keywords Data:
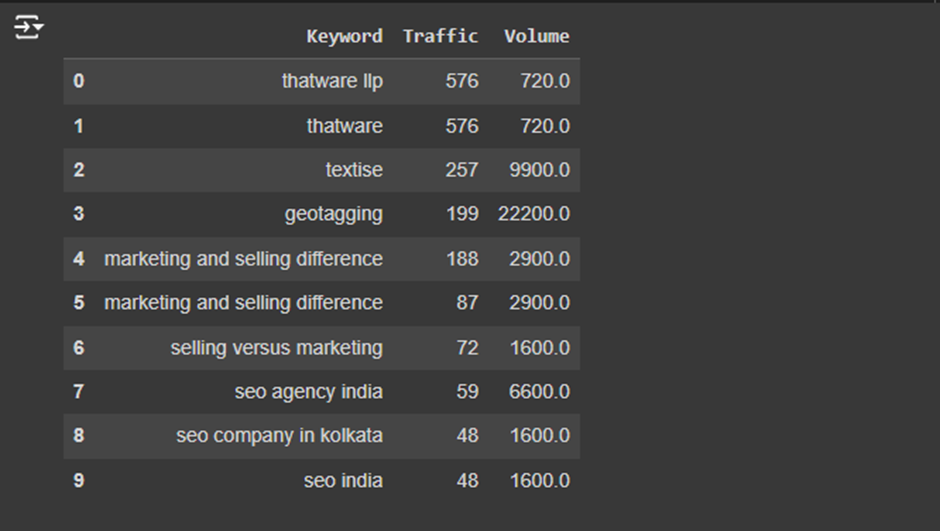
o We choose Traffic because it tells us how many people are visiting a page or searching for a keyword.
o Volume is selected because it shows how popular the keyword is in terms of searches.
o We also include Keyword to help us identify which keywords are being grouped into clusters.
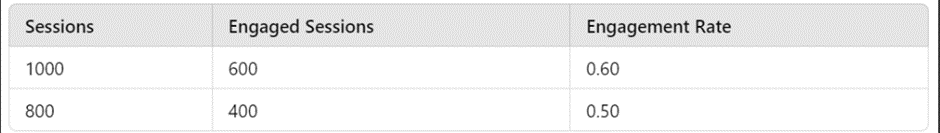
Columns that Contain Useful Metrics:
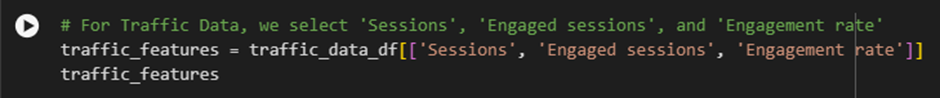
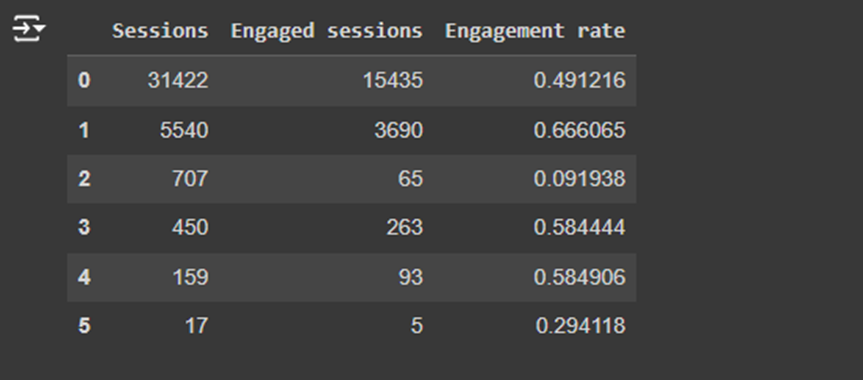
Traffic Data:
· We select Sessions because it shows the total number of visits to a page, which is a key metric for performance.
· Engaged Sessions is important because it tells us how many of those visits involve active interaction with the page (e.g., clicks, scrolling, etc.).
· Engagement Rate is selected because it shows the percentage of sessions that are actively engaged. This helps measure how well the content is holding visitors’ attention.
Columns that Contain Useful Metrics:
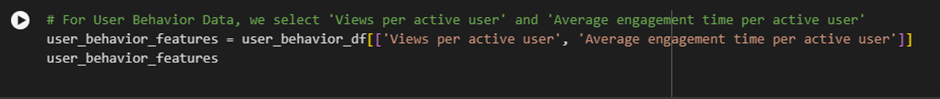
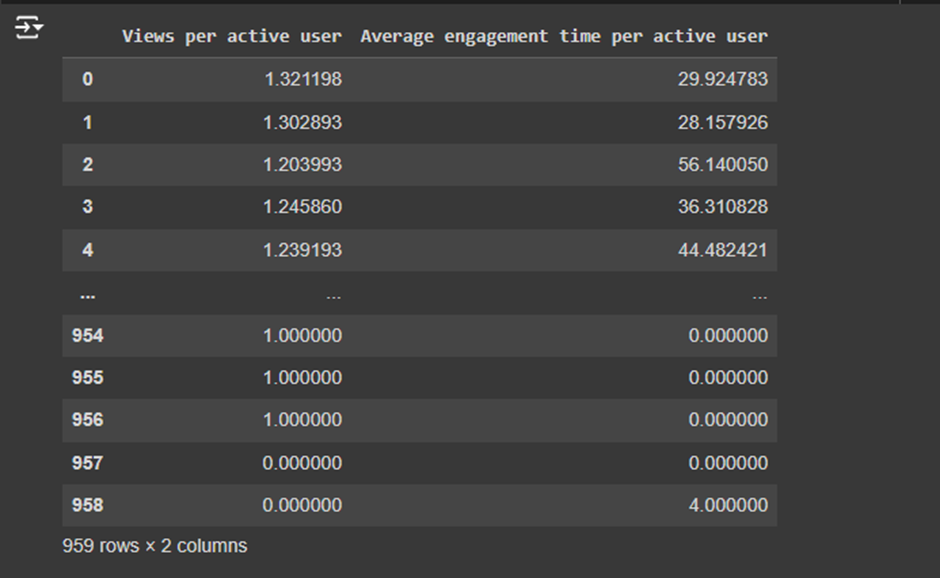
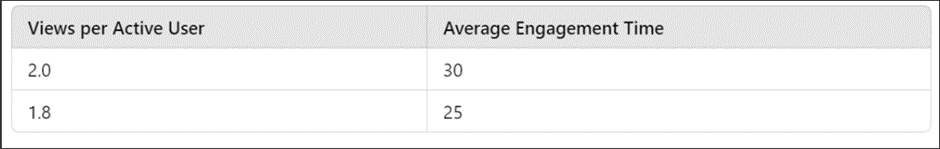
User Behavior Data:
· Views per Active User shows how many views a typical engaged user generates, helping us measure user interaction depth.
· Average Engagement Time tells us how long users are spending on the page, which is a key metric for engagement.
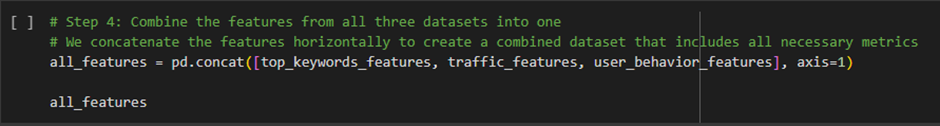
Explanation of Step 4: Combining the Features
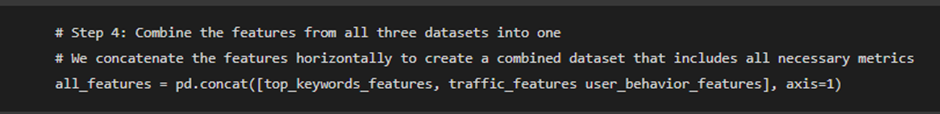
What This Step Does:
- In Step 4, the goal is to combine the important columns (features) from all three datasets—Top Keywords, Traffic Data, and User Behavior Data—into a single dataset that we will use for clustering.
Why We Do This: For the clustering algorithm (Mean Shift Clustering) to work, all the relevant data must be in one table. This allows the algorithm to look at all the features (such as traffic, sessions, engagement, etc.) and identify patterns or similarities between them.
Key Parts of Step 4:
pd.concat():
- We use the concat() function from the pandas library to concatenate (combine) multiple datasets.
- The axis=1 argument means we are combining the datasets horizontally, meaning that each dataset will contribute its columns to the new combined dataset.
Combining the Features:
- We are combining three sets of features (one from each dataset):
- Top Keywords Features (Keyword, Traffic, Volume)
- Traffic Data Features (Sessions, Engaged Sessions, Engagement Rate)
- User Behavior Features (Views per Active User, Average Engagement Time)
Example:
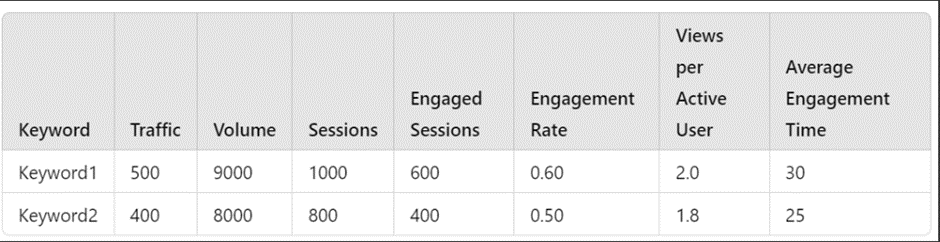
Imagine you have three separate tables:
After concatenating horizontally (with axis=1), it will look like this:
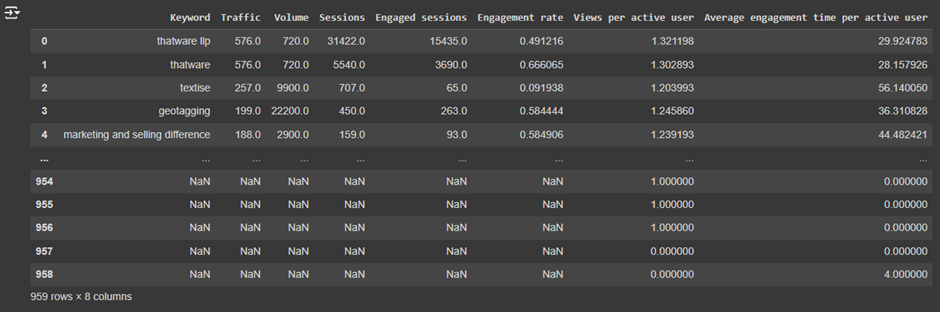
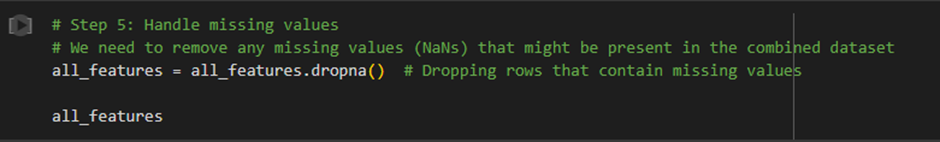
Step 5: Handling Missing Values
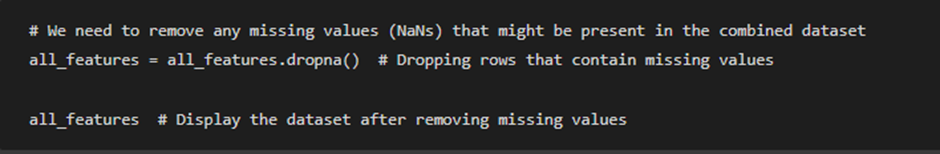
Purpose of This Step:
The purpose of this step is to handle missing values (NaNs) in the combined dataset called all_features. Missing values can cause issues during analysis or clustering because many machine learning algorithms (like Mean Shift Clustering) cannot process them. Therefore, we need to clean the dataset by either removing or handling rows that contain missing values (NaNs).
Explanation of the Code:
1. Missing Values (NaNs) in Data:
What are NaNs?
- NaN stands for “Not a Number.” It represents missing or undefined data in a dataset. For example, if a particular row doesn’t have a value for one of the columns, it might be recorded as NaN.
Why do NaNs occur?:
- Incomplete data entry (e.g., missing user behavior information for some pages).
- Data cleaning errors (e.g., failed conversions of non-numeric data).
- Merging multiple datasets, where certain columns have no corresponding values in the other datasets.
Example: Suppose you have the following data:
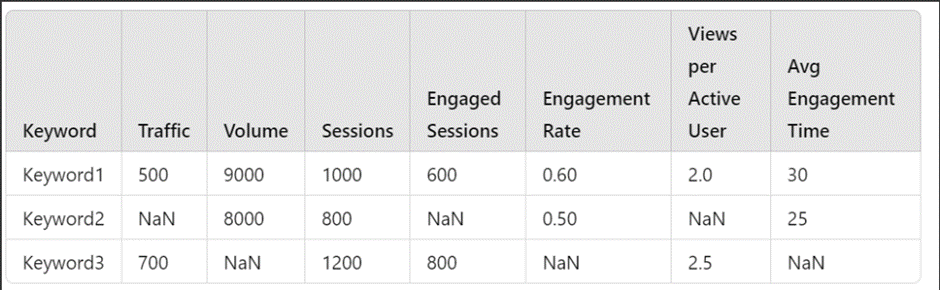
In this dataset:
- Keyword2 is missing values for Traffic, Engaged Sessions, and Views per Active User (NaN values).
- Keyword3 is missing values for Volume, Engagement Rate, and Avg Engagement Time (NaN values).
2. Handling Missing Values:
dropna():
- The dropna() function removes entire rows that contain any missing values (NaNs) from the DataFrame.
- This means that if even one column in a row has a missing value, the entire row will be removed from the dataset.
How it works:
- When the dropna() function is called, it scans each row of the DataFrame (in this case, all_features) to see if any of the columns in that row contain a NaN.
- If a row contains even one NaN, the entire row is dropped (deleted) from the dataset.
Example:
In the sample dataset above:
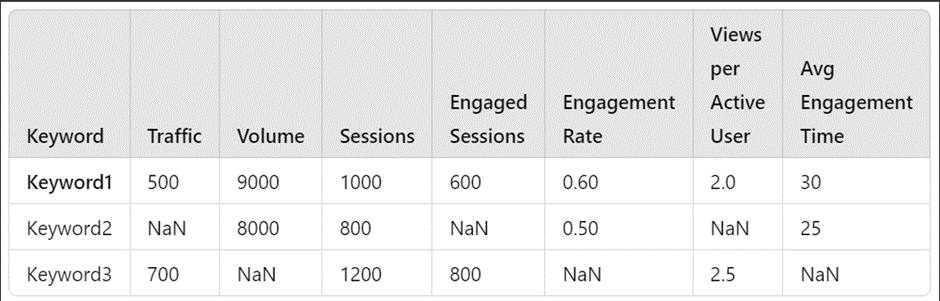
After applying dropna(), the resulting dataset will only include Keyword1, because the rows for Keyword2 and Keyword3 contain missing values (NaNs):
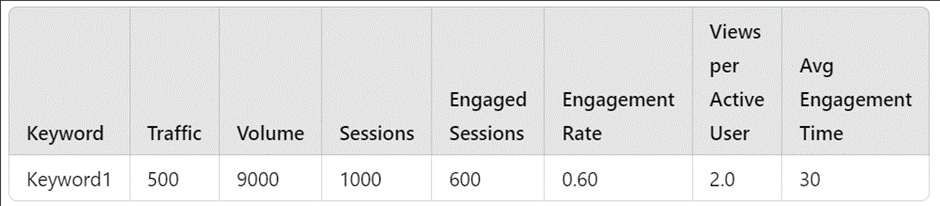
- Keyword2 and Keyword3 are dropped because they have missing values in some columns.
3. Why This Is Important:
Clustering Algorithms Cannot Handle NaNs:
- Many algorithms, including clustering algorithms like Mean Shift Clustering, require complete data to function correctly. If there are missing values, the algorithm will either produce errors or incorrect results.
Clean Data for Accurate Analysis:
- Dropping rows with missing values ensures that the dataset is clean and that we can perform accurate analysis and clustering.
Trade-off:
- While dropping rows with missing values ensures clean data, it might result in losing valuable data points. If too many rows are removed, the dataset might become too small or incomplete. In such cases, instead of dropping rows, we can consider filling the missing values (using techniques like mean or median imputation), but that depends on the situation.
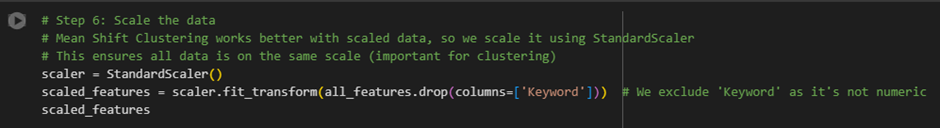
Step 6: Scaling the Data
Explanation of Each Step:
1. Why Do We Need to Scale the Data?
- Importance of Scaling: Clustering algorithms like Mean Shift are sensitive to the range of values in the dataset. If some features have much larger values than others, the clustering algorithm might be biased towards those features with larger ranges.
Example: Imagine you have two columns:
- Traffic ranges from 100 to 10,000.
- Engagement Rate ranges from 0 to 1 (percentage).
If you don’t scale the data, the clustering algorithm might consider Traffic more important than Engagement Rate because the numbers are much larger, even though both features are equally important. Scaling ensures that all features are treated equally.
- How Scaling Helps: Scaling standardizes the data so that all features have the same range, usually with a mean of 0 and a standard deviation of 1. This ensures that no feature dominates the others simply because of its scale.
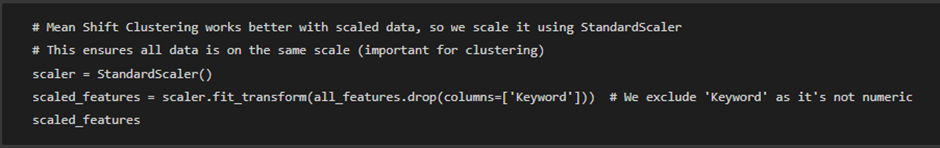
2. StandardScaler() to Scale the Data

What This Does: This line initializes the StandardScaler from the sklearn.preprocessing library.
What StandardScaler Does:
- StandardScaler transforms the data so that each feature (or column) has a mean of 0 and a standard deviation of 1.
It subtracts the mean from each feature and divides by the standard deviation, ensuring that all features are on the same scale.
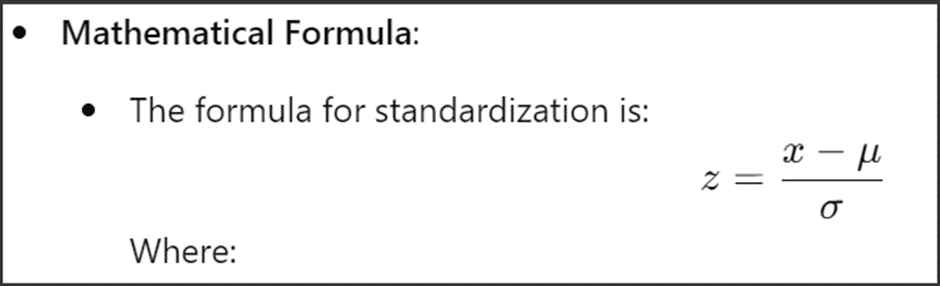
Where:
- x is the original value.
- μ is the mean of the feature.
- σ is the standard deviation of the feature.
- z is the standardized value.
Example:
- Imagine a Traffic column with values: [500, 9000, 12000].
- The mean μ of this column is 10500, and the standard deviation σ is 3500.
- The first value 500 would be standardized as
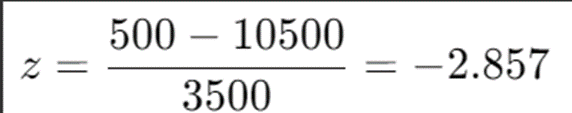
·
- So, 500 would be transformed to -2.857, and similar transformations would apply to other values in the column.
3. Drop the Non-Numeric ‘Keyword’ Column

What This Does: This line applies the StandardScaler to the numeric data, excluding the Keyword column.
Why We Drop ‘Keyword’:
- The ‘Keyword’ column contains text data (strings), which cannot be scaled or used directly in clustering. Clustering algorithms require numeric data to calculate distances between points, and keywords are not numeric.
Example: If we have a row like:
· Keyword: “SEO Services”, Traffic: 500, Volume: 9000, etc.
· We drop the Keyword column so that only the numeric values (like Traffic and Volume) are scaled.
How It Works:
· We use all_features.drop(columns=[‘Keyword’]) to create a new DataFrame that excludes the Keyword column. This new DataFrame contains only numeric values (like Traffic, Volume, Sessions, etc.).
· Then, we apply scaler.fit_transform() to scale all the numeric columns in the DataFrame. fit_transform() first calculates the mean and standard deviation for each column and then scales the data accordingly.
4. fit_transform() to Scale the Features

- ** What This Does:** The fit_transform() function does two things:
- Fit: It calculates the mean and standard deviation for each numeric column in the dataset.
- Transform: It uses these calculated values to scale each value in the dataset.
- How It Works:
- Fitting: The scaler looks at each column (like Traffic, Volume, etc.) and calculates the mean and standard deviation.
- Transforming: The scaler then uses these values to standardize the data, ensuring all columns have a mean of 0 and a standard deviation of 1.
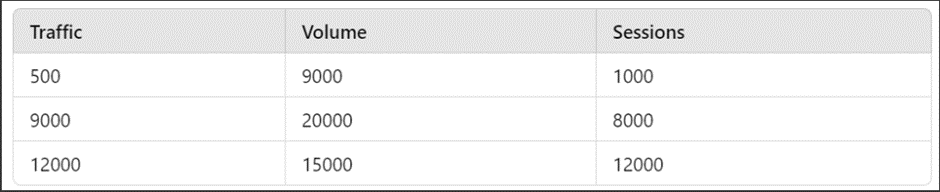
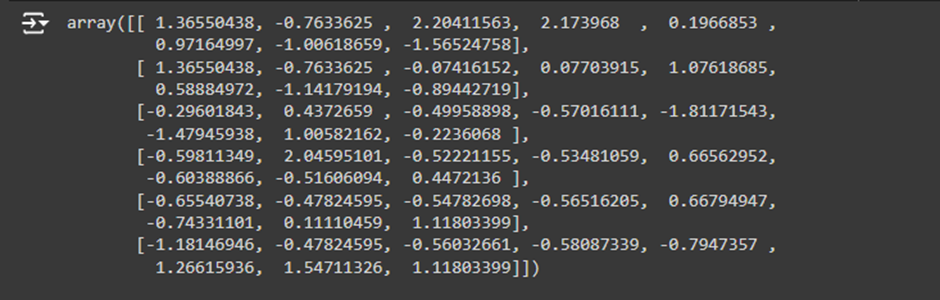
Example: Suppose you have this dataset before scaling:
After applying fit_transform() using StandardScaler, the dataset will be transformed to:
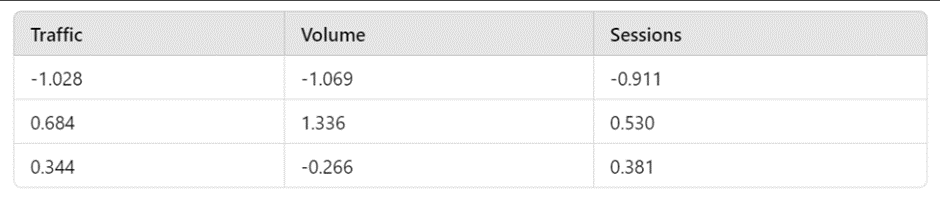
Now, all columns have values on the same scale, making them ready for clustering.
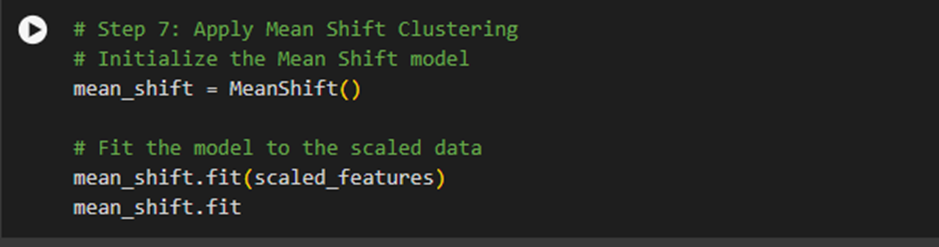
1. Initialize the Mean Shift Model

What This Does: This line initializes the Mean Shift clustering model from the sklearn.cluster library. We are creating an instance of the MeanShift class, which will later be used to find clusters in the data.
What is Mean Shift Clustering?
- Mean Shift Clustering is a type of density-based clustering algorithm. It finds areas in the data that are more densely populated with points and identifies them as clusters.
- Unlike other clustering methods (like K-Means), Mean Shift does not require you to specify the number of clusters in advance. It automatically finds the clusters based on the density of points.
How It Works:
- Mean Shift works by moving data points towards areas of higher density (where there are more data points) iteratively, until it converges (stops moving). Each dense region is considered a cluster.
- It’s called “Mean Shift” because the algorithm computes the mean of data points in a region and shifts the points toward the mean.
- Example: Imagine you have a dataset of user interactions on a website, and you don’t know how many groups of similar behavior exist. Mean Shift will automatically find clusters based on user interaction patterns without requiring you to specify the number of clusters beforehand.
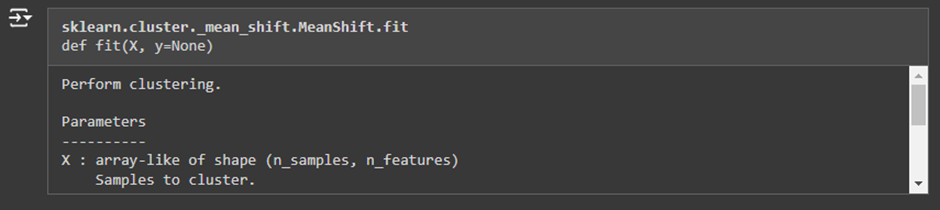
2. Fit the Model to the Scaled Data

What This Does: This line applies the Mean Shift algorithm to the scaled features by using the fit() method.
- fit() is the method that trains the Mean Shift model on the data. It looks at the scaled features (such as traffic, engagement rate, sessions, etc.) and identifies clusters based on the density of the data points.
How fit() Works:
- The fit() function takes the scaled data as input (in this case, the scaled_features dataset) and calculates clusters by shifting data points toward regions of higher density.
- The algorithm repeats this process until the data points stop moving and the clusters are stable.
Example:
- Suppose you have scaled data about website traffic and user engagement. The fit() method will take this data and calculate clusters. Each cluster will represent a group of pages or keywords that have similar traffic and engagement patterns.
- If your data contains keywords with different traffic and engagement rates, Mean Shift might find clusters where certain keywords have high traffic but low engagement, while others have low traffic but high engagement. Each cluster represents a different behavioral pattern.
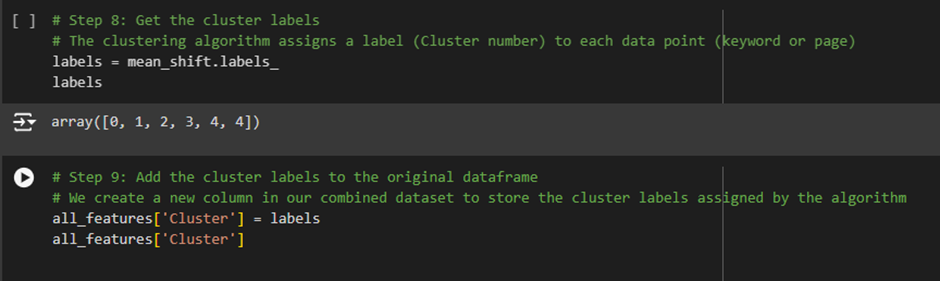
Mean_shift.labels_
–
What This Does: This line retrieves the cluster labels from the** Mean Shift model.** After the clustering algorithm runs, it stores the labels in the labels_ attribute of the model. By assigning mean_shift.labels_ to the variable labels, we can access these labels.
How It Works:
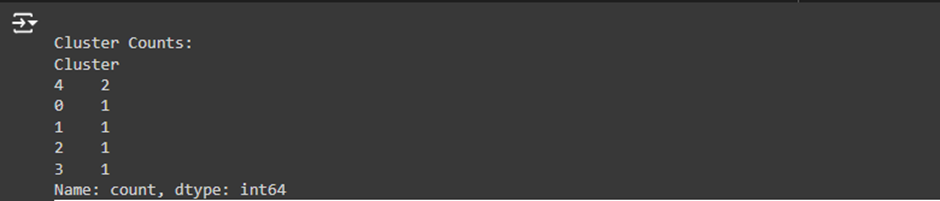
- The labels_ attribute contains the cluster number (label) for each data point. For example, if the algorithm found 3 clusters, the labels_ array might look like this: [0, 1, 1, 2, 0, 2, 1]. Each number corresponds to the cluster to which that particular data point belongs.
Example:
Let’s say you have 7 data points (e.g., keywords or pages), and the clustering algorithm assigns the following labels:

This means:
- Keyword 1 belongs to Cluster 0.
- Keyword 2 belongs to Cluster 1.
- Keyword 3 belongs to Cluster 1.
- Keyword 4 belongs to Cluster 2.
- Keyword 5 belongs to Cluster 0.
- Keyword 6 belongs to Cluster 2.
- Keyword 7 belongs to Cluster 1.
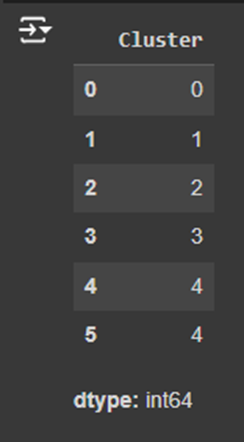
3. Storing the Labels in a Variable

What This Does: This line assigns the cluster labels to the variable labels. The labels variable will contain the cluster label (0, 1, 2, etc.) for each keyword or page in the dataset.
How This Helps:
- Now that we have the cluster labels stored in labels, we can use this information to understand which group each keyword or page belongs to.
- These labels will allow us to analyze the results of the clustering. For example, we can group the keywords by their clusters to see which keywords have similar traffic, engagement, or user behavior patterns.
Example of How Labels Work:
Let’s say you have the following keywords with their traffic and engagement data, and you apply Mean Shift Clustering to this data.
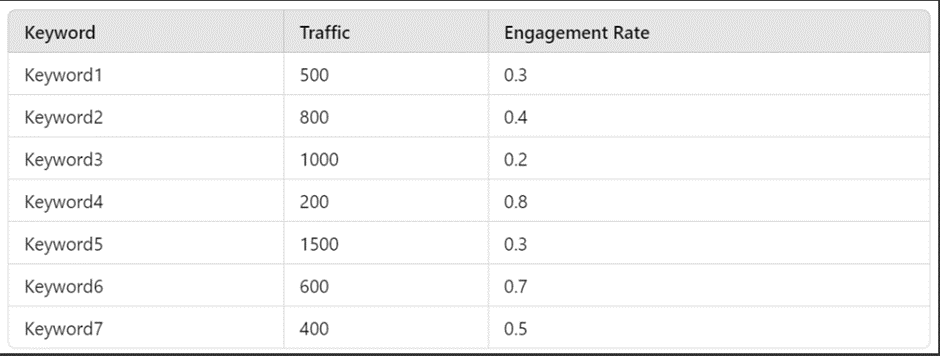
After running the clustering algorithm, the algorithm might assign these cluster labels:

This means:
- Keyword1 and Keyword5 are in Cluster 0.
- Keyword2, Keyword3, and Keyword7 are in Cluster 1.
- Keyword4 and Keyword6 are in Cluster 2.
How to Use the Cluster Labels:
- Once we have the labels, we can group the data based on the cluster labels and analyze each cluster separately.
- Cluster 0 might represent keywords with high traffic but low engagement, while Cluster 1 might represent keywords with moderate traffic and moderate engagement, and Cluster 2 might represent keywords with low traffic but high engagement.
- These insights can help you decide which keywords need more attention, which are performing well, and which could be improved.
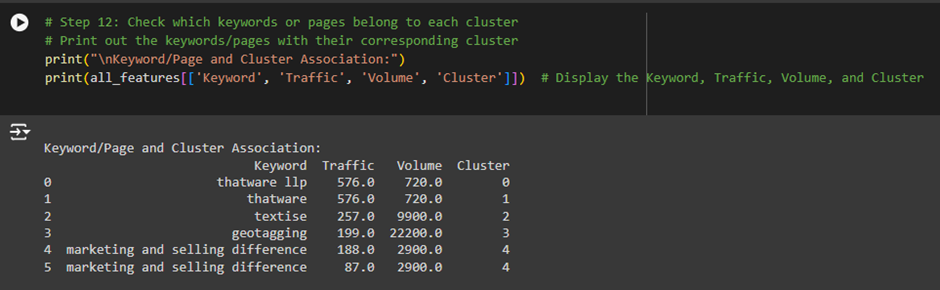
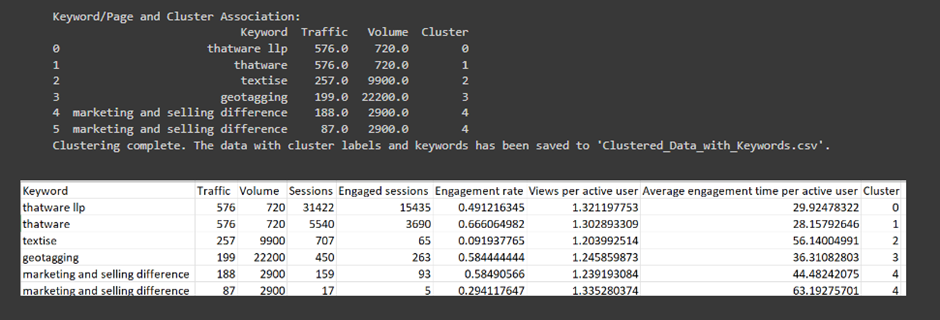
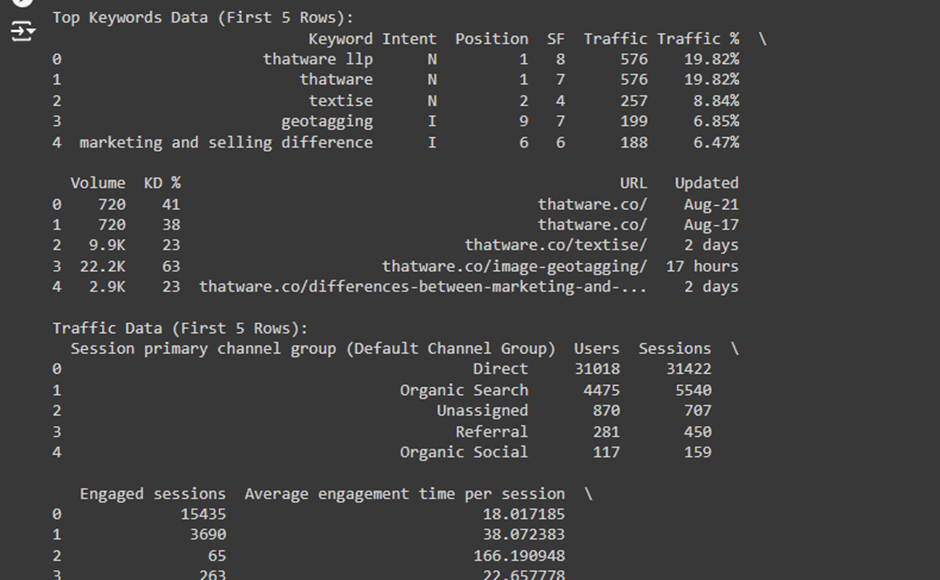
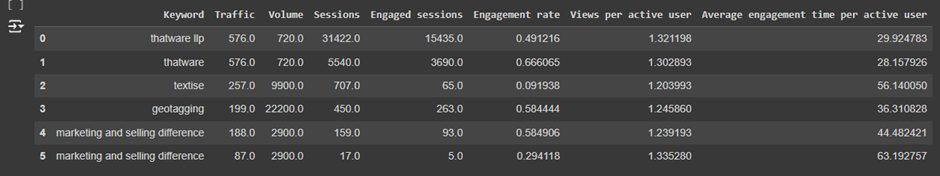
1. Understanding the Clustered_Data.csv File and the Output:
Here are the key columns in the file:
- Traffic: The number of visitors each keyword or page received.
- Volume: The search volume for each keyword.
- Sessions: The total number of sessions (visits) to a page or website.
- Engaged sessions: The number of sessions where users interacted with the page (engagement).
- Engagement rate: The percentage of sessions that were considered engaged.
- Views per active user: The number of views per active user for each page.
- Average engagement time per active user: The average time a user spent on a page.
- Cluster: The cluster label assigned by the Mean Shift Clustering algorithm. This shows which group the data point belongs to.
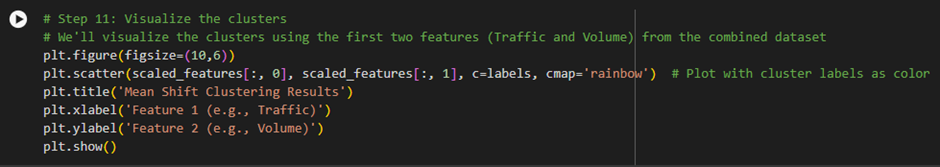
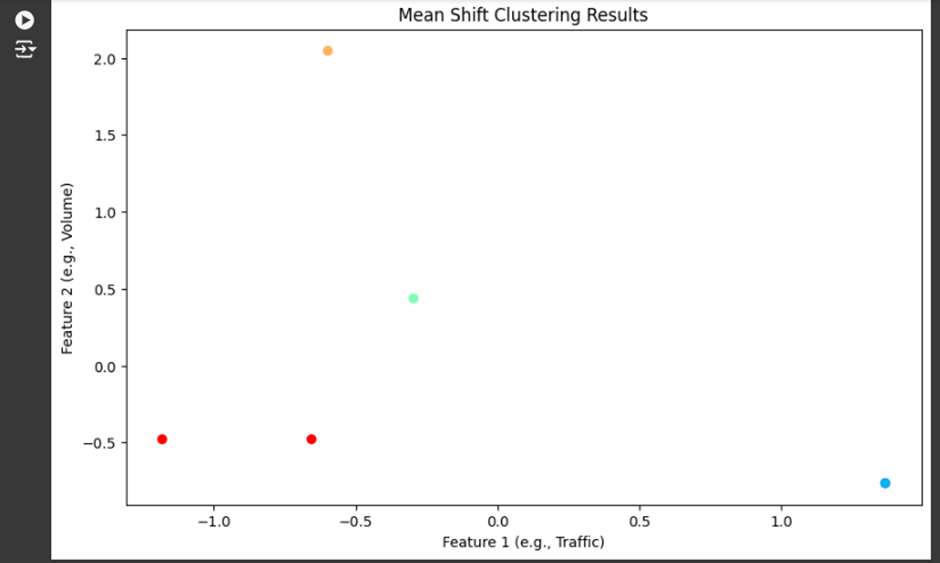
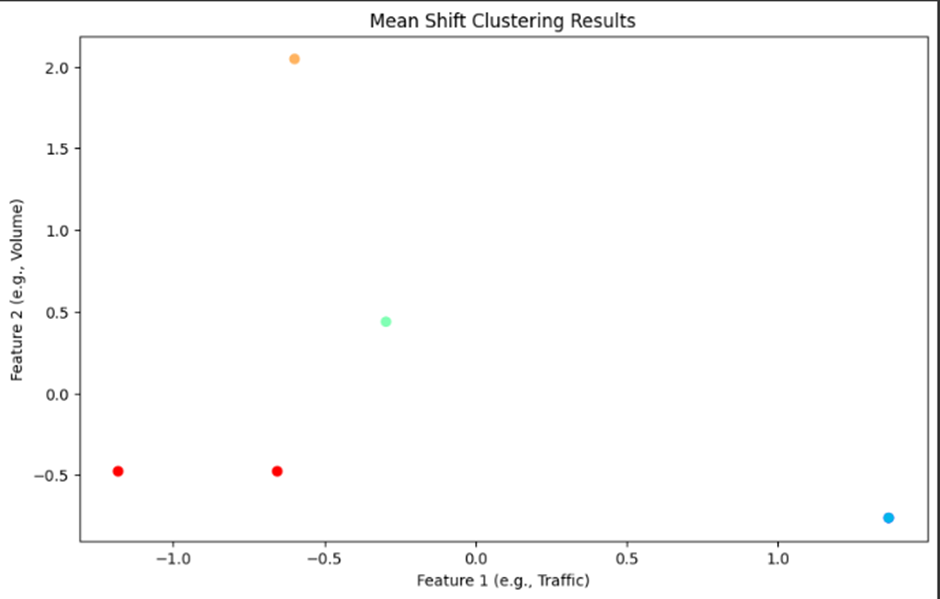
2. What the Scatter Plot Represents:
- Each dot in the scatter plot represents one of these rows in the Clustered_Data.csv file. The color of the dot indicates which cluster the keyword or page belongs to.
For example:
· Cluster 0 (Red): Contains data point(s) where the combination of metrics like traffic, sessions, and engagement is similar.
· Cluster 1 (Green): Contains data point(s) that behave differently from Cluster 0 but have similarities in traffic or engagement among themselves.
· Cluster 2, 3, 4: These represent other clusters, where each group contains pages or keywords that perform similarly in terms of traffic, engagement, or session time.
Each cluster groups together pages or keywords that share similar patterns in terms of how users interact with them.
3. How to Understand Each Cluster in the CSV:
Cluster 0 (Traffic = 576, Volume = 720):
· This keyword/page has medium traffic (576 visitors) and moderate search volume (720).
· It also has high engagement sessions (15,435), meaning users are interacting well with this content.
· Average engagement time per user is around 29.92 seconds.
· Action for Client: Since this page has high engagement, the client should focus on this keyword/page and optimize it further to increase traffic. They might consider using this keyword in ads or content.
Cluster 1 (Traffic = 576, Volume = 720):
· This is similar to Cluster 0, but the engagement rate is higher (66%), and the engaged sessions are lower (3,690).
· Action for Client: This is another valuable keyword/page but may require more optimization to improve engagement further. The client can check if the content is fulfilling users’ needs.
Cluster 2 (Traffic = 257, Volume = 9900):
· This page/keyword has low traffic (257) but high search volume (9,900), which means many people are searching for this keyword but aren’t landing on this page.
· The engagement rate is extremely low at 9%, and the average engagement time is 56 seconds, which is quite high.
· Action for Client: This is an opportunity for improvement. The client should work on improving the page’s SEO to capture more traffic from this high search volume. They should also improve the page’s content to engage users more effectively.
Cluster 3 (Traffic = 199, Volume = 22,200):
· This is another case of low traffic but extremely high search volume.
· The engagement rate is reasonably good (58%), and the average engagement time is decent at 36 seconds.
· Action for Client: This page should be optimized for better SEO to capture more of the high search volume and convert that into traffic. The engagement is decent, so content is resonating well with those who land on the page.
Cluster 4 (Traffic = 188, Volume = 2,900):
· This page has low traffic but moderate search volume.
· The engagement rate is 58%, and the average engagement time is good at 44 seconds.
· Action for Client: The client should improve the content or SEO to attract more traffic. Since users spend a good amount of time on this page, it shows potential to convert visitors if optimized well.
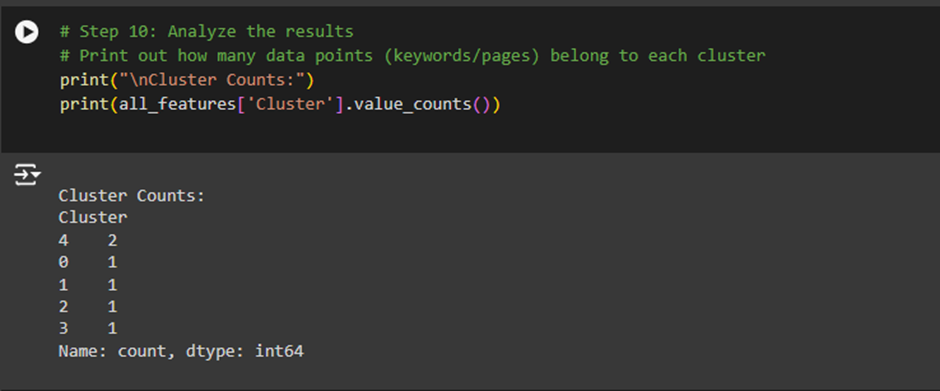
Main Points to Understand The Output:
· Clusters are groups of similar performing keywords or pages. By looking at these clusters, we can understand which areas of the website are working well and which ones need improvement.
· Cluster 0 and 1: These pages are performing well, but there’s still room for optimization to increase traffic or engagement.
· Cluster 2 and 3: These pages have high search volume but low traffic. These are missed opportunities, and by improving the SEO or content, the client can attract more visitors.
· Cluster 4: This page has potential, with good user engagement. By improving traffic, it can become a valuable asset.

Thatware | Founder & CEO
Tuhin is recognized across the globe for his vision to revolutionize digital transformation industry with the help of cutting-edge technology. He won bronze for India at the Stevie Awards USA as well as winning the India Business Awards, India Technology Award, Top 100 influential tech leaders from Analytics Insights, Clutch Global Front runner in digital marketing, founder of the fastest growing company in Asia by The CEO Magazine and is a TEDx speaker.
