SUPERCHARGE YOUR ONLINE VISIBILITY! CONTACT US AND LET’S ACHIEVE EXCELLENCE TOGETHER!

⭐️URL Inspection API Automation using Screaming frog
The Google URL Inspection API allows users to request the data Search Console has about the indexed version of a URL, including index status, coverage, rich results, mobile usability and more. This means you’re able to check in bulk whether URLs are indexed on Google, and if there are warnings or issues.
The URL Inspection API has been integrated into the Screaming Frog SEO Spider, so users can pull in data for up to 2k URLs per property a day alongside all the usual crawl data.
⭐️How to Connect to The URL Inspection API
Click ‘Config > API Access > Google Search Console’, connect to a Search Console account, choose the property
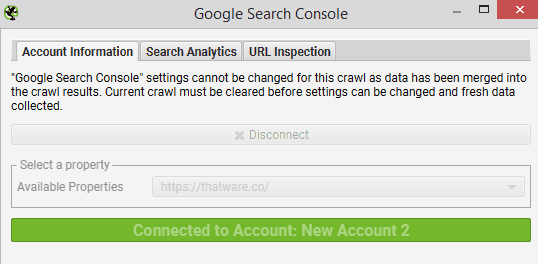
Then under the ‘URL Inspection’ tab, select ‘Enable URL Inspection’.
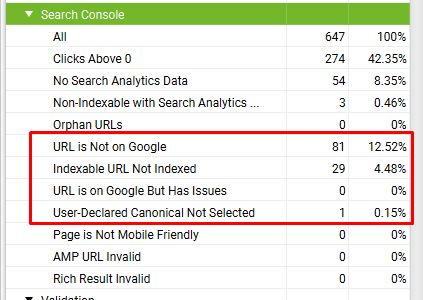
Then start the website crawl, URL Inspection API data will then be populated in the ‘Search Console’ tab, alongside the usual Search Analytics data (impressions, clicks, etc).

⭐️Start Crawl analysis

Select Search Console tab

Select The Search Console tab includes the following URL Inspection API related issues pages–
- URL Is Not on Google
- Indexable URL Not Indexed
- URL is on Google, But Has Issues
- User-Declared Canonical Not Selected
- Page Is Not Mobile Friendly
- AMP URL Is Invalid
- Rich Result Invalid
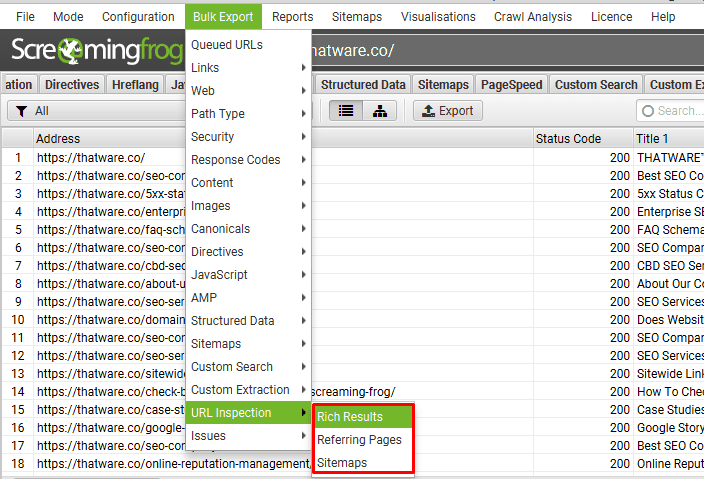
Export Google Rich Result types, errors and warnings, details on referring pages and Sitemaps via the ‘Bulk Export > URL Inspection’ menu.
If you have hit the 2k URLs per day per property limit for the URL Inspection API you will receive this message.

If your website have more than 2K URLs in URL inspection API then how to choose pages.
Use the SEO Spider configuration to focus the crawl to key sections, pages or a variety of template types.
Some of the main options include –
- Crawl by subdomain or subfolder.
- Use the Include to narrow the crawl.
- Exclude areas that are not important.
- Upload key pages or templates for sampling in list mode.
- Consider adjusting any crawl limits.
Under ‘Config > API Access > Google Search Console’ and the ‘URL Inspection’ tab, you can ‘Ignore Non-Indexable URLs for URL Inspection’, if you’re only interested in data for URLs that are Indexable in a crawl.

You wait for 24hrs, re-open the crawl, connect to the API again and then bulk highlight and ‘re-spider’ the next 2k URLs to get URL Inspection API data.
export the previous crawl, copy the URLs you want URL Inspection data from, and upload in list mode.
Before exporting and combining with the previous days crawl data.
⭐️How to Automate URL Inspection Data & Index Monitoring
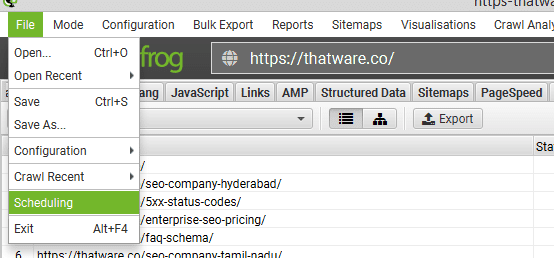
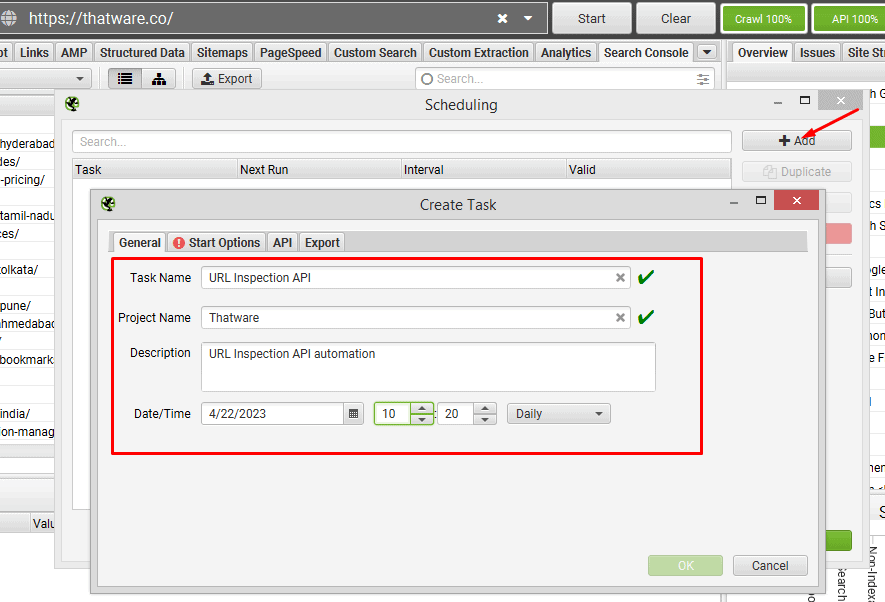
Go to ‘File > Scheduling’
under ‘General’ choose a task and project name and daily interval.
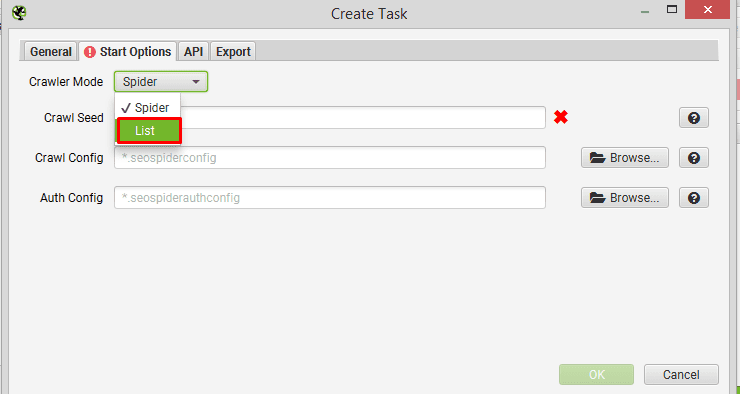
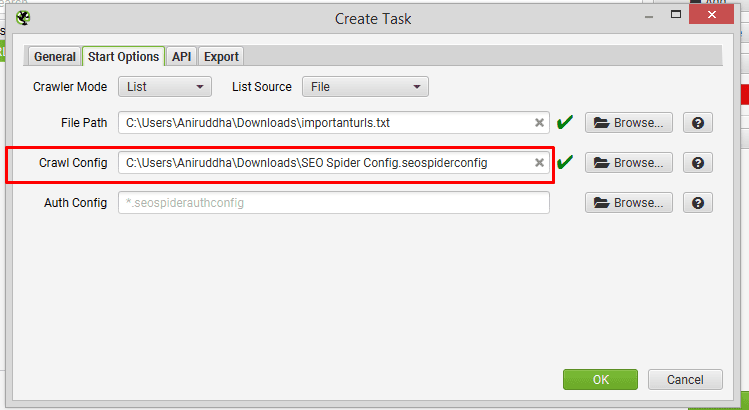
Next, click ‘Start Options’ and switch ‘Crawler Mode’ to ‘List’.
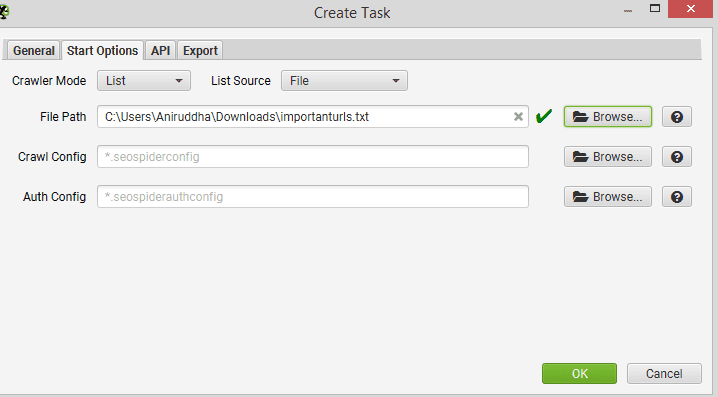
For ‘File path’, click ‘browse’ and select a .txt file with the URLs you want to check every day for URL Inspection data.
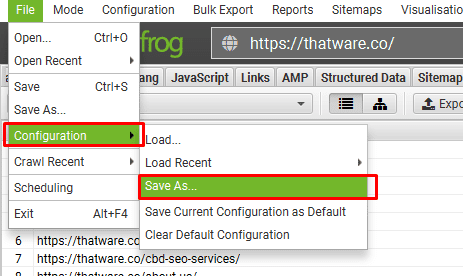
For ‘Crawl Config’ in scheduling ‘Start Options’,
click ‘File > Config > Save As’.
Then Select the download file
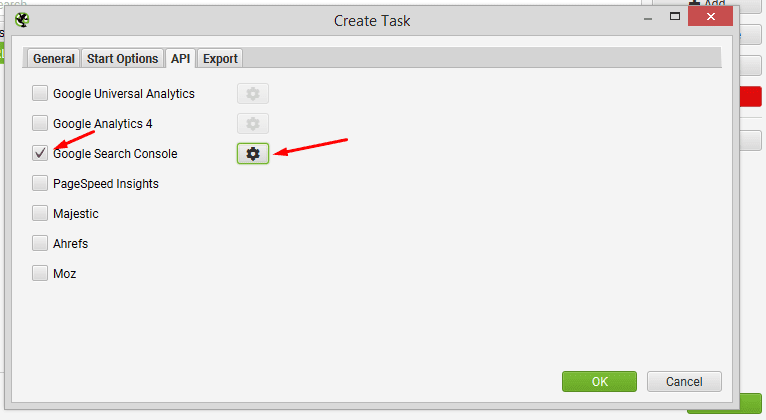
Enable the ‘Google Search Console’ API, click ‘Configure’ and select the account and property.
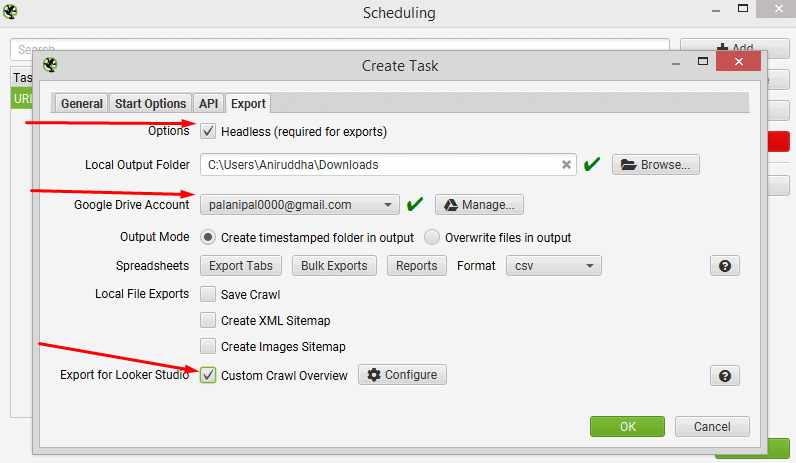
On the ‘Export’ tab, enable ‘Headless’ and choose the ‘Google Drive Account’ to export the URL Inspection API data in a Google Sheet.
Next, click ‘Export For Data Studio’ and then the ‘Configure’ button next to it.
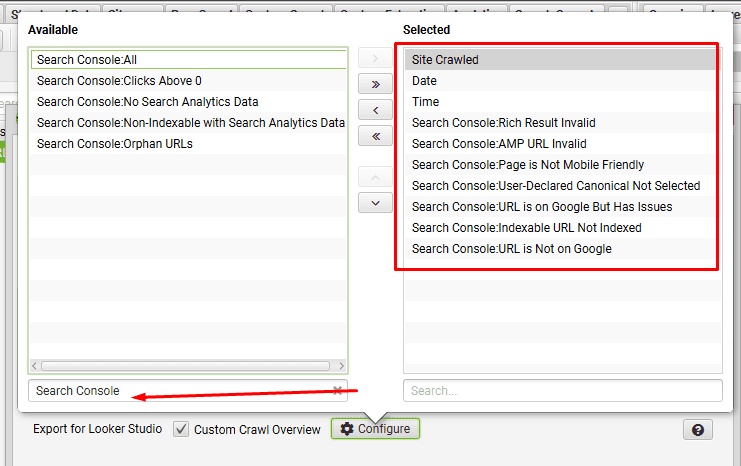
Select ‘Site Crawled’, ‘Date’ and ‘Time’ metrics
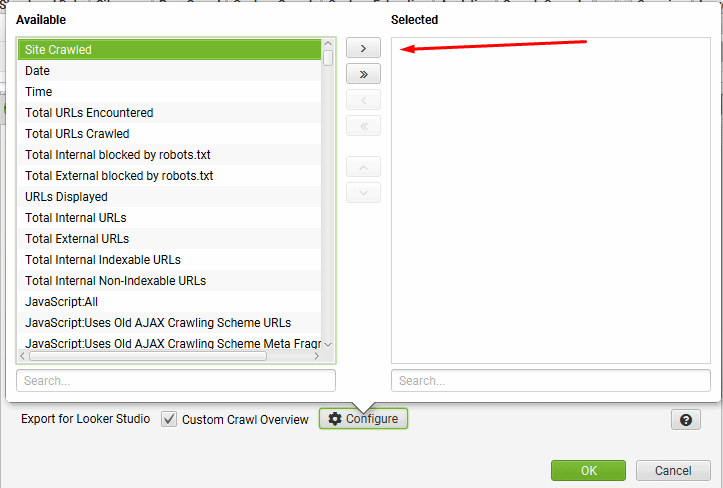
then search for ‘Search Console’ to see the list of metrics available for this tab. Select the bottom 7 metrics, which are related to URL Inspection and click the right arrow.
When the scheduled crawl has run the ‘Export for Data Studio’ Google Sheet will be exported into your chosen Google Drive account.

By default the ‘Export for Data Studio’ location is ‘My Drive > Screaming Frog SEO Spider > Project Name > [task_name]_crawl_summary_report’.
Now make a copy of our URL Inspection Monitoring Data Studio template and connect to your own Google Sheet with data from the ‘Export for Data Studio’ crawl summary report.
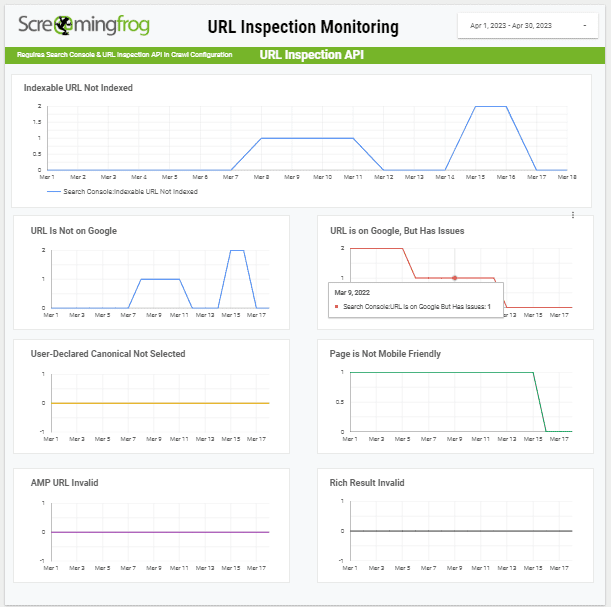
You now have a daily index monitoring system for the most important URLs on the website, which will alert you to any URLs that are not indexed, or have issues.
⭐️Update website cache using Python and the Google PageSpeed Insights API
First, you will need to create a Google API key to access the PageSpeed Insights API. To do this, go to the Google Cloud Console (https://console.cloud.google.com/) and sign in with your Google account.
- Once you’re signed in, create a new project by clicking on the “Select a project” dropdown at the top of the screen and clicking on “New Project”. Give your project a name and click “Create”.
- With your new project selected, go to the “APIs & Services” section of the Cloud Console and click on “Dashboard”. From there, click on “ENABLE APIS AND SERVICES”.
- In the search bar, search for “PageSpeed Insights API” and click on the result. Then, click on “Enable” to enable the API for your project.
- Next, you will need to create an API key to use with the PageSpeed Insights API. Go to the “Credentials” section of the Cloud Console and click on “Create credentials”. Choose “API key” from the dropdown and click “Create”. Your API key will be displayed on the screen.
- Now that you have your API key, you can use Python to update website cache using the PageSpeed Insights API. Open up your favorite text editor or Python IDE and create a new Python file.
In your Python file, import the necessary libraries:
import requests
import json
Define the API endpoint and parameters for the PageSpeed Insights API. Replace “YOUR_API_KEY” with your actual API key, and replace “https://example.com” with the URL of the website you want to analyze:
url = “https://www.googleapis.com/pagespeedonline/v5/runPagespeed”
params = {
“url”: “https://example.com”,
“strategy”: “desktop”,
“fields”: “lighthouseResult/cachedPages/cachedHtml”,
“key”: “YOUR_API_KEY”
}
Make an HTTP GET request to the API endpoint using the requests library.
import requests
import json
Parse the JSON response using the json library.
# Parse the JSON response
data = json.loads(response.content)
Extract the cached HTML data from the response
# Extract the relevant data from the response
cached_html = data[“lighthouseResult”][“cachedPages”][“cachedHtml”]
Update the cache with the new data by creating a dictionary with the key “website_data” and the value of the cached HTML data. You can use any caching mechanism you like, such as writing the data to disk or storing it in a database
# Update the cache with the new data
cache = {“website_data”: cached_html}
# code to write the updated cache back to disk or a database
Save your Python file and run it using the command line or your IDE’s run command. If everything is set up correctly, your Python code should make a request to the PageSpeed Insights API, retrieve the cached HTML data, and update your website cache accordingly.
That’s it! By following these steps, you should now be able to update website cache using Python and the Google PageSpeed Insights API.
Full Python Code:
import requests
import json
# Define the API endpoint and parameters
url = “https://www.googleapis.com/pagespeedonline/v5/runPagespeed”
params = {
“url”: “https://example.com”,
“strategy”: “desktop”,
“fields”: “lighthouseResult/cachedPages/cachedHtml”,
“key”: “YOUR_API_KEY”
}
# Make an HTTP GET request to the API endpoint
response = requests.get(url, params=params)
# Parse the JSON response
data = json.loads(response.content)
# Extract the relevant data from the response
cached_html = data[“lighthouseResult”][“cachedPages”][“cachedHtml”]
# Update the cache with the new data
cache = {“website_data”: cached_html}
# code to write the updated cache back to disk or a database
These undenied technical SEO factors will certainly going to improve your SEO campaign performance. So don’t hesitate to get it implemented right away!

