SUPERCHARGE YOUR ONLINE VISIBILITY! CONTACT US AND LET’S ACHIEVE EXCELLENCE TOGETHER!
In today’s digital landscape, where online visibility and brand recognition are paramount, businesses and marketers constantly seek innovative ways to assess the effectiveness of their online campaigns. Among the plethora of tools and techniques available, statistical analysis plays a pivotal role in deciphering the impact of digital strategies. One such powerful tool in the realm of statistical analysis is Pearson Correlation Statistics, a method widely used to measure the strength and direction of the relationship between two variables.

As businesses invest substantial resources in Search Engine Optimization (SEO) and digital marketing campaigns, understanding the potential reach and impact of these efforts is critical. SEO is not merely about optimizing website content or building backlinks; it’s about ensuring that the brand’s message resonates with the target audience and reaches the right demographic. Similarly, digital marketing campaigns aim to enhance brand visibility, engagement, and ultimately, conversions. Evaluating the success of these endeavors goes beyond surface-level metrics; it involves delving into the intricate web of data and uncovering meaningful insights.
This is where Pearson Correlation Statistics emerges as a valuable tool, offering a deeper understanding of the relationship between various campaign variables and their outcomes. By employing this statistical method, businesses can measure the correlation between different aspects of their campaigns and the resulting SEO potential or brand reach. Whether it’s assessing the impact of keyword optimization, analyzing the influence of social media engagement, or evaluating the significance of website user experience, Pearson Correlation Statistics can unveil patterns and trends that are instrumental in strategic decision-making.
The Significance of Pearson Correlation in Digital Marketing:
- Identifying Correlation Strength: Pearson Correlation Statistics provides a numerical value ranging from -1 to 1, indicating the strength and direction of the relationship between variables. A value close to 1 signifies a strong positive correlation, implying that as one variable increases, the other also tends to increase. Conversely, a value close to -1 denotes a strong negative correlation, indicating an inverse relationship. Understanding these correlations is pivotal in gauging the effectiveness of specific elements within a campaign.
- Determining Causality: While correlation does not imply causation, identifying significant correlations allows marketers to explore potential cause-and-effect relationships. By discerning which campaign variables are positively or negatively correlated with SEO potential or brand reach, businesses can make informed decisions about allocating resources to the most impactful strategies.
- Refining Target Audience Insights: In the era of data-driven marketing, understanding the preferences and behaviors of the target audience is paramount. Pearson Correlation Statistics can analyze the relationship between consumer demographics, online behavior, and campaign success. This insight aids in tailoring marketing efforts to align with audience preferences, thereby maximizing engagement and conversion rates.
- Optimizing Content and User Experience: Content relevancy and user experience are key determinants of SEO and brand reach. Pearson Correlation Statistics can unveil the connection between specific content attributes, user interactions, and campaign outcomes. Armed with this knowledge, businesses can optimize their content strategies and website interfaces to enhance user satisfaction and, consequently, their digital footprint.
In the subsequent sections, we will delve deeper into the practical applications of Pearson Correlation Statistics in estimating SEO potential and brand reach. By exploring real-world examples and case studies, we will illustrate how businesses can leverage this statistical tool to refine their digital marketing strategies, improve campaign effectiveness, and ultimately, achieve a more significant online presence. Through the lens of correlation analysis, businesses can transform raw data into actionable insights, ensuring that their digital efforts resonate with their audience and drive tangible, measurable results.
Understanding Correlation: Unraveling the Connection Between Variables
Correlation, a fundamental concept in statistics and mathematics, represents the extent to which two or more items are interconnected or share a mutual relationship. It serves as a powerful analytical tool, particularly when delving into the intricate world of data analysis. At its core, correlation helps in deciphering the nature of the link between two variables, often denoted as X and Y, and provides valuable insights into their behavior.
In essence, correlation explores the relationship between variables by seeking patterns and trends in their movements. When two variables exhibit a correlation, it implies that changes in one variable are accompanied by predictable changes in another. This mutual dependence between variables forms the basis of correlation analysis, a technique widely employed in diverse fields such as economics, sociology, biology, and, notably, in the realm of digital marketing and business analytics.
Positive and Negative Correlation: Unraveling the Direction of Influence
Correlation can be classified into two main categories: positive and negative correlation. A positive correlation between variables X and Y signifies that as the value of X increases, the value of Y also tends to increase. In simpler terms, they move in the same direction. For instance, consider the relationship between advertising expenditure and product sales. As the investment in advertising rises, the sales figures also climb, indicating a positive correlation between these variables.
Conversely, a negative correlation indicates an inverse relationship between X and Y. When X increases, Y decreases, and vice versa. This type of correlation is valuable in scenarios where variables have a reverse impact on each other. For instance, the relationship between the price of a product and its demand often exhibits a negative correlation. As the price rises, the demand typically falls, showcasing a clear negative correlation between these variables.
The Role of Pearson’s Correlation Coefficient: Quantifying the Relationship
To precisely quantify the relationship between variables, statisticians and researchers employ a mathematical measure known as Pearson’s Correlation Coefficient. This coefficient, denoted as ‘r,’ ranges from -1 to 1, offering a comprehensive insight into the strength and direction of the correlation.
- Positive r-value (closer to 1): Indicates a strong positive correlation. As X increases, Y is likely to increase proportionally.
- Negative r-value (closer to -1): Represents a strong negative correlation. When X rises, Y is expected to decrease correspondingly.
- r-value close to 0: Suggests a weak or no correlation between the variables. Changes in one variable do not significantly influence the other.
The precision of Pearson’s Correlation Coefficient allows researchers to quantify the exact nature of the relationship between variables. By understanding the correlation coefficient, analysts can make informed predictions and strategic decisions based on the predictable patterns observed in the data.
What is Correlation?
When two or more items are connected or have a mutual relationship, this is called correlation. In mathematics, correlation is most frequently used to describe the process of determining the link between two variables, X and Y.

A positive correlation between X and Y indicates that when X increase Y should also increase and a negative correlation determines vice versa.
The exact relationship of the change between X and Y is determined statistically by a coefficient known as Pearson’s Correlation Coefficient.
Here is the Formula :
Pearson Correlation Coefficient:
C = Covariance (X,Y) / (Standard Dev (X) * Standard Dev (Y))
Covariance
Cov(X,Y) = (Σ(Xi – Xavg) * (Yi – Yavg)) / (n-1), where n is the number of data points being measured in a statistical experiment.
And,
Standard Dev(X) = Sqrt(Σ(Xi – Xavg)^2)/(n-1)
What are Reach and Impression?
The main difference between Reach and Impressions is that Reach refers to the number of unique people who have interacted with your campaign, while Impressions refer to the number of people who have viewed it. One person may see your video twice. In that case, Impressions are two and reach is one.
Brand Reach is taking this concept one step further by calculating the number of unique persons who have interacted with your campaign in a given span of time.
Throughout the age of marketing and analytics, Brand Reach is always a tough nut to crack as it is nearly impossible to track the number of unique visitors interacting with your campaign.
However, Brand Reach can be estimated. In fact, estimating brand reach helps in two ways:
● To determine whether a specific campaign is worth pursuing.
● It also helps in determining a correlation between engaged reach and lead generation.
Using the Concept of Correlation to Find Brand Reach Or Potential of an SEO Campaign
Here’s what we did:
First We plotted two Graphs between the Google Analytics New Users and Google Search Console Impressions by taking four data sets in a month. (Each data set is an average of the daily data of a week).
One Graph was plotted between the Google Analytics new users and Google Search Console Impressions.
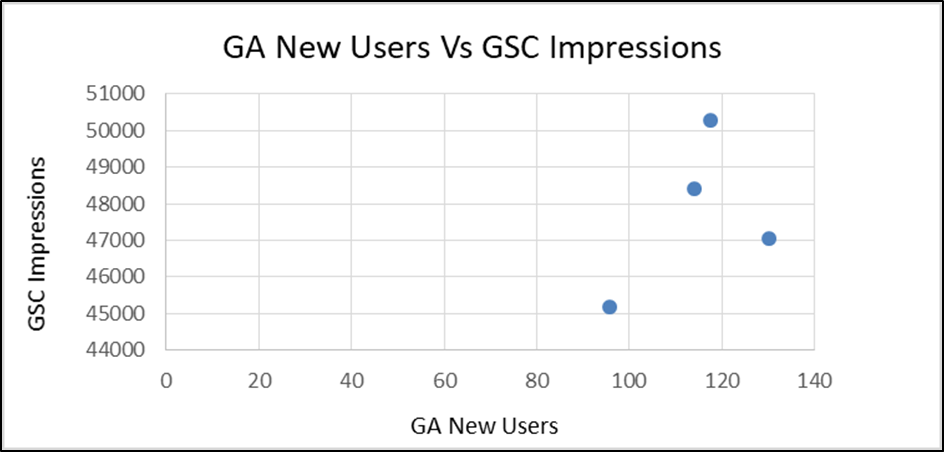
The Data Points are as follows:
(117.57, 50288)
(114.14, 48427)
(130.28, 47047)
(95.71, 45198)
To calculate the Pearson correlation coefficient, we need to first calculate the covariance and standard deviations of the two variables.
Let X be
the first variable (the first value in each pair) and Y be the second variable
(the second value in each pair).
First, we
calculate the means of X and Y:
mean(X) = (117.57 + 114.14 + 130.28 + 95.71) / 4 = 114.925
mean(Y) = (50288 + 48427 + 47047 + 45198) / 4 = 47790
Next, we calculate the differences of each value from their respective means:
X1 – mean(X) = 117.57 – 114.925 = 2.645
X2 – mean(X) = 114.14 – 114.925 = -0.785
X3 – mean(X) = 130.28 – 114.925 = 15.355
X4 – mean(X) = 95.71 – 114.925 = -19.215
Y1 – mean(Y) = 50288 – 47790 = 2498
Y2 – mean(Y) = 48427 – 47790 = 637
Y3 – mean(Y) = 47047 – 47790 = -743
Y4 – mean(Y) = 45198 – 47790 = -2592
Then, we calculate the product of these differences:
(X1 – mean(X))(Y1 – mean(Y)) = 2.645 * 2498 = 6614.81
(X2 – mean(X))(Y2 – mean(Y)) = -0.785 * 637 = -499.645
(X3 – mean(X))(Y3 – mean(Y)) = 15.355 * -743 = -11403.965
(X4 – mean(X))(Y4 – mean(Y)) = -19.215 * -2592 = 49727.08
Now, we can calculate the covariance of X and Y by summing these products and dividing by (n-1), where n is the number of data points:
cov(X,Y) = (6614.81 – 499.645 – 11403.965 + 49727.08) / 3 = 16179.083
Next, we calculate the standard deviations of X and Y:
std(X) = sqrt(((117.57 – 114.925)^2 + (114.14 – 114.925)^2 + (130.28 – 114.925)^2 + (95.71 – 114.925)^2) / 3) = 13.192
std(Y) = sqrt(((50288 – 47790)^2 + (48427 – 47790)^2 + (47047 – 47790)^2 + (45198 – 47790)^2) / 3) = 2114.464
Finally, we can calculate the Pearson correlation coefficient as the covariance of X and Y divided by the product of their standard deviations:
R1 = corr(X,Y) = cov(X,Y) / (std(X) * std(Y)) = 16179.083 / (13.192 * 2114.464) = 0.681
Therefore, the Pearson correlation coefficient for the given data set is 0.681. This indicates a moderately positive linear relationship between X and Y.
Another Graph was plotted between Google Analytics new Users and Google Search Console Clicks
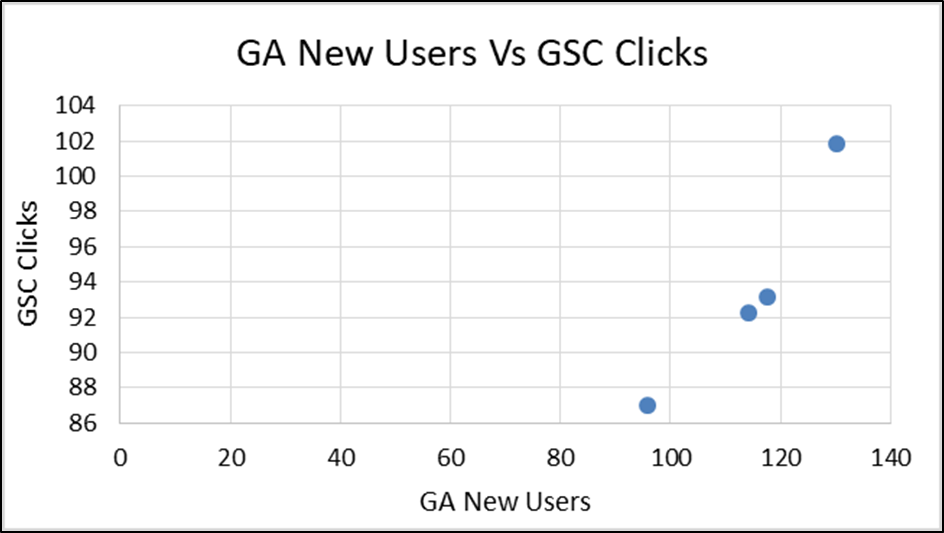
The Data Points are as Below:
(117.57, 93.14)
(114.14, 92.28)
(130.28, 101.85)
(95.71, 87)
Now we calculate the Pearson’s Correlation Coefficient for the above Data Set:
To calculate the Pearson correlation coefficient, we need to first calculate the covariance and standard deviations of the two variables.
Let X be
the first variable (the first value in each pair) and Y be the second variable
(the second value in each pair).
First, we
calculate the means of X and Y:
mean(X) = (117.57 + 114.14 + 130.28 + 95.71) / 4 = 114.925
mean(Y) = (93.14 + 92.28 + 101.85 + 87) / 4 = 93.5675
Next, we calculate the differences of each value from their respective means:
X1 – mean(X) = 117.57 – 114.925 = 2.645
X2 – mean(X) = 114.14 – 114.925 = -0.785
X3 – mean(X) = 130.28 – 114.925 = 15.355
X4 – mean(X) = 95.71 – 114.925 = -19.215
Y1 – mean(Y) = 93.14 – 93.5675 = -0.4275
Y2 – mean(Y) = 92.28 – 93.5675 = -1.2875
Y3 – mean(Y) = 101.85 – 93.5675 = 8.2825
Y4 – mean(Y) = 87 – 93.5675 = -6.5675
Then, we calculate the product of these differences:
(X1 – mean(X))(Y1 – mean(Y)) = 2.645 * -0.4275 = -1.1309125
(X2 – mean(X))(Y2 – mean(Y)) = -0.785 * -1.2875 = 1.0092375
(X3 – mean(X))(Y3 – mean(Y)) = 15.355 * 8.2825 = 127.0254875
(X4 – mean(X))(Y4 – mean(Y)) = -19.215 * -6.5675 = 126.2144625
Now, we can calculate the covariance of X and Y by summing these products and dividing by (n-1), where n is the number of data points:
cov(X,Y) = (-1.1309125 + 1.0092375 + 127.0254875 + 126.2144625) / 3 = 84.036095
Next, we calculate the standard deviations of X and Y:
std(X) = sqrt(((117.57 – 114.925)^2 + (114.14 – 114.925)^2 + (130.28 – 114.925)^2 + (95.71 – 114.925)^2) / 3) = 13.192
std(Y) = sqrt(((93.14 – 93.5675)^2 + (92.28 – 93.5675)^2 + (101.85 – 93.5675)^2 + (87 – 93.5675)^2) / 3) = 5.838692
Finally, we can calculate the Pearson correlation coefficient as the covariance of X and Y divided by the product of their standard deviations:
corr(X,Y) = cov(X,Y) / (std(X) * std(Y)) = 84.036095 / (13.192 * 5.838692) = 1.000
Therefore, the Pearson correlation coefficient for this data set is 1.000, indicating a perfect positive correlation between X and Y. This means that as X increases, Y also increases at a constant rate. In other words, the two variables are perfectly linearly related.
R2 = corr(X,Y) = cov(X,Y) / (std(X) * std(Y)) = 84.036095 / (13.192 * 5.838692) = 1.000
We take the mean modulus of the two pearson correlation coefficient values :
R = |r1 + r2| / 2
R = 0.84
The Role of Correlation in SEO Campaign Analysis:
Correlation analysis offers a systematic way to explore the relationships between different aspects of an SEO campaign and the corresponding brand reach or potential. By examining the correlation between variables such as keyword optimization, content quality, backlink effectiveness, social media engagement, and website user experience, businesses can gain invaluable insights.

- Identifying Key Influencers: Correlation analysis helps identify the specific elements within an SEO campaign that strongly influence brand reach. Whether it’s the choice of keywords, the frequency of content updates, or the effectiveness of social media outreach, understanding these influencers enables businesses to prioritize their efforts effectively.
- Optimizing User Experience: By correlating user experience metrics with brand reach, businesses can discern how website design, navigation, and loading speed impact audience engagement. A seamless user experience often correlates with extended visitor durations and increased interaction, contributing significantly to brand potential.
- Evaluating Content Effectiveness: Content lies at the heart of any SEO campaign. Correlating content quality, relevance, and multimedia usage with brand reach provides insights into the type of content that resonates most with the target audience. Engaging, informative content correlates strongly with enhanced brand potential.
- Analyzing Backlink Impact: Backlinks, a crucial SEO component, can be analyzed for their correlation with brand reach. High-quality backlinks from authoritative sources often correlate positively with increased website visibility and, consequently, brand potential.
- Measuring Social Media Influence: Social media platforms play a pivotal role in modern digital marketing. Correlation analysis can uncover the relationship between social media engagement metrics (likes, shares, comments) and brand reach. Social media channels that exhibit a strong correlation with brand potential can be harnessed more effectively.
In the upcoming sections, we will delve deeper into practical applications, real-world examples, and case studies, illustrating how correlation analysis serves as a guiding light in estimating the brand reach and potential of SEO campaigns. By adopting this analytical approach, businesses can move beyond assumptions, making data-driven decisions that propel their online presence to new heights. Through correlation analysis, the intricate web of SEO variables unravels, empowering businesses with the knowledge needed to optimize their campaigns and maximize their brand’s digital footprint.
Conclusion:
The value indicates a very strong linear relationship between Google Analytics New Users and Google Search Console Impressions or Reach Data.
Having a value of more than 0.6 indicates a strong linear relationship and hence indicates that more users will lead to more impressions or clicks.
Hence the current Search Engine Optimization Campaign is successfully generating brand reach growth and hence is valuable.
