Get a Customized Website SEO Audit and Online Marketing Strategy and Action Plan
In Mid June 2021, Google launched a new Beta functionality on search console named “Search Console Insights“. This immediately created a lot of buzz within the SEO industry. Now the immediate question is what exactly is Search Console Insights and what you can expect from it? Today, in this post we will cover everything related to this topic. We will also share a detailed thesis on how you can use the data for improving your SEO. Without further ado let’s dive in!
What is Search Console Insights?
This is the all-new functionality introduced within the existing Google Webmaster Tool A.K.A Google Search Console. It provides a detailed analysis of user metrics and content statistics. The data are correlated from both Google Search Console and Google Analytics.
Why ‘Search Console Insights’ Data Can Be Helpful For Your SEO?
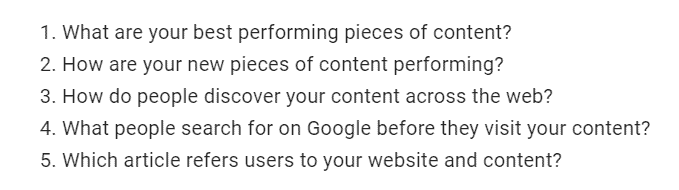
The data that one can obtain from ‘Search Console Insights’ can be useful from various perspective. It can provide detailed insights into several angles within your website. The pointers are mentioned in the below image.
User Behavior Patterns: Unlocking Insights to Enhance SEO and User Experience
Understanding user behavior patterns is a cornerstone of successful SEO and user experience (UX) design. In this section, we will delve into how observing and analyzing user behavior can empower website owners to make informed decisions. This comprehensive analysis will explore the importance of user behavior data, methods to collect it, tools that facilitate the process, and actionable strategies to optimize both SEO and UX based on the insights gained.
Why User Behavior Patterns Matter
User behavior data offers a window into how visitors interact with a website. These insights help answer critical questions:
Are users finding what they need?
What content or features do they engage with most?
Where do they drop off, and why?
How can we encourage conversions?
By studying user patterns, businesses can:
Identify pain points that hinder navigation or engagement.
Tailor content and design to user preferences.
Improve site performance to meet user expectations.
Enhance conversion rates by optimizing user journeys.
Key Metrics to Track User Behavior
1. Bounce Rate
Indicates the percentage of visitors who leave the site after viewing only one page.
A high bounce rate often signals issues such as irrelevant content, poor design, or slow loading times.
2. Session Duration
Measures the average time users spend on the site. Longer durations typically suggest better engagement.
3. Pages Per Session
Reflects how many pages users view during a single visit. Higher numbers indicate effective navigation and content relevance.
4. Click-Through Rate (CTR)
Shows the percentage of users who click on a link, whether in search results, CTAs, or internal navigation.
5. Heatmaps
Visual representations of where users click, scroll, and hover, offering insights into content prioritization and layout effectiveness.
6. Exit Rate
Identifies the percentage of users who leave the site from specific pages, helping pinpoint potential bottlenecks.
Tools for Analyzing User Behavior
1. Google Analytics
Provides in-depth metrics such as bounce rates, session durations, and traffic sources.
2. Google Search Console Insights
Offers a synthesis of search and user metrics, combining traffic data with user engagement insights.
3. Hotjar
Generates heatmaps, session recordings, and user surveys to understand navigation and interaction patterns.
4. Crazy Egg
Delivers click-tracking and scroll maps to evaluate content performance and layout efficiency.
5. Microsoft Clarity
Offers session replays and heatmaps for free, along with additional tools to identify user frustration signals.
6. Behavioral Surveys and Feedback
Tools like Typeform and Qualtrics allow direct input from users to understand their motivations, challenges, and preferences.
Strategies to Leverage User Behavior Data for SEO and UX
1. Optimize for Speed and Accessibility
Insight: High bounce rates often correlate with slow-loading pages.
Action: Use tools like PageSpeed Insights to identify and resolve performance issues. Ensure your site is mobile-friendly and meets accessibility standards (e.g., WCAG).
2. Improve Navigation Structure
Insight: Low pages per session indicate navigation challenges.
Action: Simplify menu structures, include breadcrumbs, and ensure clear CTAs to guide users through logical paths.
3. Enhance Content Relevance
Insight: High exit rates on specific pages suggest irrelevant or insufficient content.
Action: Conduct keyword research and update underperforming content to match user intent. Use internal links to direct traffic to related pages.
4. Utilize Heatmaps for Layout Optimization
Insight: Heatmaps reveal areas of high interaction and dead zones.
Action: Relocate important elements (e.g., CTAs, key information) to high-engagement areas. Remove clutter from low-performing zones.
5. A/B Testing
Insight: Understanding what resonates with users can refine design and content decisions.
Action: Use tools like Optimizely or Google Optimize to test variations of headlines, CTAs, layouts, or designs. Measure performance based on defined goals.
6. Focus on Conversion Funnel Optimization
Insight: Drop-offs in the funnel highlight barriers to conversions.
Action: Map the user journey and streamline processes like form-filling, checkout, or account creation. Test shorter forms and clearer instructions.
7. Monitor Internal Search Behavior
Insight: Search terms reveal what users are looking for but might not find easily.
Action: Optimize search functionality and create dedicated content or pages for frequent queries.
Content Performance Over Time
Understanding content performance over time is vital for gauging the effectiveness of your digital strategies. This evaluation helps identify trends, predict outcomes, and refine future approaches to maximize engagement, conversions, and ROI. In this section, we will explore the multifaceted nature of content performance, the key metrics to measure, the tools to analyze data, and actionable insights derived from longitudinal analysis.
The Dynamics of Content Performance
Content performance is a dynamic journey influenced by a variety of factors like shifting user behaviors, search engine algorithm updates, and evolving market demands. Understanding this journey requires tracking performance metrics over time, revealing the lifecycle of content and enabling strategic interventions to maintain or enhance its value.
The Lifecycle of Content Performance
1. Initial Surge
When content is newly published, it often benefits from a sudden peak in visibility and interaction. This “honeymoon phase” can be attributed to:
Novelty Factor: Audiences are drawn to fresh material, particularly when it’s relevant or addresses timely topics.
Active Promotion: Sharing through social media, email campaigns, or paid advertising boosts initial reach.
Algorithm Favorability: Search engines or platforms often give new content a temporary advantage to test its value to users.
2. Plateau Period
Following the surge, content typically stabilizes in terms of traffic and engagement. This phase, while less dramatic, is critical because:
It reflects the baseline value of the content without external promotions.
A consistent flow of engagement often signals that the content is relevant to a steady audience segment.
It allows for the collection of deeper insights into the content’s enduring appeal and weaknesses.
3. Decline or Reinvigoration
Content doesn’t stay evergreen without effort. Over time, several outcomes are possible:
Decline: Content may lose relevance due to outdated information, reduced search interest, or competition from newer material.
Reinvigoration: Strategic updates, such as refreshing data, optimizing for new keywords, or repurposing into different formats (like videos or infographics), can breathe new life into the content. This stage highlights the importance of a robust content audit strategy to identify opportunities for revitalization.
Key Metrics to Monitor
Evaluating content performance over time requires tracking specific metrics that reveal insights into engagement, reach, and effectiveness:
Traffic Sources: Understanding where your audience originates—whether organic search, social media, direct visits, or referrals—helps refine distribution strategies.
Organic search: Indicates SEO effectiveness.
Social media: Reflects shareability and relevance on platforms.
Engagement Metrics: These include time on page, bounce rate, and pages per session. High engagement signals content resonance with the target audience.
Example: Articles with an average session duration of over two minutes are more likely to hold user attention.
Conversion Rates: Assess how content contributes to specific goals such as lead generation, sales, or newsletter signups.
Backlinks and Social Shares: Over time, backlinks and shares measure a content’s authority and shareability. Trending topics often see a spike in these metrics, while evergreen content sustains them longer.
Keyword Rankings: Tracking keyword performance over time indicates how well content aligns with search intent and adapts to algorithm changes.
Tools for Analysis
Several tools offer in-depth insights into content performance. Combining these tools provides a holistic view:
Google Analytics: Essential for monitoring traffic, engagement, and conversions. Utilize historical data to compare performance periods.
Google Search Console: Highlights search query trends, click-through rates (CTR), and keyword rankings.
Content Management Systems (CMS): Platforms like WordPress often have built-in analytics to assess performance.
Social Media Insights: Analyze shares, comments, and impressions on platforms like Facebook, Twitter, and LinkedIn.
SEO Tools: SEMrush, Ahrefs, and Moz offer backlink and keyword trend analysis, helping identify long-term performance patterns.
Factors Influencing Performance Trends
Several external and internal factors impact how content performs over time:
Algorithm Updates: Search engine algorithm changes can significantly influence traffic patterns. Content optimized for one set of criteria may need adjustments to maintain visibility.
Seasonality: Certain topics naturally ebb and flow in relevance due to seasonal or cyclical trends. For instance, holiday-themed content sees spikes during specific months.
Competitor Actions: The introduction of similar or superior content by competitors can affect performance, necessitating updates to stay competitive.
Content Quality and Format: Visual content, interactive elements, and comprehensive articles tend to perform better over time compared to purely text-based formats.
Content Longevity and Evergreen Potential
Evergreen content holds lasting value, consistently driving traffic and engagement. Analyzing its performance offers unique insights:
Update Frequency: Regularly updating evergreen content ensures its continued relevance.
Search Trends: Aligning content with persistent search queries prolongs its utility.
Cross-Promotion: Repurposing evergreen pieces in newsletters or social posts maintains visibility.
Example: A detailed “how-to” guide on a common topic can continuously attract readers, provided it’s updated to reflect the latest practices and tools.
Revitalization Strategy:
Keyword Research: Identify current search trends and integrate updated keywords.
Content Enrichment: Add new sections, images, or videos to enhance value.
SEO Optimization: Update meta tags, headers, and internal links.
Promotion: Share the refreshed content on social platforms and through email campaigns.
After implementing these changes, monitor performance for improvements in traffic, engagement, and conversions.
Longitudinal Trends: What to Look For
Identifying patterns over time enables strategic decision-making. Focus on:
Peaks and Valleys: Determine what causes traffic spikes and drops. For instance, algorithm updates or promotional campaigns might explain trends.
Conversion Trends: Does your content’s ability to convert improve with age? Analyze which pieces continue to drive results long after publication.
Audience Preferences: Track how user behavior evolves, including preferred formats (videos, infographics, blogs) and topics.
Leveraging Insights for Future Content
By understanding past performance, you can craft strategies for future success:
Content Repurposing: Transform high-performing blogs into videos, podcasts, or infographics to reach wider audiences.
Topic Expansion: Dive deeper into popular topics by creating series or supplementary content.
Content Clusters: Build interlinked clusters around cornerstone pieces to boost authority and search visibility.
Challenges and How to Overcome Them
Data Overload: Filtering the most relevant metrics from a sea of data can be daunting. Solution: Focus on KPIs tied to specific goals.
Interpreting Trends: Correlating performance dips with specific actions isn’t always straightforward. Solution: Use annotations in analytics tools to track changes and campaigns.
Resource Constraints: Regular updates and analysis require time and effort. Solution: Automate routine tasks with tools and prioritize high-impact updates.
Chapter 1: Understanding Page Views & Average Duration
The first module helps in showcasing the number of “Page Views” & “Average Duration” of your website within the last 28 days.
For instance, we have taken our own website Thatware.co as an example. Here’s what we got:
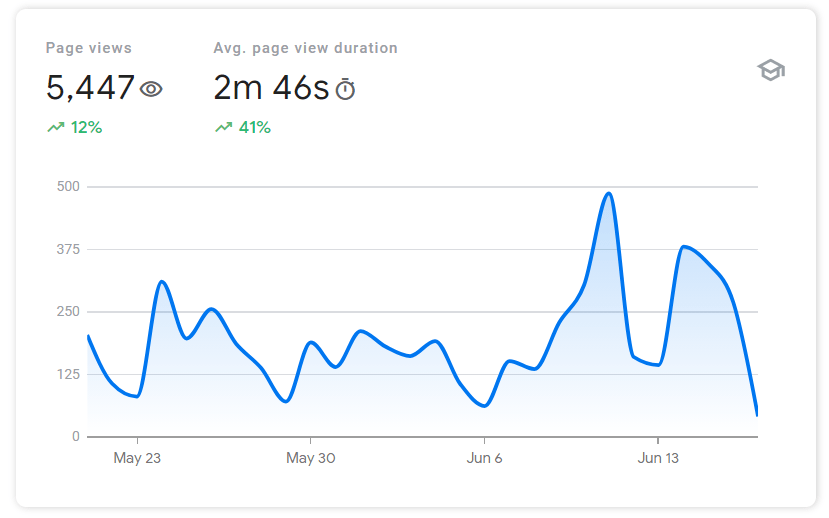
Interpretation from the above image: By visualizing the above data, we can interpret the following outcome:
- The number of people who viewed the website is 5447 (the data is collected based on the last 28 days record and traffic source is Organic).
- There has been a 12% increase in the page view compared to its previous period. In this image, it’s May vs June 2021.
- The average duration of the current state is 2m 46s and it has increased by 41% compared to its previous period.
Conclusion of Chapter 1:
- Looking at the data, we can say that user engagement has improved by 41% compared to the previous month since the average time spent has increased by the said amount.
- The organic pages per session have also improved 12% since the overall pageviews have improved by the said amount.
- The above data’s can be benchmarked for the upcoming month which can help us to make sure we are on a right track!
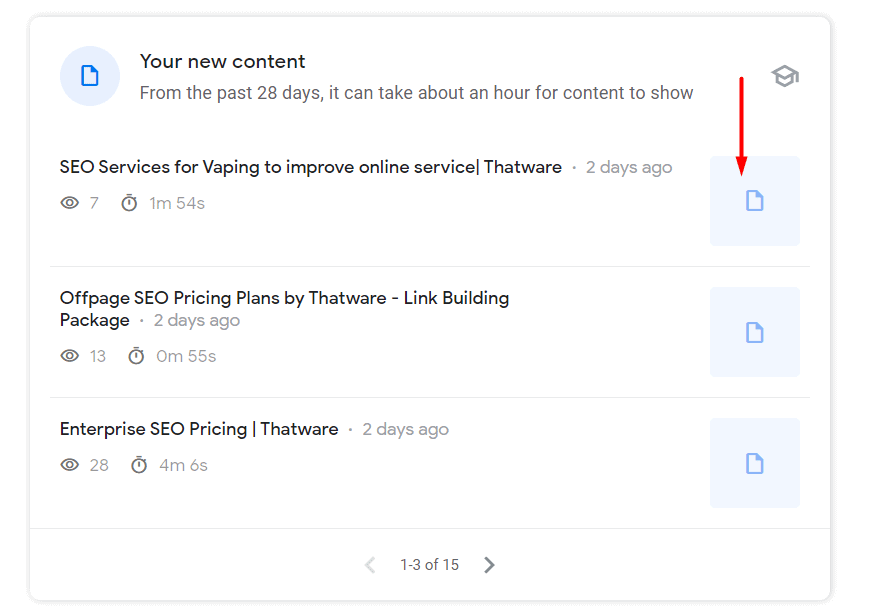
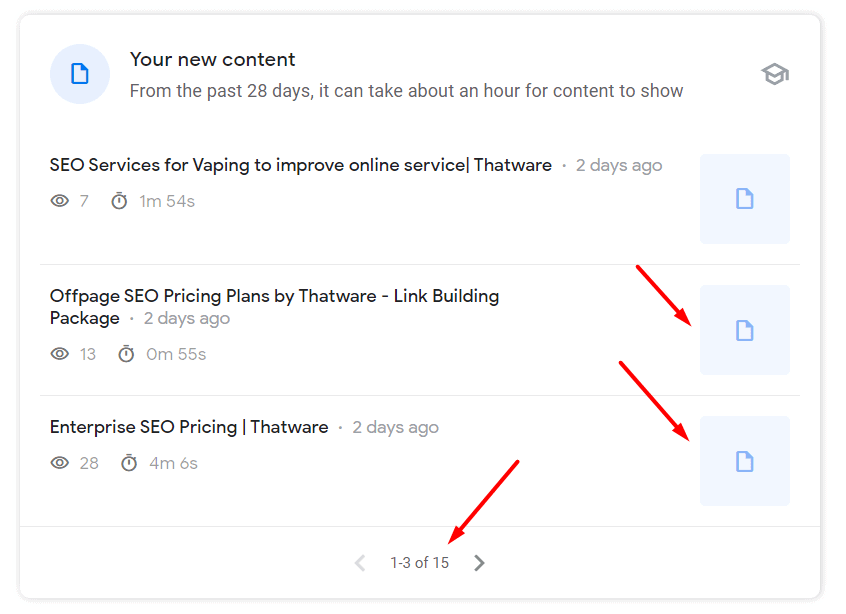
Chapter 2: New Contents
The second module will showcase the new contents within your website. In our example, we have attached our real-time example as shown in the image below. The following metrics are kept in mind when the functionality looks for the new contents:
- The number of views
- The average time spent on the article
- Content Freshness
- Correlation of traffic sources
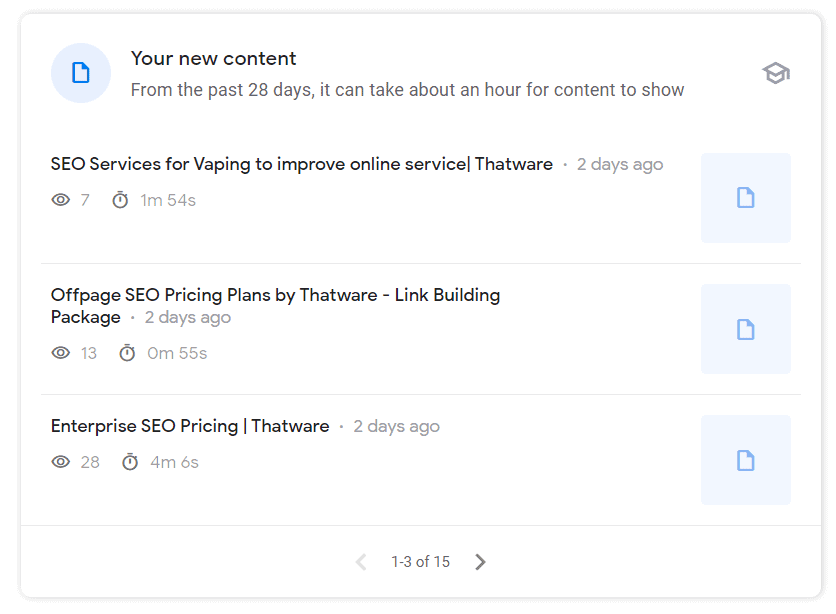
Interpretation from the above image: Basically the above image showcases the new contents based on the metrics as described above. If you further click on any one of the content, it will provide additional insights. Click on any one of your content as shown below.
Once you click, as shown above, you will get additional insights. The first insight which you will receive is the information of the pageview which that particular content received along with the information of the average time spent duration. The image is shown as under:
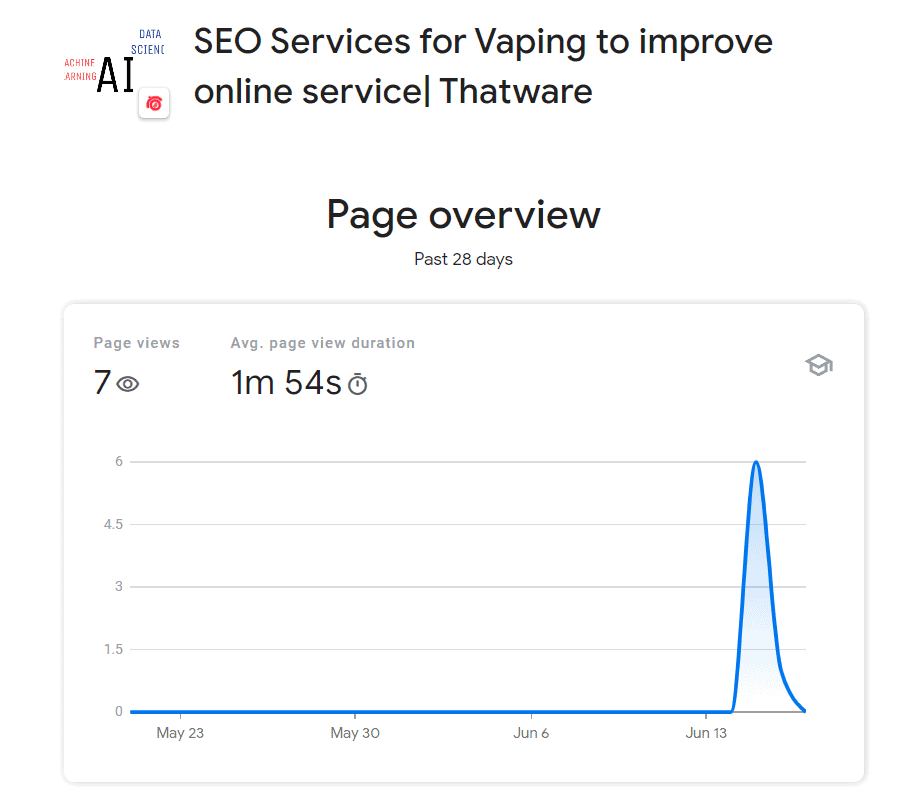
The above image shows us that there were 7 page views on this content and the average time spent is 1m 54s. Now as you scroll down, the next thing which you will find is the sources by which people found your content. The image is shown as under:
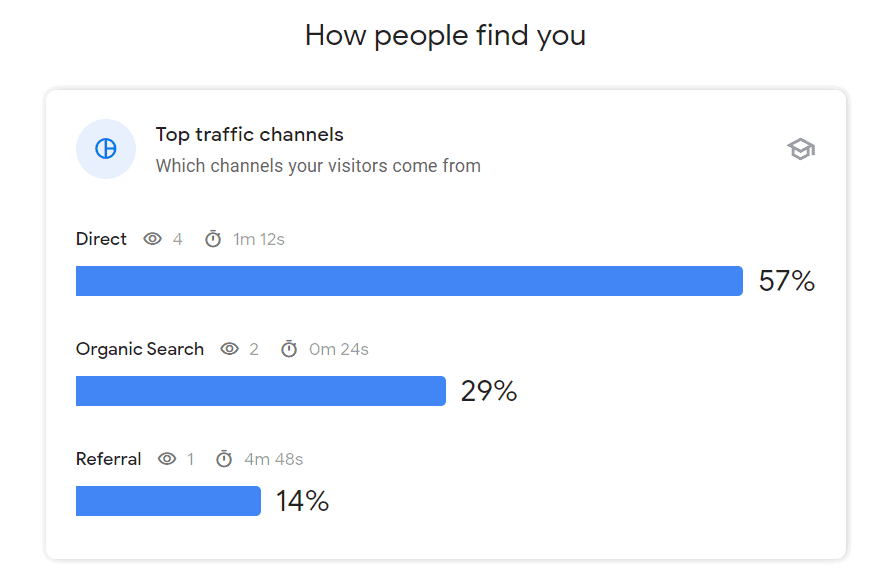
The above image will show you the different sources which will help you in understanding by which means the traffic came on that landing page. As per our example above, 57% of the traffic came from Direct Channel and 29% from Organic Search and 14% from Referral Sources. As you scroll down, you will find the next section which showcases the backlinks which contributed to the traffic and referring domain along with that you will also be able to check whether any traffic came from any social media platform or not. The image is shown as under:
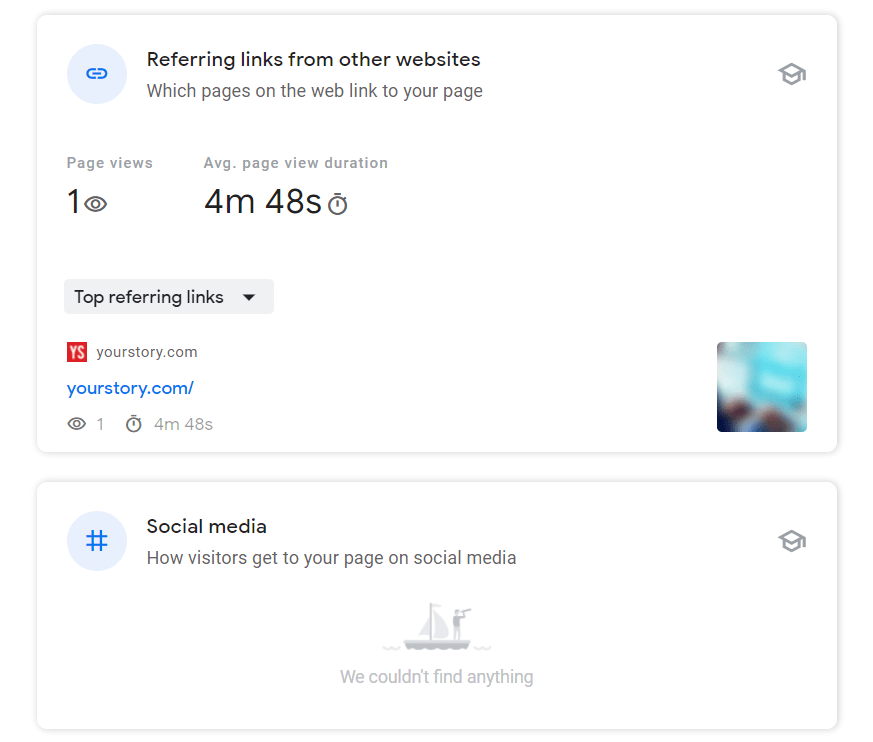
By looking at the above image, we can say that a backlink from YourStory has contributed to bringing some traffic to the content and also there is no Social Media attention on this content.
NOW REPEAT THE ABOVE PROCESS FOR ALL THE CONTENT’s as shown below:
Conclusion of Chapter 2:
- With the help of this module, we can create a list of all the top-performing contents on excel.
- After that, we call pull of all the valuable data such as the backlinks which contributed to the growth and the social platforms which help with the boost. We can put all the data side by side.
- Once we have all the data, then we can use the data to improve the SEO of the overall website. In other words, we can use the top-performing contents as an internal link asset to other YMYL pages. Also, we can use the backlinks on other important pages as well.
Chapter 3: Popular Contents
This is the section that will showcase the most top-performing and popular contents within the website. Some of the metrics take into consideration are as under:
- Highest Page-views
- A good number of backlink sources
- Oldest pages
- Good Bounce rates
- Content Trend with time
The image is provided as under:
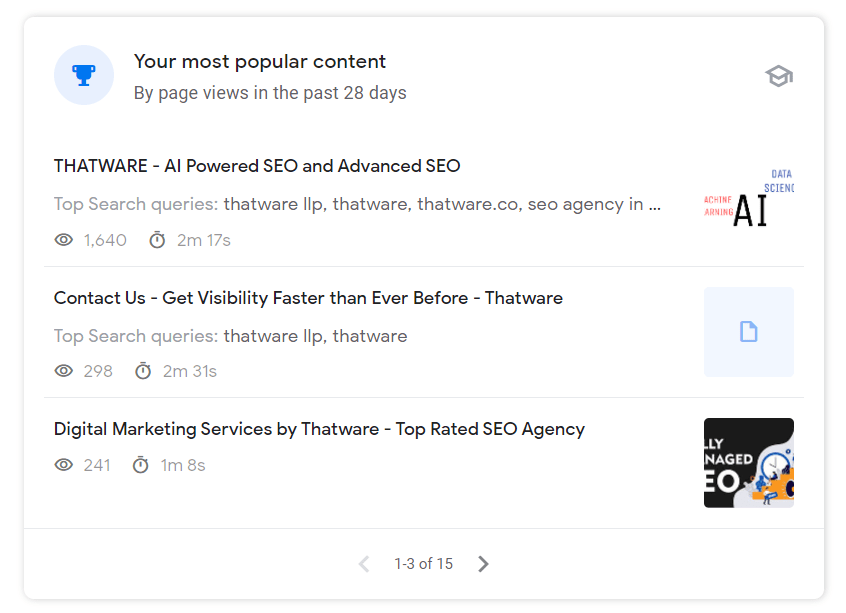
Interpretation from the above image: Basically the above image will showcase the list of all the contents which are popular. Also, when further clicked on individual posts, we can get additional insights as under:
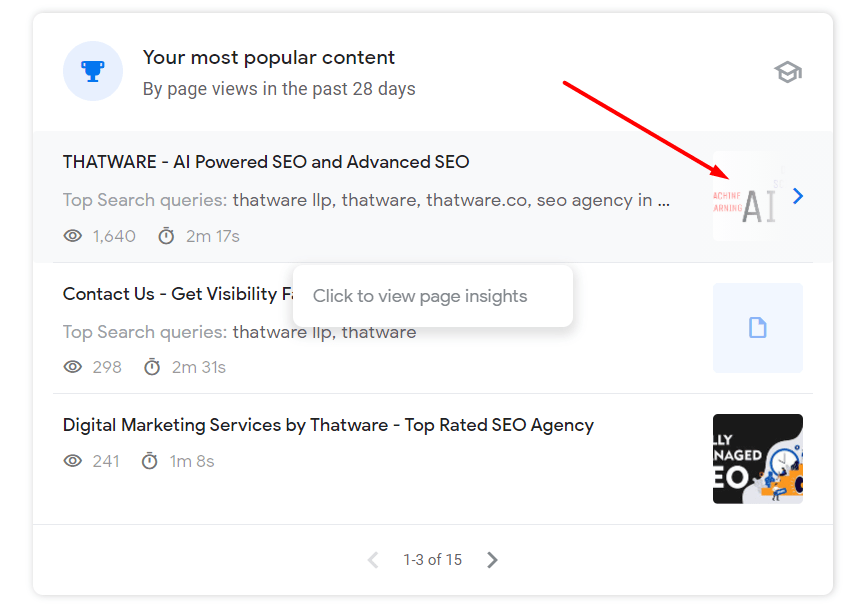
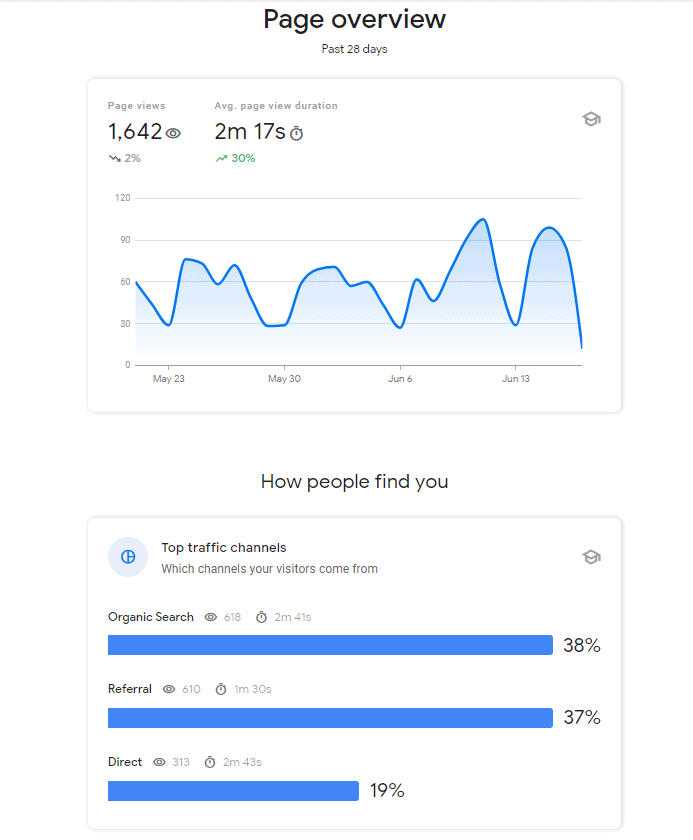
The first two sections which would come up is “Pageview Stats” & “How people find you“. The image has been shown as under. Basically, this will showcase the traffic statistics and the sources from which the traffic has been acquired namely Organic, Direct, Referral, etc.
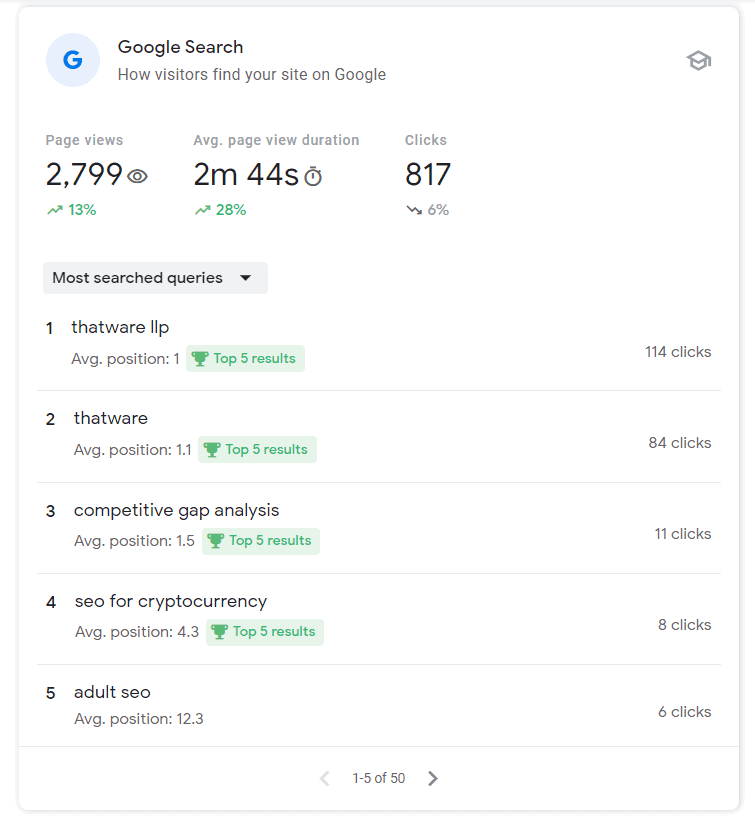
Then the next section which would come is “Google Search“. This is one of the most vital parameters in this entire report. It will showcase the Top Queries which has contributed to the growth of visibility of the particular content. The image is shown as under:
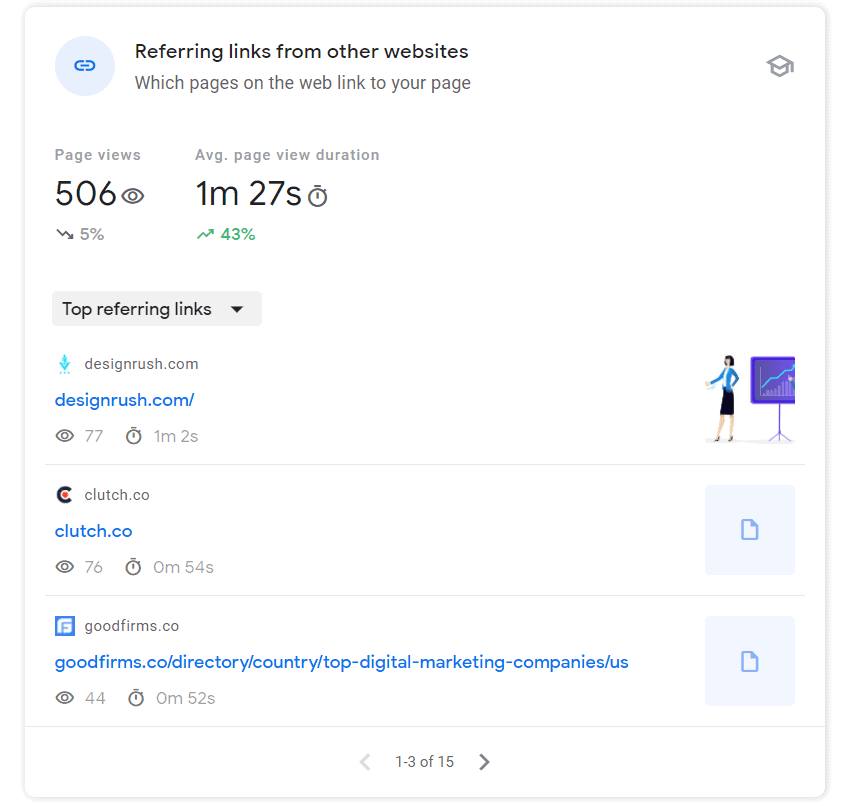
The next section will showcase, the top backlink sources which have contributed to the growth of traffic and visibility for the campaign. The image is shown as under:
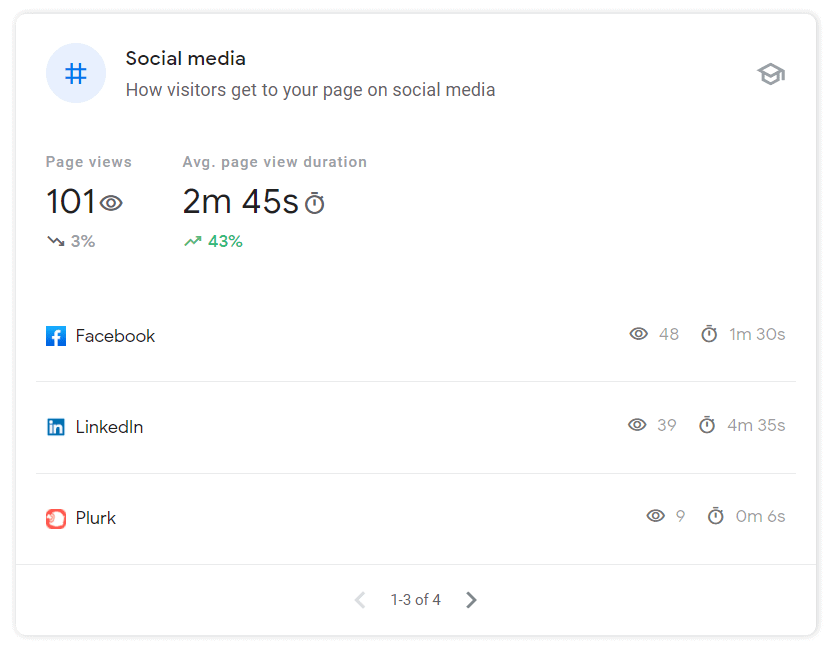
The last section is the Social Media section, which showcases the various social media platforms from where the content got visibility. The image is shown as under:
Conclusion of Chapter 3:
- This module is one of the most vital parameters of all. You can make an excel record of all the popular contents.
- With the help of the above list, one can perform in-link activity from the popular contents as they are rich in link juice.
- Then one can also keep the record of top-performing backlinks and search queries. These queries and backlinks can be reverse engineered to be used on YMYL pages for adding a boost to the SERP visibility and rankings. Moreover, the queries can also be used as a primary source of keywords for further boosting up organic traffic.
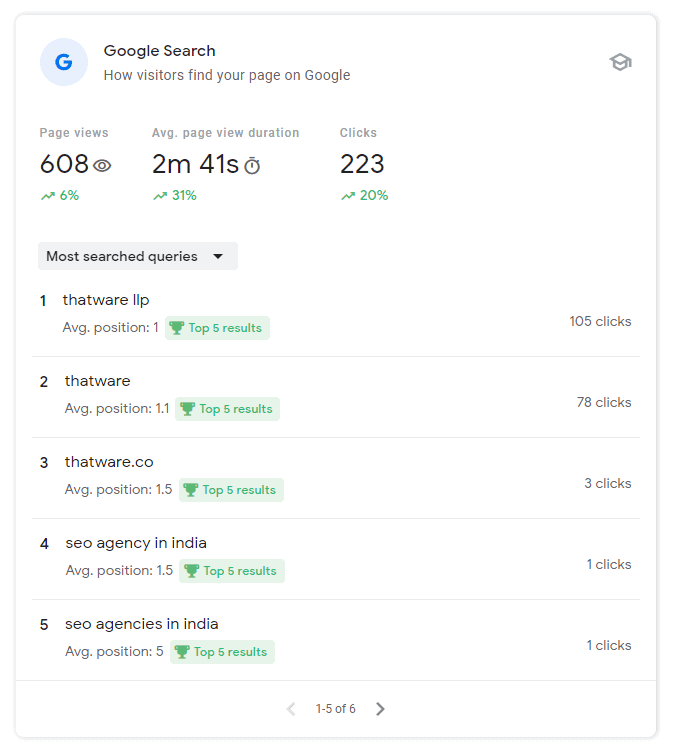
Chapter 4: Google Search
This section will provide highlights of the top search queries which are prevailing with the campaign. The screenshot is as under:
Interpretation from the above image: From the above image, we can filter all the top queries for which the campaign is performing. We can then use those keywords as a part of our ongoing SEO activities to further boost our SEO performances.
Conclusion of Chapter 4:
- Make a list of all the top-performing queries in excel.
- Then use the keywords as a part of ongoing SEO activity which will further boost the SEO performances.
Bonus Tip:
You will also get two additional sections that will show the list of top-performing backlinks and Social Platforms. While you can really have any direct action on this item. But yes, you can definitely monitor the sources of the backlink and use them to target other pages of your website which are important but underperforming. Vice versa goes for social media as well.
Key Takeaways
- Google Search Console Insights can really provide a 360-degree view of all overall content and user-driven information’s and statistics.
- The most intriguing factor of the functionality is that it can help you to find top-performing queries, backlinks and sources of traffic. They can be reverse-engineered and used on YMYL pages to further add value to the SEO effort.
- This feature can also help in keeping proper track of the content and help in the prevention of zombie pages. In other words, by keeping an eye on the top-performing content vs fresh contents, one can constantly monitor the contents which are underperforming. Lastly, by reverse-engineering the underperforming contents can also be improved by building links and optimizing for search queries from the top sources.
