SUPERCHARGE YOUR ONLINE VISIBILITY! CONTACT US AND LET’S ACHIEVE EXCELLENCE TOGETHER!
In today’s digital age, delivering optimal website experiences to users across various network conditions is paramount. Recognizing the significance of performance, ThatWare, a leading digital marketing agency, has employed Google Lighthouse, a benchmark tool for web page quality, to conduct an in-depth analysis of the performance of their website, https://thatware.co/, across a range of network scenarios. In this article, we will delve into the methodology, results, and recommendations arising from this analysis.

Google Lighthouse Performance: Enhancing Website Excellence
Google Lighthouse Performance is a robust, open-source tool developed by Google to evaluate the performance, accessibility, best practices, and search engine optimization (SEO) of web pages. However, in this discussion, we’ll focus specifically on its performance auditing capabilities.
- Comprehensive Performance Metrics: Google Lighthouse provides a comprehensive set of performance metrics that offer insights into various aspects of website speed and responsiveness. These metrics include:
· First Contentful Paint (FCP): Measures the time it takes for the first piece of content to appear on the screen.
· Largest Contentful Paint (LCP): Indicates when the largest content element becomes visible within the viewport.
· Time to Interactive (TTI): Evaluates how long it takes for a page to become fully interactive and responsive to user input.
· Total Blocking Time (TBT): Measures the amount of time during which the main thread is blocked and unable to respond to user input.
· Cumulative Layout Shift (CLS): Quantifies the visual stability of a web page by assessing unexpected layout shifts.
- Realistic User Experience Simulation: One of the key benefits of Google Lighthouse Performance is its ability to simulate real-world user experiences across various network conditions and device types. By emulating different network speeds (e.g., 3G, 4G, or offline) and device characteristics (e.g., desktop or mobile), Lighthouse provides insights into how a website performs under diverse circumstances. This simulation enables website owners and developers to identify performance bottlenecks and optimize their sites for a wide range of users.
- Objective Performance Evaluation: Google Lighthouse Performance offers an objective and standardized framework for evaluating website performance. It generates detailed reports that highlight areas of improvement and provide actionable recommendations for optimization. By adhering to industry best practices and benchmarks, website owners can ensure that their sites meet the highest performance standards set by Google and other leading organizations.
Now, let’s discuss why Google Lighthouse Performance is necessary:
- User Experience Enhancement: In today’s fast-paced digital environment, users expect websites to load quickly and provide seamless interactions. Slow-loading pages or unresponsive interfaces can lead to frustration and abandonment, ultimately affecting user satisfaction and retention. By leveraging Google Lighthouse Performance, website owners can identify performance issues and take proactive measures to enhance the overall user experience.
- SEO Optimization: Website performance is a crucial factor in search engine optimization (SEO) rankings. Search engines like Google prioritize fast and responsive websites in their search results, as they are more likely to deliver a positive user experience. By improving performance metrics such as page speed and interactivity, website owners can boost their SEO rankings and attract more organic traffic to their sites.
- Competitive Advantage: In a competitive digital landscape, superior website performance can serve as a competitive differentiator. Websites that load quickly, provide smooth navigation, and deliver a seamless user experience are more likely to stand out from the competition and attract and retain customers. By leveraging Google Lighthouse Performance to optimize their sites, businesses can gain a competitive edge and enhance their online presence.
Benefits of Google Lighthouse Performance
Google Lighthouse Performance stands as a beacon of insight and improvement in the vast sea of web development and optimization. Its multifaceted approach to assessing website performance offers a multitude of benefits to website owners, developers, and users alike. Let’s illuminate the key benefits of Google Lighthouse Performance:
1) Comprehensive Performance Evaluation:
Google Lighthouse provides a holistic assessment of website performance, covering various aspects such as loading speed, interactivity, visual stability, and more. By evaluating multiple performance metrics, Lighthouse offers a comprehensive view of a website’s strengths and areas for improvement.
2) Actionable Insights and Recommendations:
One of the most valuable aspects of Google Lighthouse Performance is its ability to provide actionable insights and recommendations. After conducting an audit, Lighthouse generates detailed reports that highlight specific performance issues and offer practical recommendations for optimization. These insights empower website owners and developers to make informed decisions and implement targeted improvements to enhance website performance.
3) Real-World User Experience Simulation:
Google Lighthouse allows users to simulate real-world browsing conditions, including various network speeds and device types. By emulating different network conditions (such as 3G, 4G, or offline) and device characteristics (desktop or mobile), Lighthouse provides insights into how a website performs in diverse scenarios. This simulation enables developers to identify performance bottlenecks and optimize their sites to deliver a seamless user experience across different platforms and devices.
4) SEO Optimization:
Website performance plays a crucial role in search engine optimization (SEO) rankings. Search engines like Google prioritize fast-loading and responsive websites in their search results, as they tend to provide a better user experience. By improving performance metrics such as page speed and interactivity, website owners can enhance their SEO rankings and attract more organic traffic to their sites.
5) Enhanced User Experience:
Improved website performance directly translates to a better user experience. Websites that load quickly, respond smoothly to user interactions, and maintain visual stability are more likely to engage and retain users. By leveraging Google Lighthouse Performance to optimize their sites, website owners can create a positive user experience that fosters user satisfaction, loyalty, and engagement.
6) Competitive Advantage:
In today’s competitive digital landscape, superior website performance can serve as a significant competitive advantage. Websites that deliver fast loading times, seamless navigation, and optimal user experiences are more likely to stand out from the competition and attract and retain customers. By optimizing their sites with Google Lighthouse Performance, businesses can gain a competitive edge and enhance their online presence.
Methodology
Website Under Test: https://thatware.co/ Tools Used: Google Lighthouse, JavaScript, and Python.
Procedure:
- Data Gathering: To initiate the analysis, a tailored JavaScript code was utilized for data collection. Google Lighthouse was used to measure various performance metrics, providing valuable insights into the website’s behavior under different network conditions.
- Data Processing and Visualization: The collected data was then processed and visualized using a Python script. Graphical representations were generated to facilitate a straightforward comparison of performance across various network types.
Results
Lighthouse “Time to Interactive” Scores for Different Networks:
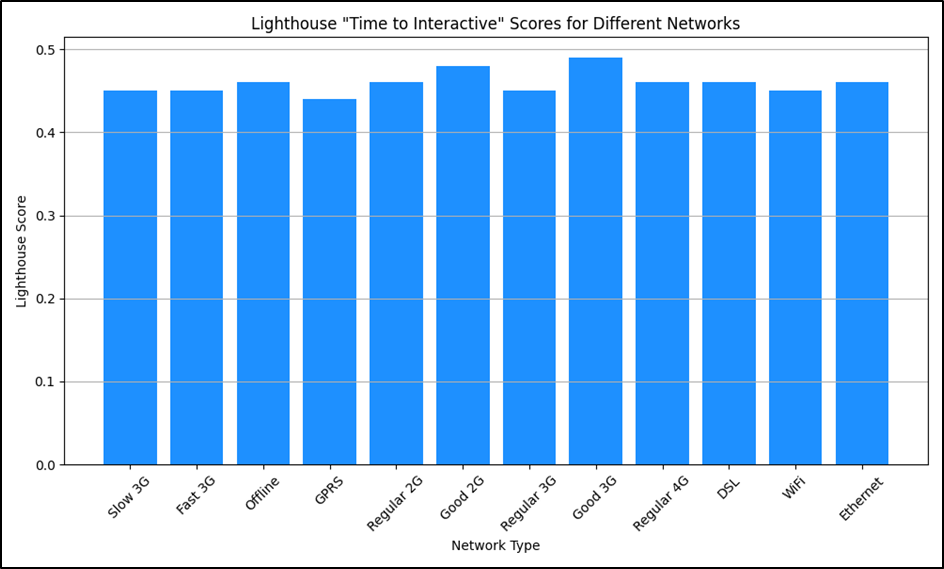
The graph above depicts the “Time to Interactive” scores for the website across diverse network conditions. This metric is crucial as it measures the time it takes for a web page to become fully interactive, ensuring a smoother user experience. A superior score indicates enhanced performance, signifying a quicker transition to interactivity for users.
Average Dataset Values for Different Networks:
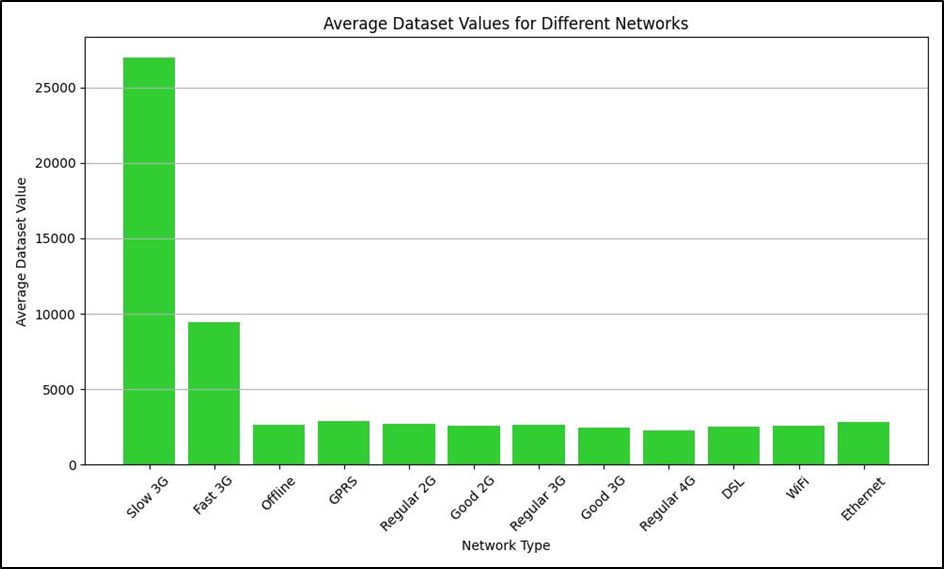
The graph above illustrates the mean page loading time (in milliseconds) for the website across different network types. This provides insights into the variance in page loading speed values based on the network condition. Lower values indicate better page loading performance for various networks.
Conclusion and Recommendations
Based on the detailed analysis conducted by ThatWare, several conclusions and recommendations emerge:
1. Commendable Performance on Faster Networks:
The website, https://thatware.co/, exhibits commendable performance on faster networks, as evidenced by the high “Time to Interactive” scores. This implies that users with access to robust network connections can enjoy a smooth and responsive browsing experience on the site.
2. Room for Improvement on Slower Networks:
However, the analysis also reveals room for improvement, particularly on slower networks such as “Slow 3G.” Websites should aim to deliver a satisfactory user experience across a wide range of network conditions, as users from diverse geographical locations with varying network capabilities might access the website.
Recommendations for Improvement:
To address the observed performance disparities across different network conditions, ThatWare offers the following recommendations:
1. Optimize Media:
Compress and lazy-load images, videos, and other media elements to reduce initial loading times. This optimization is especially crucial for slower networks, where large media files can significantly impact page load times.
2. Minimize JavaScript:
Reduce or defer non-essential JavaScript operations, ensuring that the website becomes interactive sooner. Overly complex JavaScript can be a major bottleneck in achieving a rapid “Time to Interactive.”
3. Caching:
Implement robust caching strategies to cache assets and decrease load times for returning users. Effective caching can significantly enhance website performance by reducing server requests and load times.
4. Content Delivery Network (CDN):
Employ a Content Delivery Network (CDN) to serve website content from servers closest to the users. CDNs optimize the response time by reducing the physical distance data needs to travel, resulting in faster loading speeds for users worldwide.
In conclusion, optimizing website performance across diverse network conditions is a critical aspect of providing a seamless user experience and improving SEO rankings. ThatWare’s analysis of their website, https://thatware.co/, showcases the importance of addressing performance disparities among various network types. By implementing the recommended improvements, businesses and website owners can ensure consistent, high-quality user experiences regardless of their users’ network conditions, ultimately leading to greater user satisfaction and improved website performance.
