Get a Customized Website SEO Audit and Online Marketing Strategy and Action Plan
This project is designed to assist website owners, marketers, and SEO specialists in gaining a deeper understanding of their website content and enhancing its performance on search engines like Google. By examining the content of a website, this project leverages advanced technology to reveal hidden patterns, relationships, and areas that need improvement. It is called a “Dynamic Conceptual Graphs Model” because it generates a visual graph showing how different words and ideas (concepts) within the website are interconnected.

What is this project trying to do?
- Understand Website Content:
- Websites contain a wide range of content, including blogs, service pages, and product descriptions. This content must be clear, relevant, and structured effectively to rank well on search engines.
- This project breaks down the website’s text into smaller components to identify key concepts (like “SEO,” “user experience,” “keywords”) and understand how these concepts relate to each other.
- Find Relationships Between Words:
- The project determines which words or ideas frequently appear together across your content. For instance:
- “Google” and “page” may appear together often because the content discusses optimizing pages for Google.
- “User” and “experience” may appear together because the content emphasizes enhancing user experience.
- These relationships are valuable because they reveal whether your website covers the right topics or overlooks critical areas.
- Improve SEO and Content Strategy:
- After mapping the relationships and key concepts, the project provides recommendations to enhance your content.
- For example, if vital topics like “conversion” or “ranking” are missing or underrepresented, the system will flag them as areas that need attention.
- Visualize the Content as a Graph:
- The project produces a conceptual graph, serving as a visual map of how concepts are linked.
- Each word or concept acts as a “node,” and the connections between them are “edges.” This graph allows you to clearly see the structure and interconnections of your content.
How does it help website owners or businesses?
- Improves SEO Performance:
- SEO (Search Engine Optimization) ensures your website ranks higher on search engines. This project identifies areas in your content that need enhancement for better visibility on Google or other search engines.
- For example, if the graph shows “keywords” are weakly connected to other concepts, it may indicate your content lacks sufficient keyword integration.
- Better User Experience:
- By analyzing how users navigate your website and what information they seek, you can craft content that is more useful, engaging, and relevant.
- Saves Time and Effort:
- Manually reviewing all your content to find gaps can be time-consuming. This project automates the process, analyzing hundreds of pages in minutes and providing clear insights.
- Actionable Recommendations:
The project not only analyzes but also suggests next steps. For example:
- Add more content about “user satisfaction” if it’s missing.
- Focus on creating stronger links between “strategy” and “ranking.”
- Data-Driven Decisions:
- Instead of relying on assumptions, this project uses actual website data to guide your content strategy effectively.
Who can benefit from this project?
- Website Owners: To ensure their website content is fully optimized for search engines.
- Marketers and SEO Experts: To gain insights into improving search rankings.
- Content Creators: To understand which topics or keywords need focus.
- Businesses: To attract more visitors by enhancing content quality and relevance.
Key Features of the Project
- Sitemap Parsing:
- The project begins by reading a website’s sitemap (listing all URLs).
- It separates URLs into webpage URLs and non-webpage URLs (like images or videos).
- Web Content Scraping:
- The project collects text content from each page using tools like Python with BeautifulSoup and Selenium.
- It extracts key information such as titles, meta descriptions, and main content.
- Data Cleaning:
- Before analysis, the project removes unnecessary elements like stop words, special characters, or irrelevant text.
- It leverages NLP (Natural Language Processing) to distill content into its most meaningful components.
- Building Conceptual Graphs:
- Using NetworkX (a graph-building tool), the project creates a visual representation of how concepts are linked.
- For example, it might show “strategy” connected to “Google” and “user,” while “conversion” may be missing.
- Generating Recommendations:
- The project offers actionable advice to enhance content. For example:
- Include more content on underrepresented topics.
- Strengthen connections between key terms.
- Visualization:
- The conceptual graph is displayed using tools like Matplotlib, making it simple to interpret and understand relationships between concepts.
Why is this project important?
- SEO is Vital for Success:
- In today’s digital age, most people discover businesses online. If your website isn’t search engine optimized, you risk losing valuable customers. This project helps identify and fix issues in your content.
- Actionable and Automated:
- It doesn’t just analyze your content; it provides a clear, step-by-step plan for improvement.
- Insights Beyond Manual Review:
- Hidden relationships between concepts, missing topics, and weak areas in content are difficult to detect without such tools.
- Maintains Competitive Edge:
- With countless websites vying for attention, this project ensures your content remains visible and stands out.
1. What Are Conceptual Graphs?
Conceptual Graphs are a way to represent knowledge as a visual graph structure. Think of them as a diagram that helps us understand relationships between ideas, objects, or concepts.
Key Elements:
- Nodes: Represent concepts (e.g., “user,” “website,” “product”).
- Edges/Links: Show relationships between concepts (e.g., “User BUYS Product,” “Website HAS Page”).
Purpose:
- To visually and logically organize information in a way that humans and machines can understand.
2. Use Cases
General Use Cases:
- Representing knowledge in artificial intelligence (AI) systems.
- Simplifying complex relationships in data for better decision-making.
- Supporting natural language processing (NLP) tasks like summarization, sentiment analysis, etc.
Real-Life Implementations:
- Search Engines: Improving query understanding by analyzing relationships between concepts (e.g., “What is the nearest restaurant?”).
- Chatbots: Enhancing response quality by linking concepts (e.g., “order status,” “delivery date”).
- E-commerce: Recommending products based on user interests and interactions.
3. Use Cases for Websites
For a website, Conceptual Graphs can be used to:
1. Organize Website Content:
- Map out relationships between pages, topics, and user needs.
- Example: “Home Page LINKS TO Product Page.”
2. Improve Search Functionality:
- Understand user queries by representing them as graphs.
- Example: “User SEARCHES FOR Product” → Show relevant pages.
3. Personalized Recommendations:
- Suggest content/products based on user behavior.
- Example: “User VIEWED Article” → “Recommend Related Articles.”
4. Content Analysis:
- Preprocess website content (like text or metadata) to extract and connect concepts.
4. What Input Does the Model Need?
The input depends on the purpose of the Conceptual Graphs:
· Webpage Content (URLs):
- If you need to analyze the text on webpages, the model may require URLs to scrape and process the content.
· Structured Data (CSV/JSON):
- If you already have website data (e.g., product details, user actions, page relationships), this can be provided in structured formats like CSV or JSON.
· Unstructured Data (Text Files):
- For analyzing content or generating insights, unstructured text data might be processed.
5. What Output Is Provided?
Conceptual Graphs provide structured outputs that visually and logically represent relationships.
For websites, this could be:
- A Visual Graph: Showing links between concepts (e.g., user paths, page connections).
- Data Insights: Summarized knowledge like top relationships or frequent user actions.
- Recommendations: Suggested actions, such as “highlight these products” or “improve content here.”
Step-by-Step Workflow for Your Website Project
1. Determine Input Type:
- If your project requires analyzing website content, you might need to provide the URLs of web pages.
- If you already have data about your website in CSV or JSON format, that might be sufficient.
2. Preprocessing:
- The model processes input data (e.g., extracting keywords, understanding context, or building connections).
3. Building Conceptual Graphs:
- Nodes represent the website’s concepts (e.g., pages, users, products).
- Links/edges show relationships (e.g., “User VISITS Page,” “Page LINKS TO Page”).
4. Output:
- A graph structure showing relationships between website components.
- Actionable insights (e.g., which pages are most visited, which products to promote).
Conceptual Graph for a Website
· Input:
Website pages and their relationships (could be from a sitemap or CSV file).
· Graph Output:
A graph showing:
- “Homepage LINKS TO Product Page.”
- “Product Page LINKS TO Checkout Page.”
- “User CLICKS ON Product Page.”
· Insights:
- Identify weak links (pages without connections).
- Highlight popular pages.
- Recommend changes for better navigation.
Why Are Conceptual Graphs Useful?
They:
- Help organize complex information.
- Simplify decision-making by showing logical relationships.
- Allow machines to interpret and act on data intelligently.

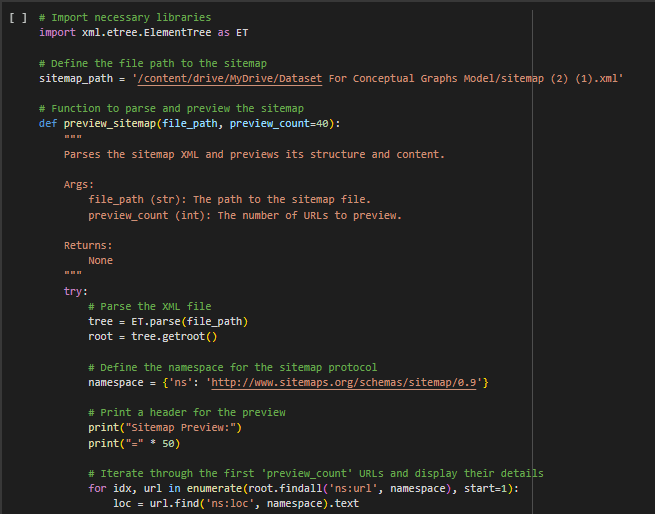
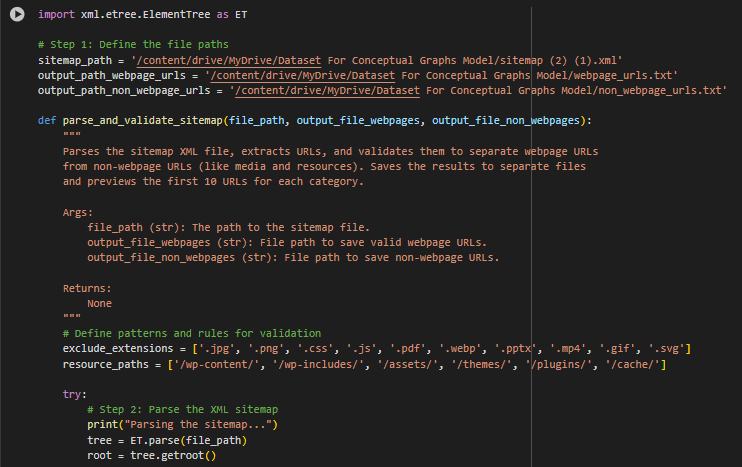
1. First Part: Parsing and Validating the Sitemap
Purpose: This part processes an XML sitemap file to extract and filter URLs. It separates webpage URLs (valid pages) from non-webpage URLs (resources like images, PDFs, etc.).
Main Functionality:
- File Paths: Specifies where the sitemap is located and where the filtered URLs will be saved.
- XML Parsing: Reads and processes the sitemap file to extract all URLs.
- Validation Rules:
- Excludes URLs with certain file extensions (.jpg, .png, etc.).
- Filters out resource paths like /wp-content/.
- Checks if the URL points to a valid webpage (not just a file).
- Output:
- Saves valid webpage URLs to one file and non-webpage URLs to another.
- Previews the results by displaying a few filtered URLs.
Part Name: Sitemap Parser and Validator

Output Breakdown
Step 1: Parsing the sitemap…
· What this means: The program is reading a sitemap file (usually sitemap.xml) from the website, which contains a list of all the URLs available on that website.
· Use case: This step helps the program extract all URLs from the sitemap for further processing, like filtering, categorizing, or scraping content.
Step 2: Validating and filtering URLs…
· What this means: The program checks the extracted URLs and categorizes them into two types:
- Webpage URLs: URLs that represent actual web pages (e.g., blog posts, services, product pages).
- Non-Webpage URLs: URLs that represent assets like images, documents, or stylesheets, which are not meaningful for the analysis.
· Use case: This step ensures only relevant URLs (webpages) are kept for analysis. For instance, an image URL (like https://thatware.co/wp-content/uploads/…) won’t provide meaningful textual content, so it’s excluded.
Step 3: Saving 191 webpage URLs to /webpage_urls.txt
· What this means: Out of all the URLs parsed from the sitemap, 191 URLs were identified as valid webpage URLs, and these were saved into a file called webpage_urls.txt.
· Use case: Saving webpage URLs into a file ensures they can be used for further analysis, such as scraping their content or building a conceptual graph.
Step 4: Saving 189 non-webpage URLs to /non_webpage_urls.txt
· What this means: The remaining 189 URLs that were identified as non-webpage URLs (like stylesheets, images, etc.) were saved separately into a file called non_webpage_urls.txt.
· Use case: Separating non-webpage URLs is useful to avoid processing unnecessary data. It keeps the analysis focused on content-rich URLs.
Step 5: Filtered Results
· What this means: The results of the filtering process are summarized:
- Total Webpage URLs: 191 → These are the content-rich pages that will be analyzed.
- Total Non-Webpage URLs Excluded: 189 → These are irrelevant assets like images or stylesheets that were excluded.
· Use case: This summary gives you a clear idea of how many pages will be processed and how many were filtered out. It ensures you are working with the right data.
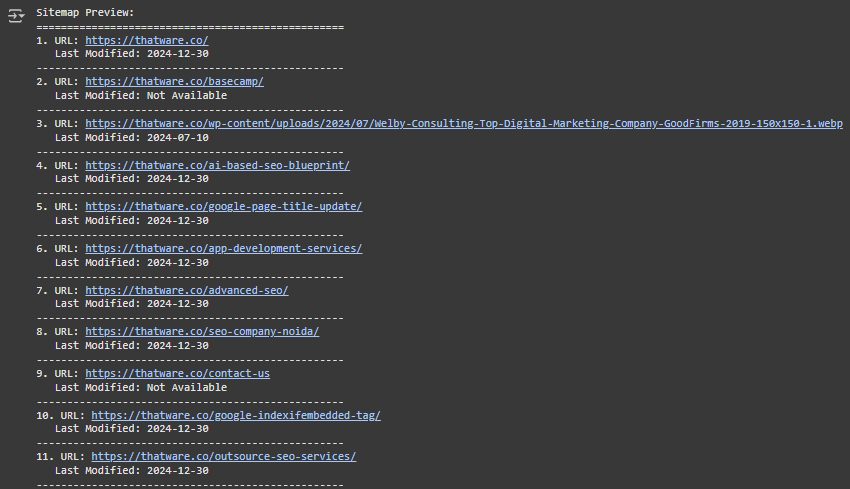
Step 6: Webpage URLs (Preview)
Examples of webpage URLs:
- https://thatware.co/ai-based-seo-blueprint/
- https://thatware.co/google-page-title-update/
- https://thatware.co/digital-marketing-services/
· What this means: These are the URLs of actual webpages extracted from the sitemap. These URLs represent blog posts, service descriptions, or other content-heavy pages that will undergo further processing (e.g., scraping or building conceptual graphs).
· Use case: These URLs will likely be used for tasks like extracting textual content, analyzing keywords, or generating recommendations for SEO improvements.
Step 7: Non-Webpage URLs Excluded (Preview)
Examples of non-webpage URLs:
- https://thatware.co/wp-content/uploads/2023/12/coachepreneur.webp
- https://thatware.co/wp-content/uploads/2020/11/cora.pptx
- https://thatware.co/wp-content/themes/rife-free/css/style.css
· What this means: These URLs represent non-content resources like images, documents (e.g., .pptx files), and stylesheets. These were excluded because they don’t provide meaningful textual content for analysis.
· Use case: By excluding such URLs, the program avoids wasting time and resources on analyzing non-relevant data.
Summary of the Output
This output represents the URL filtering process performed on a sitemap:
- The program parsed the sitemap to extract all available URLs.
- It categorized URLs into webpage URLs (for analysis) and non-webpage URLs (excluded).
- It saved the results into two separate files for clarity:
- webpage_urls.txt → Contains URLs of content-rich pages.
- non_webpage_urls.txt → Contains URLs of non-content resources.
Use Case of This Output
1. Preparation for Content Analysis:
- The 191 webpage URLs will be used for tasks like scraping text, building conceptual graphs, or generating SEO recommendations.
2. Data Segregation:
- Separating webpage URLs from non-webpage URLs ensures the analysis is focused and efficient.
3. Transparency:
- The summary allows you to verify the accuracy of the filtering process and gives insight into how many URLs will be processed.
Understanding the Workflow
- The program first parses the sitemap to extract all URLs.
- It validates and filters these URLs into two categories: content-rich pages and irrelevant assets.
- The filtered results are saved in separate files, making them ready for the next step (e.g., content scraping or analysis).
This step is crucial because working with irrelevant URLs (like images or stylesheets) would waste computational resources and lead to poor analysis results.
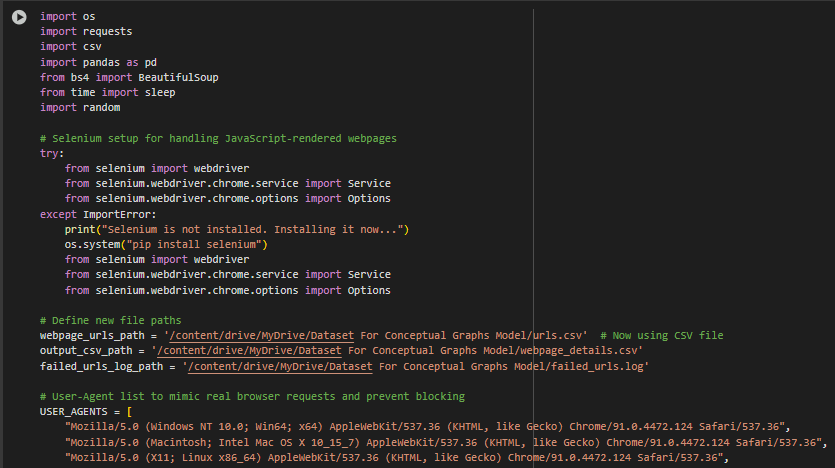
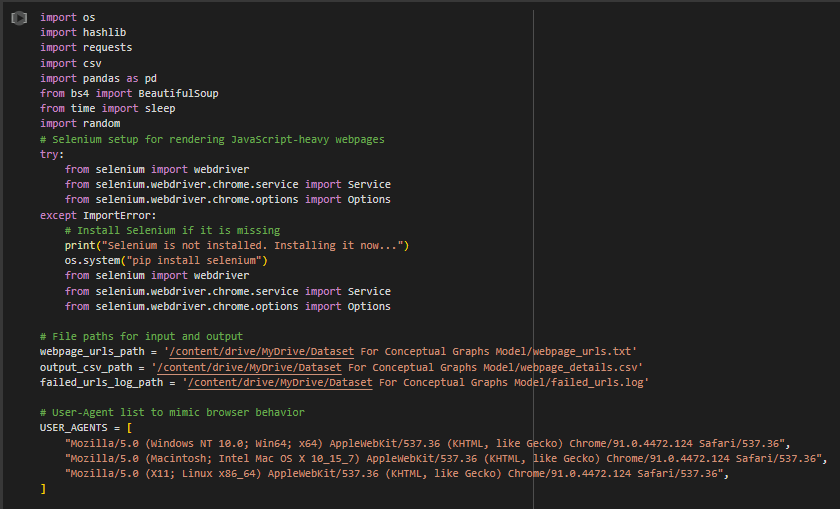
2. Second Part: Scraping Webpage Details
Purpose: This part takes the filtered webpage URLs and extracts their content (title, description, paragraphs, links) using two methods:
- Requests + BeautifulSoup: Simple HTTP scraping for lightweight pages.
- Selenium: Advanced scraping for pages requiring JavaScript rendering.
Main Functionality:
- Read URLs: Reads the webpage URLs from the output of Part 1.
- User-Agent Rotation: Mimics browser behavior to avoid detection by websites.
- Scraping Methods:
- Requests: Uses BeautifulSoup to scrape HTML content for basic pages.
- Selenium: Automates a browser for rendering and scraping JavaScript-heavy pages.
- Extracted Data:
- Title: The webpage’s title.
- Meta Description: A short description from the webpage’s meta tags.
- Content: Text from the webpage.
- Internal and External Links: Links categorized as belonging to the website (internal) or external.
- Output:
- Saves the extracted details to a CSV file for further processing.
- Logs URLs that failed to scrape for debugging.
Part Name: Webpage Content Scraper
Step-by-Step Explanation
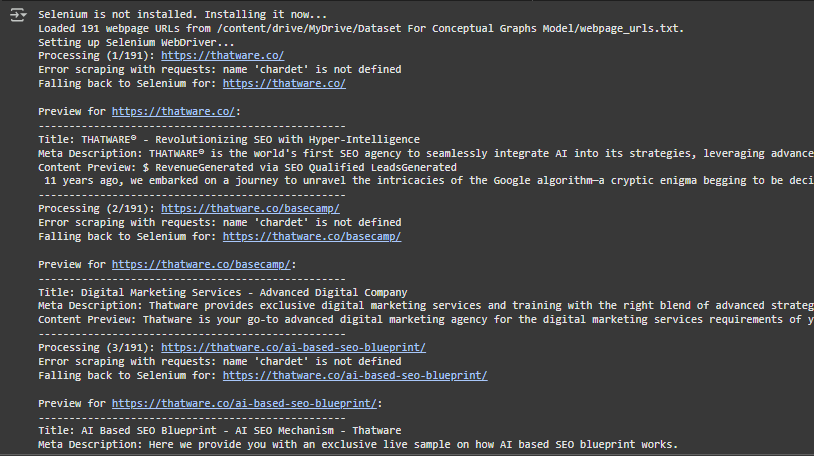
Step 1: Selenium is not installed. Installing it now…
· What this means: The program is checking for Selenium (a tool to control web browsers). It realizes Selenium is missing, so it installs it automatically to ensure that the scraping process can proceed.
· Why this is important: Selenium is used here as a backup method to scrape web pages when other methods (like requests) fail. Ensuring it is installed is necessary for the scraping process to run smoothly.
Step 2: Loaded 191 webpage URLs from /webpage_urls.txt.
· What this means: The program has read the list of 191 webpage URLs (from the previous filtering step) and loaded them into memory. These URLs represent pages that will be scraped for content.
· Why this is important: Without this step, the program wouldn’t know which URLs to scrape. This is like preparing a list of tasks before starting work.
Step 3: Setting up Selenium WebDriver…
· What this means: The program sets up Selenium’s WebDriver, a browser automation tool that can open and interact with web pages (e.g., click buttons, load JavaScript).
· Why this is important: Some websites use JavaScript to load content dynamically. Selenium ensures that the program can still scrape these pages when simpler methods like requests fail.
Step 4: Processing (1/191): https://thatware.co/
· What this means: The program starts processing the first URL from the list (https://thatware.co/).
· Why this is important: It indicates that the program is working sequentially, one URL at a time. This ensures that every webpage gets scraped systematically.
Step 5: Error scraping with requests: name ‘chardet’ is not defined
· What this means: The program tries to scrape the page using the requests library but encounters an error (chardet is missing). chardet is a library used for encoding detection.
· Why this is important: This shows that the primary scraping method (requests) failed. Without a fallback method, this would have caused the scraping process to stop.
Step 6: Falling back to Selenium for: https://thatware.co/
· What this means: Since requests failed, the program switches to using Selenium to scrape the webpage.
· Why this is important: This ensures the scraping process continues, even if the primary method fails. Selenium can handle complex websites better than requests.
Step 7: Preview for https://thatware.co/
· What this means: After scraping the webpage, the program provides a summary of its findings:
- Title: The page’s title (THATWARE® – Revolutionizing SEO with Hyper-Intelligence).
- Meta Description: The brief description of the page for search engines (THATWARE® is the world’s first SEO agency to seamlessly integrate AI into its strategies…).
- Content Preview: A snippet of the page’s textual content (RevenueGenerated via SEO…).
· Why this is important: This preview gives a quick overview of the key information extracted from the page. It helps verify that the scraping process is working correctly.
Step 8: Processing continues for URLs 2/191 to 191/191
· What this means: The program repeats the same steps for all the remaining URLs in the list, scraping each one and providing a preview.
· Why this is important: It ensures all webpages are processed, and their data is extracted for further analysis.
Step 9: Scraped data saved to /webpage_details.csv.
· What this means: After processing all URLs, the program saves the extracted data (titles, meta descriptions, content previews, etc.) into a CSV file for later use.
· Why this is important: The CSV file acts as a structured database of the scraped information. This can be used for analysis, building conceptual graphs, or generating recommendations.
Step 10: Failed URLs logged at /failed_urls.log.
· What this means: The program keeps track of any URLs that couldn’t be scraped (e.g., due to errors or access restrictions) and saves them in a log file.
· Why this is important: This ensures transparency by identifying which URLs failed. You can revisit these URLs later to debug the issue or try scraping them again.
Key Points to Understand
1. Primary vs. Fallback Methods:
- The program first tries to use the lightweight requests library for scraping.
- If requests fails (e.g., due to missing libraries or JavaScript-heavy content), it falls back to Selenium, which can handle dynamic content.
2. Data Preview:
- For every webpage, the program extracts and previews key data:
- Title: The title of the page (important for SEO and user understanding).
- Meta Description: A brief summary of the page’s purpose.
- Content Preview: A snippet of the page’s main content.
3. Data Storage:
- All successfully scraped data is saved in a CSV file (webpage_details.csv).
- Failed URLs are logged separately (failed_urls.log), allowing you to focus on resolving issues with those pages later.
Use Case of This Output
1. Content Analysis:
- The scraped data can be analyzed to identify trends, gaps, or opportunities in the website’s content.
2. SEO Improvements:
- Titles and meta descriptions can be evaluated to ensure they are optimized for search engines.
3. Error Management:
- The log of failed URLs ensures no page is overlooked, allowing for targeted troubleshooting.
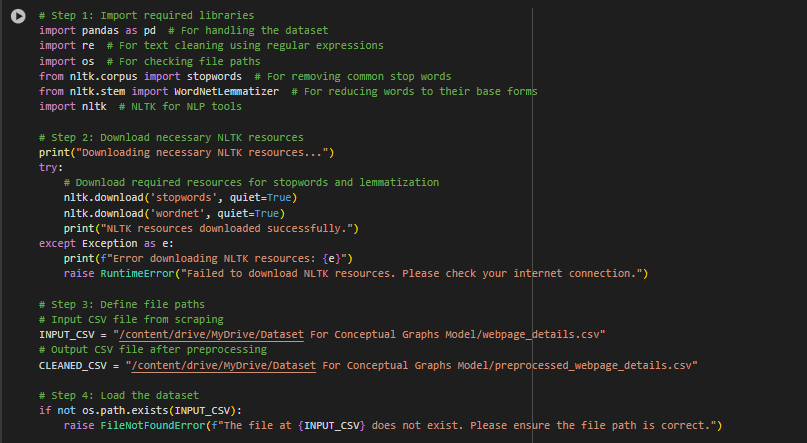
3. Third Part: Preprocessing Webpage Content
Purpose: Cleans and processes the scraped data to prepare it for building the conceptual graph.
Main Functionality:
- Load Dataset: Reads the CSV file from Part 2.
- Text Cleaning:
- Removes special characters, punctuation, and stopwords (common words like “and,” “the”).
- Converts text to lowercase for uniformity.
- Uses lemmatization to reduce words to their base forms (e.g., “running” → “run”).
- Link Cleaning:
- Splits and standardizes internal and external links.
- Removes duplicates and extra spaces.
- Metadata:
- Adds counts of internal and external links for each webpage.
- Output:
- Saves the cleaned dataset to a new CSV file.
- Provides a preview of the cleaned data.
Part Name: Data Cleaning and Preprocessing
Step-by-Step Explanation of the Output
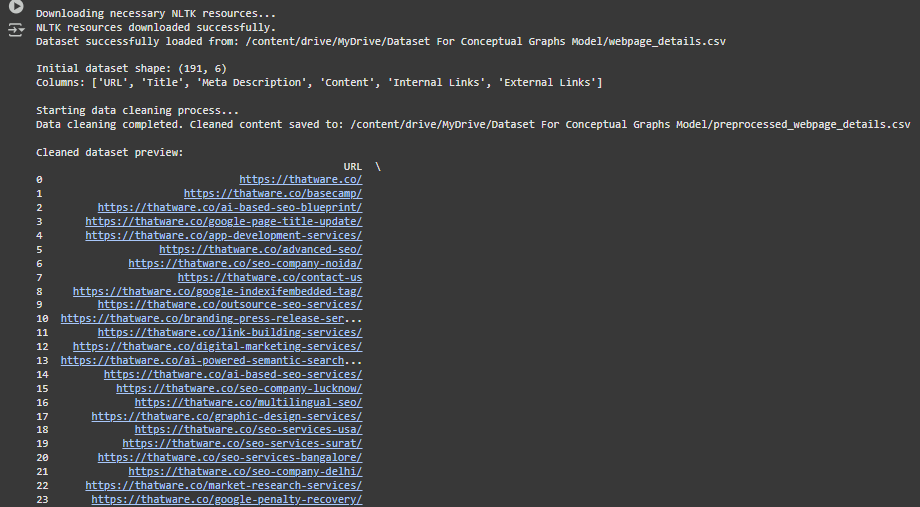
1. Downloading necessary NLTK resources…
- What this means: The program is downloading resources from NLTK (Natural Language Toolkit), a library used for processing text data.
- Why this is important: These resources, such as stopword lists or tokenizers, are essential for cleaning and analyzing the text from the scraped webpage content.
2. NLTK resources downloaded successfully.
- What this means: The required NLTK resources were successfully installed, and the program is ready to proceed with text processing tasks.
3. Dataset successfully loaded from /webpage_details.csv
· What this means: The program has loaded the dataset (extracted from previously scraped webpages) into memory from the CSV file.
· Why this is important: This dataset contains raw information about the webpages, including the URL, Title, Meta Description, Content, and Links. It will serve as the foundation for further cleaning and analysis.
4. Initial dataset shape: (191, 6)
· What this means: The dataset has 191 rows and 6 columns.
- Each row represents a webpage.
- The columns represent:
- URL: The address of the webpage.
- Title: The title of the webpage.
- Meta Description: A summary or description of the webpage’s purpose.
- Content: The main text extracted from the webpage.
- Internal Links: Links within the website (pointing to other pages on the same domain).
- External Links: Links to other websites (outside the domain).
· Why this is important: Knowing the dataset shape helps confirm that all data from 191 webpages was successfully loaded and is ready for processing.
5. Starting data cleaning process…
- What this means: The program has started cleaning the dataset. This involves:
- Removing unnecessary or irrelevant text (e.g., HTML tags, scripts, stopwords).
- Standardizing the text format (e.g., lowercasing, removing duplicates).
- Ensuring the content is ready for further analysis, like building conceptual graphs.
6. Data cleaning completed. Cleaned content saved to /preprocessed_webpage_details.csv
· What this means: The cleaned data has been saved in a new file (preprocessed_webpage_details.csv), which contains processed and refined text.
· Why this is important: Cleaned data is essential for accurate analysis. For example, if there are unnecessary symbols or incomplete content, it could lead to inaccurate results when building graphs or extracting relationships.
7. Cleaned dataset preview
This is a preview of the cleaned dataset. Let’s break it down column by column:
7.1 URL
· What it means: The address of each webpage. For example:
- https://thatware.co/
- https://thatware.co/basecamp/
· Why this is important: The URL uniquely identifies each webpage and allows the user to trace back the content to its source.
7.2 Title
· What it means: The cleaned title of each webpage. For example:
- “thatware revolutionizing seo hyperintelligence”
- “digital marketing service advanced digital company”
· Why this is important: Titles are critical for understanding the primary topic or purpose of the page. They can be used for building conceptual graphs and identifying key topics.
7.3 Meta Description
· What it means: A summary or overview of what the webpage is about. For example:
- “thatware world first seo agency seamlessly integrates ai into its strategies”
- “provide exclusive live sample ai based seo blueprint works”
· Why this is important: Meta descriptions give a concise explanation of the webpage. These descriptions help users (and search engines) quickly understand the page’s content.
7.4 Content
· What it means: The cleaned main text of the webpage. For example:
- “revenuegenerated via seo qualified leadsgenerated 11 years ago we embarked on a journey”
- “thatware goto advanced digital marketing agency for the digital marketing services”
· Why this is important: The main content is the core data extracted from the webpage. It will be used for:
- Text analysis.
- Generating conceptual graphs.
- Understanding relationships between different webpages or topics.
7.5 Internal Links
· What it means: A list of links that point to other pages on the same website. For example:
- [https://thatware.co/reseller-partnership/, https://thatware.co/contact-us]
· Why this is important: Internal links show how pages are connected within the website. These links can reveal the structure of the site and help in creating conceptual graphs.
7.6 External Links
· What it means: A list of links that point to other websites. For example:
- [https://www.facebook.com/thatware, https://www.linkedin.com/company/thatware]
· Why this is important: External links indicate connections to external resources. These links are useful for understanding how the website interacts with the broader internet.
7.7 Num Internal Links
· What it means: The total number of internal links for each webpage. For example:
- 142
- 1
· Why this is important: Pages with many internal links are usually central to the website’s structure. These pages may have more significant content or be more important to the website.
7.8 Num External Links
· What it means: The total number of external links for each webpage. For example:
- 24
- 165
· Why this is important: Pages with many external links may be referencing a lot of outside resources or directing users to other websites.
What One Can Understand from This Output
1. Dataset Structure:
- The dataset contains structured information about 191 webpages, including their titles, meta descriptions, content, and links.
2. Cleaned Content:
- The text has been processed to remove irrelevant information, making it ready for analysis.
3. Link Data:
- The dataset includes details about internal and external links, which can help understand the relationships between pages and other websites.
4. Use Case:
- This cleaned dataset is now ready for tasks like:
- Building conceptual graphs: To visualize connections between topics and pages.
- Generating recommendations: Based on relationships or trends in the data.
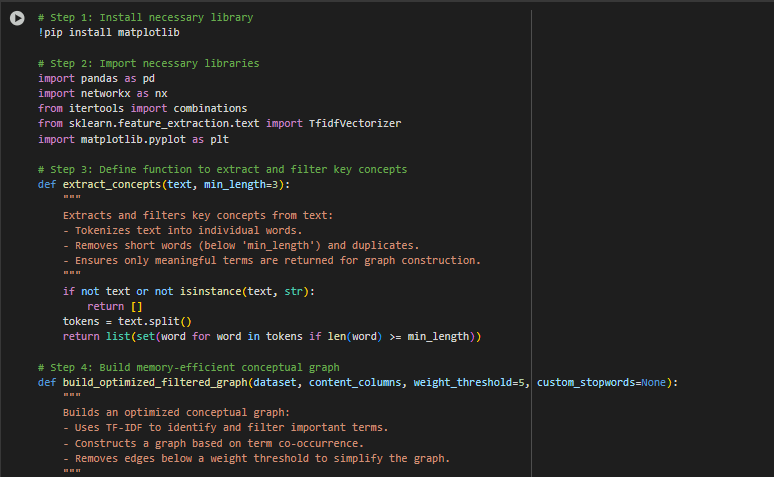
4. Fourth Part: Building the Conceptual Graph
Purpose: Constructs a conceptual graph from the cleaned data. A conceptual graph is a network of key terms (concepts) and their relationships, showing how concepts are connected in the content.
Main Functionality:
- Extract Concepts:
- Identifies key terms from webpage content (e.g., “google,” “strategy”).
- Filters out short, meaningless words like “use” or “new.”
- Graph Construction:
- Builds a graph where:
- Nodes: Represent key terms (concepts).
- Edges: Represent relationships (co-occurrences of terms in the content).
- Assigns weights to edges based on how often the terms co-occur.
- Removes weak edges to simplify the graph.
- Builds a graph where:
- Visualization:
- Draws the graph, showing connections between concepts.
- Uses a spring layout for clear visualization.
Part Name: Conceptual Graph Builder
First, What is the Conceptual Graphs Model?
The Conceptual Graphs Model is used to create a visual and logical representation of relationships between concepts extracted from website content. For example:
- It analyzes the words and topics that frequently occur together in your website content.
- It builds a network of connected terms where the connections (edges) represent how often those terms appear together, and the importance (weight) of the connection shows the strength of the relationship.
Why is this important?
For a website owner, this is essential because it:
- Reveals important concepts: Helps you identify the terms (like “Google,” “user,” “strategy”) that are most important or central to your content.
- Shows connections between terms: Demonstrates how well different ideas are tied together in your content.
- Identifies optimization opportunities: Helps you understand which topics or terms need improvement to make your content more effective and relevant.
Now, What Does This Output Convey?
This output summarizes the analysis performed by the Conceptual Graphs Model and provides actionable insights:
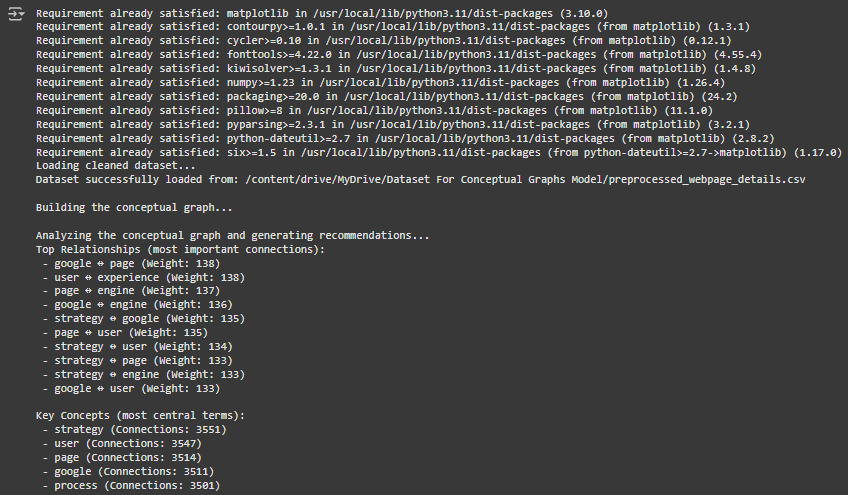
1. Building the Conceptual Graph
· What this step does: The system analyzes the dataset (your website’s content) and identifies key terms and their relationships. It builds a graph where:
- Each node represents a term or keyword (e.g., “Google,” “strategy”).
- Each edge (connection) between nodes represents how often these terms appear together in your content.
- The weight of an edge measures the frequency of co-occurrence of two terms. Higher weights indicate stronger relationships between terms.
· Why this matters: This graph is a map of your content structure. It helps you see which terms are central (important) and how concepts are linked, revealing the overall focus and depth of your website’s content.
2. Top Relationships (Most Important Connections)
This part of the output lists the strongest connections between terms in your content. Let’s break it down:
- What it means:
- For example, the first entry says: google ↔ page (Weight: 138).
- This means the terms “Google” and “page” frequently appear together in the content, with a high relationship strength of 138.
- Similarly, user ↔ experience (Weight: 138) shows that “user” and “experience” often appear together with a strong connection.
- For example, the first entry says: google ↔ page (Weight: 138).
- Why this is important:
- Strong connections indicate which concepts your website emphasizes most.
- For SEO, these relationships can reveal whether your content aligns with your target audience’s search queries and intent.
3. Key Concepts (Most Central Terms)
This section highlights the most central terms in your content based on their number of connections (degree). Let’s break it down:
- What it means:
- For example, strategy (Connections: 3551) shows that the term “strategy” is the most connected keyword in your content, with 3551 connections to other terms.
- Other examples include:
- user (Connections: 3547): Indicates “user” is also highly connected.
- google (Connections: 3511) and engine (Connections: 3464) indicate strong connections around SEO-related terms.
- Why this is important:
- Central terms represent the core topics of your website.
- If these terms align with your business goals or SEO strategy, your content is likely well-optimized. Otherwise, you need to adjust your content to better align with your goals.
4. Suggestions for Improvement
This section provides actionable recommendations based on the conceptual graph analysis. Let’s explain each suggestion:
Suggestion 1: Strengthen underrepresented concepts (low-degree nodes)
- What this means:
- While the report highlights the most central terms, some terms (low-degree nodes) have fewer connections and are underrepresented in your content.
- For example, if a topic like “local SEO” is important to your business but appears infrequently, you should create or improve content around it.
- Why this is important:
- Addressing underrepresented concepts ensures your website covers all relevant topics comprehensively, improving your SEO performance and user engagement.
Suggestion 2: Improve content around terms with significant relationships
- What this means:
- Terms with strong relationships (e.g., google ↔ page) indicate core areas of focus. However, if the content surrounding these terms is weak or outdated, it can harm your website’s performance.
- For example, if the term pair “user ↔ experience” is central but your website lacks detailed content on improving user experience, this is a missed opportunity.
- Why this is important:
- Enhancing content related to strong relationships helps maintain your website’s authority in key areas and ensures users find valuable, relevant information.
How Is This Output Beneficial for SEO?
This output offers clear insights and practical opportunities to enhance your website’s SEO strategy. Here’s why it matters:
- Identifying Core Topics:
- The key concepts section points out the most important themes of your website, helping ensure your content stays aligned with your business objectives and overall SEO direction.
- Optimizing Keyword Relationships:
- The top relationships section shows how effectively your content links related terms, allowing you to evaluate whether your website matches real user search intent.
- Content Gap Analysis:
- The suggestions highlight missing or weakly covered topics, helping you plan content that fills gaps and improves your site’s overall relevance.
- Prioritizing Improvements:
- By concentrating on strong connections and core terms, you can focus on content updates that are most likely to improve SEO performance.
Steps for Website Owners After Receiving This Output
- Focus on Central Concepts:
- Put effort into enhancing or expanding content around core terms like “strategy,” “user,” and “page,” as these represent the most critical topics for your website.
- Strengthen Weak Areas:
- Spot low-degree terms (underrepresented topics) and develop or refresh content to make your website more complete and balanced.
- Align with Search Intent:
- Check that the top relationships (for example, google ↔ page, user ↔ experience) match the search queries and expectations of your target audience.
- Monitor and Update Regularly:
- Run the conceptual graph model again from time to time to track shifts in key concepts and relationships as your content continues to grow and change.
In Brief: What Does This Result Explain?
- The output is a comprehensive review of your website’s content structure, showing:
- Key concepts: The primary themes present within your content.
- Relationships: How closely linked various topics are.
- Suggestions: Areas for enhancement to make your content more effective.
- This helps website owners optimize their content for SEO by:
- Identifying overlooked topics.
- Improving focus on core areas.
- Strengthening content around critical relationships.
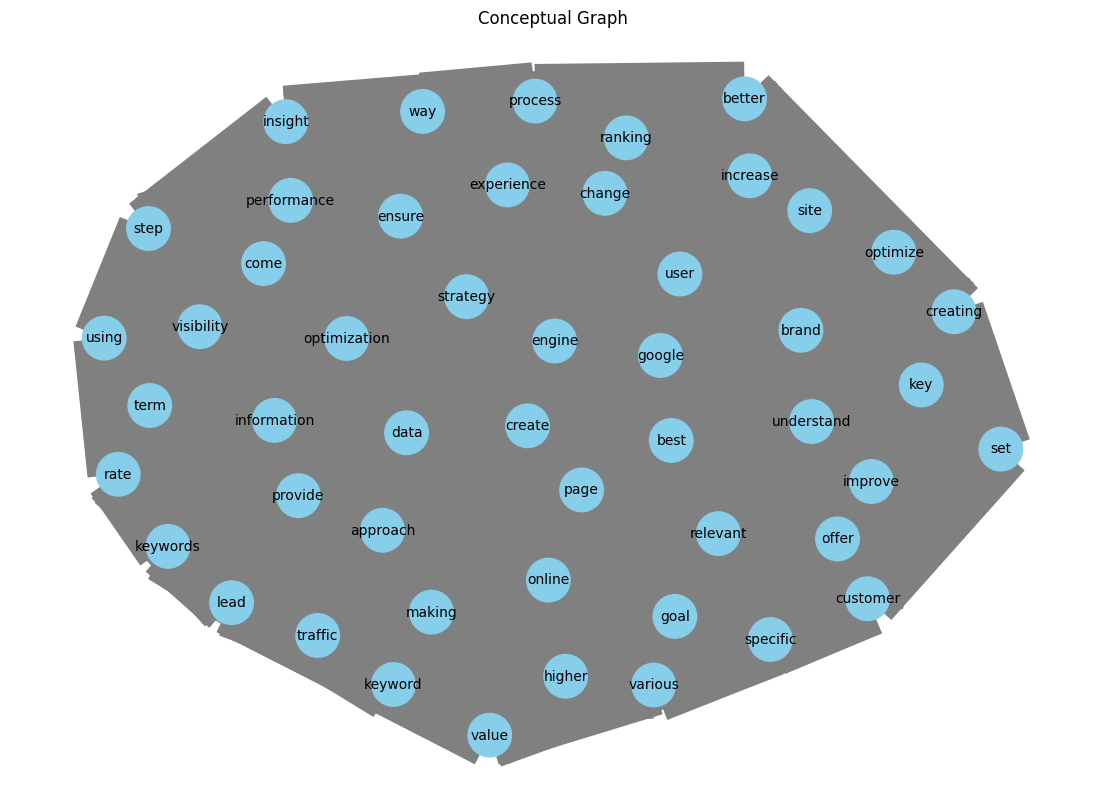
What is a Conceptual Graph?
A conceptual graph is a visual illustration of how terms or concepts in your website content are connected. It shows:
- Nodes: Represent key terms or concepts (e.g., “Google,” “strategy,” “user”).
- Edges: Lines linking the nodes, which show how often these terms appear together in your content.
- Weight/Size: The thickness of edges or the size of nodes can indicate the importance or strength of these connections.
This visualization helps in understanding the content focus of a website, the relationships between topics, and areas for improvement.
Breaking Down the Graph:
1. Nodes (Blue Circles)
- Each blue circle represents an important term extracted from your website’s content.
- Examples from the graph: “Google,” “user,” “strategy,” “optimize,” “experience.”
- Size of the node: Larger nodes indicate terms that are more central to the graph and strongly connected to other terms. For instance, if “strategy” appears as a large node, it shows that “strategy” is a widely discussed concept across your website.
2. Edges (Gray Lines)
- These lines link the nodes and illustrate the relationships between different terms.
- For example, a line connecting “user” and “experience” indicates that these terms frequently appear together within the content.
- Importance of edges: The stronger the connection between two terms, the thicker or more visually prominent the line appears.
3. Structure of the Graph
- The arrangement of the graph positions terms according to how they relate to one another.
- Highly connected nodes (such as “user” or “Google”) tend to appear closer to the center, as they are linked to many other terms.
- Isolated nodes are often pushed toward the edges, representing terms that hold less importance in the overall context.
What Does This Output Convey?
This graph offers us insights into your website’s content:
- Key Content Areas:
- The central terms in the graph (e.g., “strategy,” “Google,” “user”) are the primary topics of your website.
- These are the themes or areas where your website is focused and established.
- Content Gaps or Opportunities:
- Terms that are less connected or on the edges might represent topics that are underdeveloped or poorly integrated into your content.
- For example, if “keywords” or “ranking” is important for your SEO but appears on the edges, it means you should develop more content related to these terms.
- Content Quality:
- Strong relationships between relevant terms (e.g., “user ↔ experience”) indicate well-structured content that is aligned with user expectations.
- If important terms like “Google” and “optimization” have weak connections, it may mean your content isn’t fully explaining how to optimize for Google.
How is This Beneficial for SEO?
This graph is extremely valuable for improving your website’s search engine optimization (SEO):
- Identifying Core Topics:
- The graph highlights which terms are central to your content strategy. For example, “strategy,” “user,” and “Google” are essential terms.
- You can use these insights to ensure your website content aligns with your business objectives and target audience.
- Improving Search Intent Coverage:
- Relationships like “user ↔ experience” indicate that you are addressing user needs. Strengthening these connections ensures your content matches what users are actively searching for.
- Filling Gaps:
- Identify underdeveloped topics (e.g., isolated or small nodes) and create content to cover those gaps.
- This ensures your website comprehensively addresses all relevant topics, which is critical for ranking higher in search results.
- Strengthening Internal Linking:
- The graph can guide you to link related content internally on your website. For example, if “strategy” and “keywords” are related but weakly connected, adding internal links between relevant pages can boost their SEO.
Steps Website Owners Should Take:
After analyzing this graph, here’s what you should do:
1. Strengthen Core Content:
- Focus on creating in-depth content around central terms like “strategy,” “user,” and “Google.”
- For example, write a detailed blog about “SEO strategies for improving user experience.”
2. Fill Gaps in Underdeveloped Topics:
- Identify smaller or less connected nodes (e.g., “traffic,” “specific,” “ranking”) and create or improve content around these terms.
3. Enhance Relationships:
- Build stronger relationships between important terms by:
- Using them together in content (e.g., “optimize Google strategy for user experience”).
- Adding internal links between pages discussing related concepts.
4. Monitor Progress:
- Regularly generate new conceptual graphs to see how your efforts are improving the connections between terms.
Client Explanation
For your client or team, you can explain:
- What the graph shows: It’s a map of how terms on the website are connected and how strong those connections are.
- How it helps: It highlights strengths, weaknesses, and opportunities to improve website content for SEO.
- Steps to take: Focus on central terms, fill gaps in weak areas, and strengthen important connections.
This visualization is an actionable tool to prioritize and improve website content strategically for better search engine ranking and user experience.
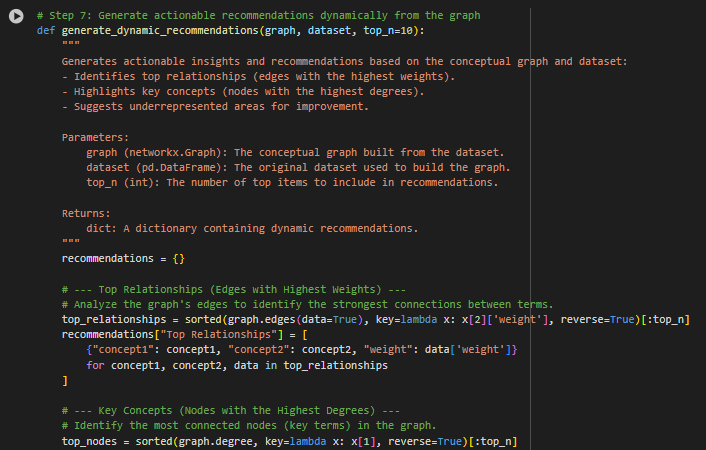
5. Fifth Part: Developing Dynamic Suggestions
Purpose: Explore the abstract graph to generate actionable insights and SEO guidance.
Main Functionality:
- Top Relationships:
- Determines the strongest connections between terms (e.g., “google ↔ page”).
- These illustrate key themes in the content.
- Key Concepts:
- Emphasizes the most central words (e.g., “strategy,” “user”) based on their connections.
- These terms are the pillars of the website’s scope.
- Underrepresented Areas:
- Determines terms with few associations, indicating they need more content or links.
- Dataset Insights:
- Analyzes word commonnesses in the dataset to find the most commonly discussed topics.
- Output:
- Saves the guidance to a JSON file.
- Displays insights for the client to act on.
Part Name: Dynamic SEO Recommendation Generator
Detailed Explanation of the Output
This output shows the findings generated by a Conceptual Graphs Model after examining website content. It delivers clear, actionable insights for SEO (Search Engine Optimization) and content enhancement. Below is a step-by-step explanation of each section, what it represents, and how it adds value for the client.
1. Building the Conceptual Graph
This stage focuses on constructing a graph where:
- Nodes: Represent key terms or concepts identified from the website’s content.
- Edges: Show the relationships or co-occurrence between these terms within the content.
- Weights: Reflect the strength of each relationship, based on how frequently two terms appear together.
2. Dynamic Recommendations
This part of the output provides practical insights derived from the conceptual graph. Each subsection explains a different layer of analysis.
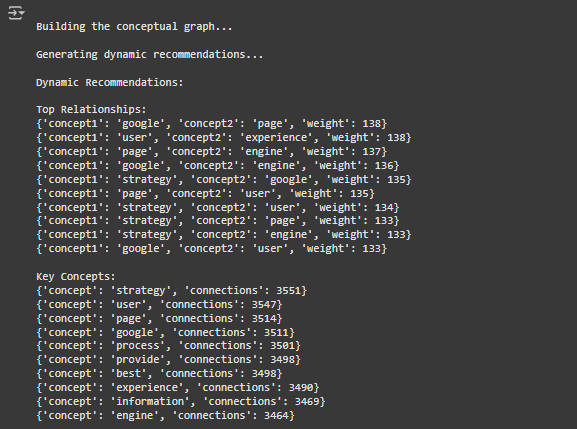
a. Top Relationships
{‘concept1’: ‘google’, ‘concept2’: ‘page’, ‘weight’: 138}
{‘concept1’: ‘user’, ‘concept2’: ‘experience’, ‘weight’: 138}
{‘concept1’: ‘page’, ‘concept2’: ‘engine’, ‘weight’: 137}
…
What it means:
- These entries highlight the strongest connections between concepts on the website. For instance:
- “google ↔ page (Weight: 138)” indicates that the terms “google” and “page” appear together very often, showing a strong conceptual link.
- Such relationships help reveal the main content themes on the site.
Why it matters for SEO:
- It shows which term pairings are already well-established in the content.
- For example, a strong link between “user” and “experience” suggests that the site addresses user experience, an important ranking factor.
Actionable Steps for the Client:
- Review and refine content tied to these strong relationships to ensure quality and clarity.
- Use these insights to improve internal linking, such as connecting pages about “Google” with content related to “pages” or “search engines” to reinforce relevance.
b. Key Concepts
{‘concept’: ‘strategy’, ‘connections’: 3551}
{‘concept’: ‘user’, ‘connections’: 3547}
{‘concept’: ‘page’, ‘connections’: 3514}
…
What it means:
- These are the most influential terms in the content, measured by how many connections they have with other concepts.
- For example, “strategy” with 3551 connections stands out as a dominant theme across the website.
Why it matters for SEO:
- Highly connected concepts signal the primary focus areas of the site. Search engines use this context to judge topical authority and relevance.
- If “strategy” is central, the site may be viewed as a strong source for strategic knowledge.
Actionable Steps for the Client:
- Confirm that these core concepts align with audience intent and SEO objectives.
- Develop pillar pages around them, such as an in-depth resource on “SEO strategy.”
- Strengthen related but weaker terms, like “engine” or “process,” to broaden topic coverage.
c. Suggestions
{‘Focus Areas’: [‘speech’, ‘slowly’, ‘incorrect’, ‘told’, ‘dream’, ‘archive’], ‘Message’: ‘Strengthen underrepresented concepts and improve content for high-weight relationships.’}
What it means:
- The focus areas listed are terms that appear less frequently or have weaker connections within the graph.
They may indicate:
- Missed Opportunities: Relevant topics that are not fully explored.
- Weak Connections: Concepts that exist but are not clearly tied to main themes.
Why it matters for SEO:
- Search engines prefer content that thoroughly covers related topics. If these focus areas matter to your niche, improving them can boost overall relevance and rankings.
Actionable Steps for the Client:
- Expand or refine content around underrepresented terms such as “speech.”
- Link these topics to central concepts using internal links and relevant keywords to strengthen their presence.
3. Dataset Insights
{‘seo’: 20422, ‘service’: 7407, ‘search’: 5668, ‘business’: 5191, ‘content’: 4853, ‘website’: 4569, ‘user’: 3513, ‘thatware’: 3114, ‘strategy’: 3032, ‘engine’: 2811}
What it means:
- This is a frequency overview of the most commonly occurring terms in your dataset.
- For instance, “seo” appears 20,422 times, making it the dominant term across your website.
Why it matters for SEO:
- High-frequency terms reflect the main focus areas of your website. When optimized properly, these terms have better chances of ranking higher in search results.
- If these terms don’t align with your business objectives, your content strategy may require adjustment.
Actionable Steps for the Client:
- Ensure frequently appearing terms like “seo” and “service” match your target keywords.
- Avoid excessive repetition that could lead to keyword stuffing, which negatively affects SEO.
4. Recommendations
Recommendations saved to: conceptual_graph_report.json
What it means:
- All extracted insights, relationships, and recommended actions are compiled into a report file.
Why it matters for SEO:
- This report serves as a reference for future content planning, supporting a data-driven SEO strategy.
Actionable Steps for the Client:
- Review the report to understand focus areas and term relationships.
- Use it to develop a content calendar or SEO plan targeting key concepts and term connections.
How is This Output Beneficial for SEO?
- Identifies Strong and Weak Areas:
- Shows where your content performs well (e.g., “google ↔ page”) and where improvements are needed (e.g., underrepresented terms).
- Guides Content Creation:
- Provides clear areas for new or updated content to enhance SEO outcomes.
- Enhances Internal Linking:
- Offers a plan for linking related pages to strengthen search rankings.
- Improves Search Intent Coverage:
- Ensures your content addresses a broader range of relevant user queries, increasing relevance.
- Supports Data-Driven Decisions:
- Gives insights into which topics and terms drive your website’s SEO performance.
Steps Clients Should Take After This Output
- Content Optimization:
- Enhance existing content around central and highly connected terms like “strategy,” “user,” and “google.”
- Develop new content to cover gaps in underrepresented topics.
- Internal Linking:
- Add links between pages discussing related concepts (e.g., “google” and “engine”).
- Keyword Strategy:
- Align commonly used terms (e.g., “seo,” “service”) with high-priority keywords for your audience.
- Monitor Performance:
- Continuously update and review the conceptual graph to track improvements and refine strategies.
This output acts as a strategic roadmap to elevate your website’s SEO, making it more authoritative and competitive in search rankings.
