What is the seasonality trend of search terms?
The seasonality trend of search terms refers to the regular and predictable pattern of variation in the popularity or search volume of specific keywords or phrases over time. This pattern typically repeats itself within a certain period, such as weekly, monthly, or annually. The concept of seasonality is often associated with certain events, holidays, weather changes, or other factors that influence people’s behaviour and interests at specific times of the year.
We can get search trend data of a particular search term using Google Trends but if we want to get a trend data history of the past five years, then we couldn’t get that forecast from Google Trends.
Factors Influencing Seasonal Search Behavior
Several factors influence seasonal search behavior, leading to fluctuations in search volume throughout the year:
- Holidays: Major holidays such as Christmas, Thanksgiving, Valentine’s Day, and Halloween often trigger specific search queries related to gifts, recipes, decorations, and events.
- Weather Conditions: Weather patterns and seasonal changes can impact search behavior as people search for products and services relevant to the current climate. For example, searches for winter coats, air conditioners, or sunscreen may vary depending on the time of year.
- Cultural Events: Events such as sporting tournaments, festivals, or cultural celebrations can influence search behavior and trigger specific queries related to those events.
- Industry Trends: Certain industries may experience seasonal fluctuations in demand based on trends or seasonal activities. For example, the tourism industry sees increased searches for travel destinations during holiday seasons or vacation periods.
- Changes in Consumer Preferences: Shifts in consumer preferences, lifestyle trends, or purchasing behavior can also contribute to seasonal variations in search terms. For instance, the rise of health and fitness-related resolutions at the beginning of the year can lead to increased searches for gym memberships or healthy recipes.
Importance of Analyzing Historical Data
Analyzing historical data is crucial for understanding seasonal trends in search terms. By examining search volume data over an extended period, marketers can identify recurring patterns, seasonal spikes, and trends in consumer behavior. This historical analysis provides valuable insights informing marketing strategies, content creation, and campaign planning.
Examples of Seasonal Trends
Examples of seasonal trends in search terms include:
- Searches for “gift ideas” or “holiday recipes” spiking around festive seasons like Christmas or Thanksgiving.
- Increased searches for “beach vacations” or “sunscreen” during the summer months.
- There was a rise in searches for “back-to-school supplies” in August as parents and students prepared for the new school year.
- Surge in searches for “spring break destinations” in the months leading up to March.
Practical Applications
Understanding seasonal trends in search terms has practical implications for businesses across various industries:
- E-commerce retailers can optimize product offerings and promotions to align with seasonal demand peaks.
- Travel agencies can adjust their marketing strategies and advertising campaigns to target travelers searching for seasonal destinations.
- Content creators can develop timely and relevant content that resonates with seasonal themes and interests.
- Marketers can allocate resources more effectively by anticipating fluctuations in consumer behavior and adjusting campaign budgets accordingly.
Overall, analyzing seasonal trends in search terms enables businesses to stay ahead of the curve and capitalize on opportunities presented by shifting consumer demand throughout the year.
Tools and Methods for Analyzing Seasonality
Understanding seasonal trends in search terms is essential for marketers to develop effective strategies and capitalize on fluctuations in consumer behavior throughout the year. Fortunately, various tools and methods are available to analyze seasonality and identify recurring patterns in search volume. This section will explore some of the most commonly used tools and methods for analyzing seasonal trends.
Introduction to Tools and Methods for Analyzing Seasonal Trends
Analyzing seasonal trends in search terms requires access to reliable data and effective analytical techniques. Marketers often leverage a combination of tools and methods to gain insights into seasonal patterns and fluctuations in search volume. By understanding when and why certain search terms experience spikes or declines in interest, marketers can tailor their campaigns, content, and promotions to align with seasonal demand.
Overview of Google Trends and Other Keyword Research Tools
Google Trends is one of the most widely used tools for analyzing seasonal trends in search terms. It provides users with access to real-time data on search volume for specific keywords and topics, allowing marketers to track changes in interest over time. Google Trends also offers features such as regional interest, related queries, and trending topics, which can help marketers identify seasonal trends and emerging patterns.
In addition to Google Trends, several other keyword research tools are available that provide insights into seasonal trends and search volume. These tools may offer additional features such as keyword suggestions, competitor analysis, and historical data visualization, making them valuable resources for marketers looking to understand seasonal patterns in search behavior.
Statistical Methods for Identifying Seasonal Patterns
Statistical methods are crucial in identifying and analyzing seasonal patterns in search volume. Time series analysis is a common statistical technique for analyzing sequential data points collected over time. Marketers can identify seasonal patterns, trends, and cycles in search behavior by applying time series analysis to search volume data.
Seasonal decomposition is another statistical method for identifying seasonal patterns in time series data. This technique involves breaking down a time series into its trend, seasonal, and residual components. By isolating the seasonal component, marketers can gain insights into the underlying seasonal patterns and fluctuations in search volume.
Other statistical methods, such as regression analysis and autoregressive integrated moving average (ARIMA) modeling, can also analyze seasonal trends and forecast future search volume. These methods enable marketers to identify relationships between variables, detect patterns in historical data, and make predictions about future search behavior.
Here we have come up with a solution! We have created a custom script of python to analyse the trend data of the past five years and get a forecast report.
Here are the steps to follow:
Step 1: Open Google Colab
Step 2: Insert code cell

Step 3: Type the code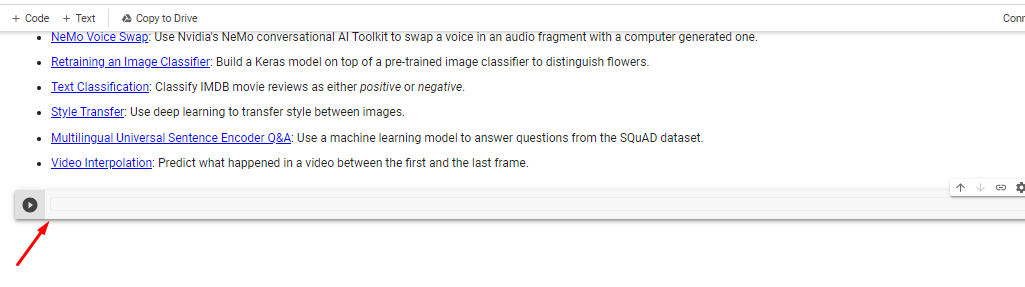
![]()
Install pytrends library by copy pasting the following code and click the on the button:
!pip install pytrends –quiet


Install peakutils library by copy pasting the following code and click the on the button:
!pip install peakutils –quiet

Import peakutils library:
import peakutils
from collections import Counter

Import other important libraries:
import pandas as pd
import numpy as np
import scipy.stats as sp
import matplotlib.pyplot as plt

Define Months of the year variables:
MONTHS = {1:’Jan’, 2:’Feb’, 3:’Mar’, 4:’Apr’, 5:’May’, 6:’Jun’, 7:’Jul’, 8:’Aug’, 9:’Sep’, 10:’Oct’, 11:’Nov’, 12:’Dec’}

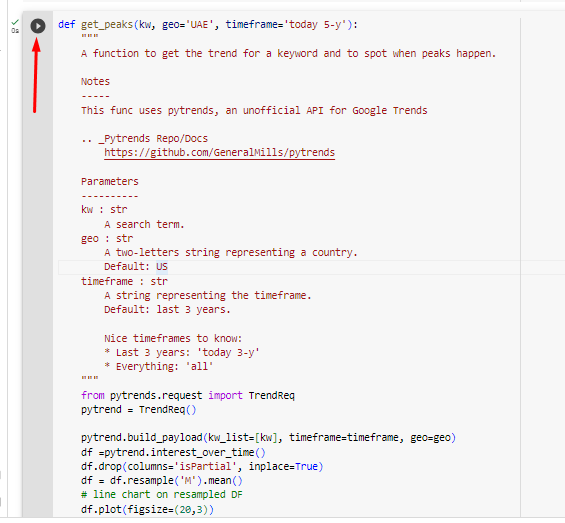
Define get_peaks variable and the parameters:
def get_peaks(kw, geo=’UAE’, timeframe=’today 5-y’):
“””
A function to get the trend for a keyword and to spot when peaks happen.
Notes
—–
This func uses pytrends, an unofficial API for Google Trends
.. _Pytrends Repo/Docs
https://github.com/GeneralMills/pytrends
Parameters
———-
kw : str
A search term.
geo : str
A two-letters string representing a country.
Default: US
timeframe : str
A string representing the timeframe.
Default: last 3 years.
Nice timeframes to know:
* Last 3 years: ‘today 3-y’
* Everything: ‘all’
“””
from pytrends.request import TrendReq
pytrend = TrendReq()
pytrend.build_payload(kw_list=[kw], timeframe=timeframe, geo=geo)
df =pytrend.interest_over_time()
df.drop(columns=’isPartial’, inplace=True)
df = df.resample(‘M’).mean()
# line chart on resampled DF
df.plot(figsize=(20,3))
# bar chart on resampled DF
df.plot.bar(figsize=(20,3))
time_series = df[kw]
cb = np.array(time_series)
indices = peakutils.indexes(cb, thres=0.60, min_dist=0.1)
months = []
for i in indices:
month = time_series.index[i].to_pydatetime().month
val = int(time_series.iloc[i])
months.append(MONTHS[month])
print(“===PEAK MONTHS===”)
sleep=60
print(Counter(months).most_common(3))
#Uncomment the following lines if you want rising queries
#print(“===RISING QUERIES===”)
#print(pytrend.related_queries()[kw][‘rising’])
#Uncomment the following lines if you want top queries
#print(“===TOP QUERIES===”)
#print(pytrend.related_queries()[kw][‘top’])
Step 4: Insert the inputs to the program for getting the results
get_peaks(‘Hardwood flooring installation‘, ‘US‘)

Here is the trend data forecast of past 5 years:

This data is for Hardwood flooring installation this search term, and US location.
This is how we can get the google search trend data forecast(5 years data) of the search terms and analyse the peak of the time when the search volume changes at most.
A simple way to detect if and when a search term reaches a seasonal peak, using Google Trends data.
Practical use cases:
- Decide the best month to update an existing article
- Decide the best month to publish a new article
Here i am giving the colab experimented dashboard where you can just input your search terms to generate the trend data to analyse
Here is the link: https://colab.research.google.com/drive/1PMnoRkAYSGULPjSDTlkAhyj7DhgtTN0V?usp=sharing
Note:
You may find some error while getting data of particular keywords,
For example:
So don’t worry about that, that will occur due unavailability of the data in google trend database. You need to input other form of search term and run the code.
