Get a Customized Website SEO Audit and Online Marketing Strategy and Action
It is widely known that Google Search Console and search Analytics is the most reliable source of data for search performance and technical performance for any website. Its position tracking and live data are more accurate, which makes sense since it’s from Google itself.
However, despite Google rolling out wonderful tools like Search Console and Google Analytics for this data, these tools used in their basic form impose some restrictions, which might be serious for big enough websites. In this post, we will cover the Search Console’s API and how to invoke it using Google Sheets. In this post, we will cover the Search Console’s API and Google data visualization API and invoke it using Google Sheets.
What are the Limitations of Search Console API?
WHAT ARE THE LIMITATIONS OF SEARCH CONSOLE API QUERY?
The Google Search Console, as provided by Google, has issues generating customizable reports and data limits.
For instance, if you hover over the performance reports in Google Analytics, you will find that the query and page sections are available separately.
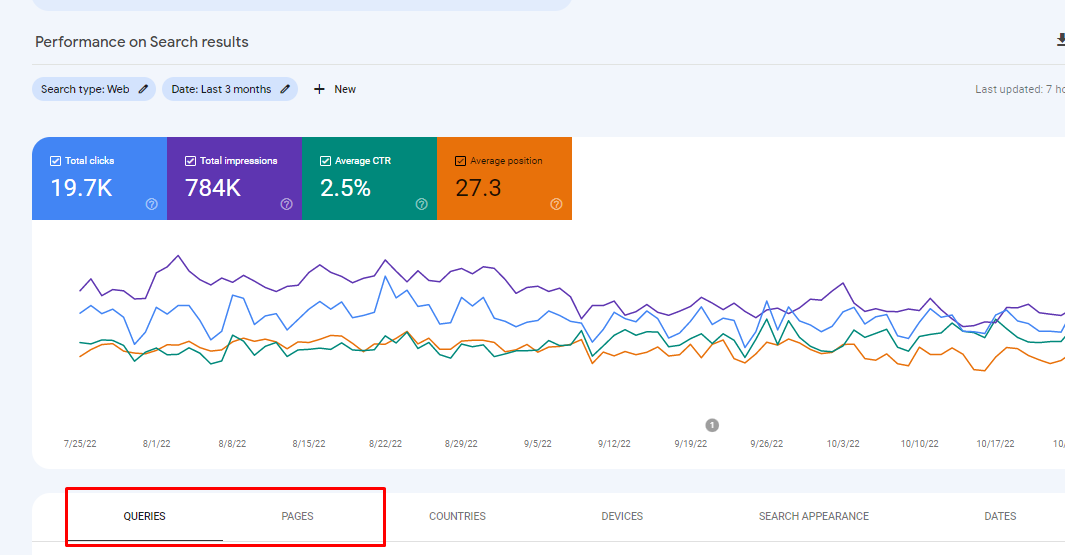
Two other limitations are as follows:
- Individual sections data (eg, Query and Pages) will have to be exported separately.
- All data export limits are capped at 1000 rows only.
What is the Search Console API?
The search console API is a programmable interface provided by Google to get more customized data from Search Console. As mentioned earlier, Search Console, in its base form, gives us access to a limited set of data with zero customizations.
The metrics shown in the previous screenshot only refer to 1000 rows of data. With Search Console API, we can generate 50,000 rows of data. That’s a 50X jump in the amount of data we can gather.
Hence while Search Console can provide us with unique sets of data, Search Console API gives us customization capabilities.
Now let us dive deep into how to set up Google Search Console API and visualize the Data in Google Data Studio.
Setting up the Search Console API
Installing Search Console API
To invoke the Search Console API we have to the following steps.
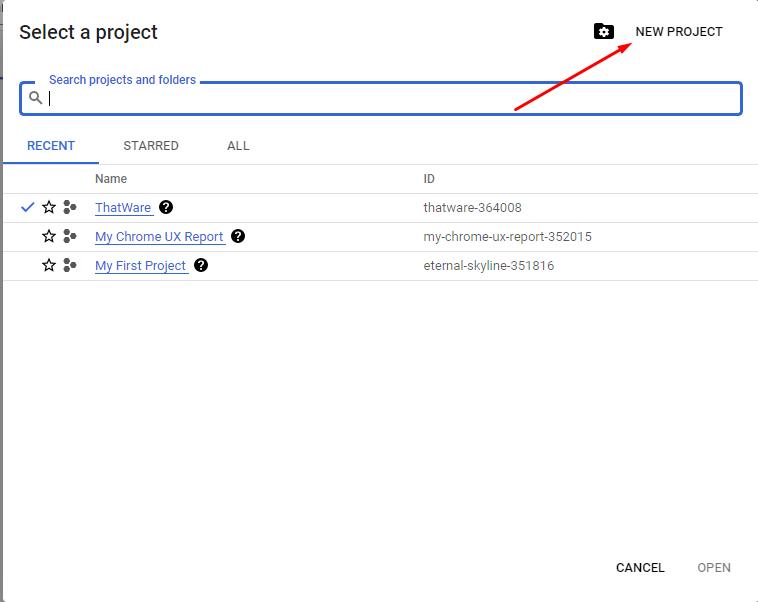
- Login to https://console.cloud.google.com/
- Create a new project using the following steps:
3. Go to API and Services and click on Enable APIs and Service
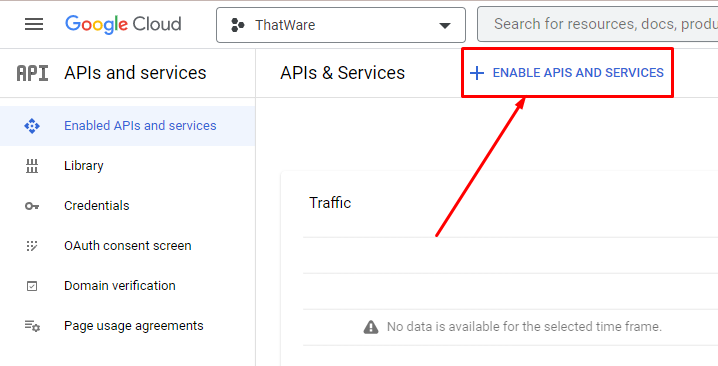
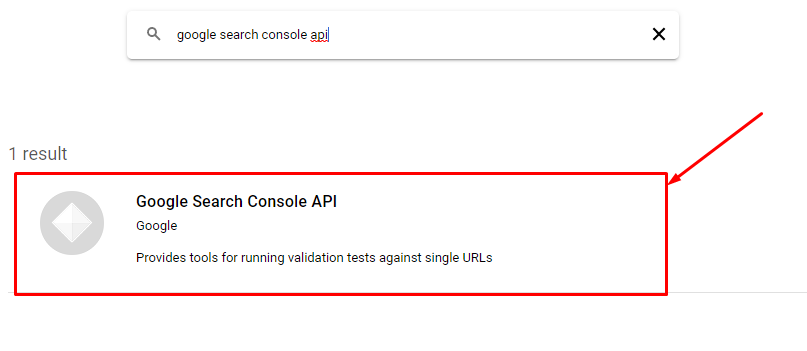
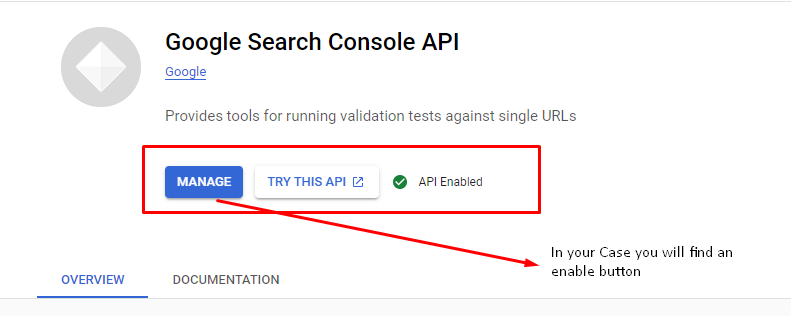
4. Search for Google Search Console API and enable it.
5. Then We need to open Google Sheets on the same Google account where you have access to the website’s Search Console.
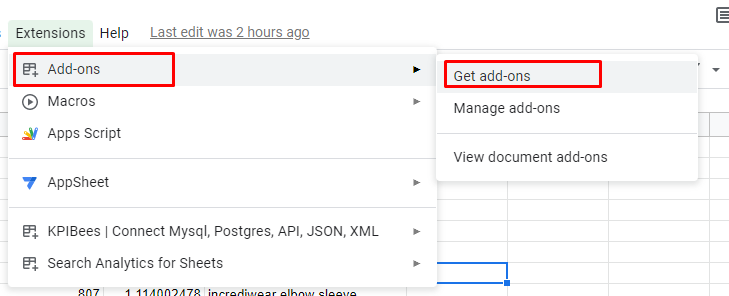
6. Go to Extensions > Add – ons > Get Add Ons and install an API Connector. (In my case I installed the KPI Bees API Connector as shown below.

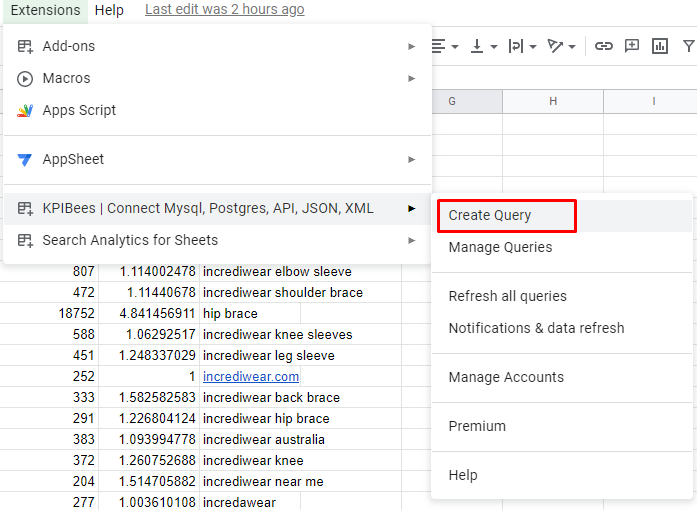
7. Once installed, access the extension and create a new query. Follow the below-mentioned steps:
Create a Query
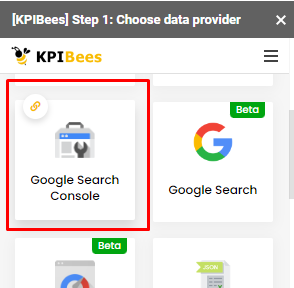
Choose Google Search Console as the primary data provider.
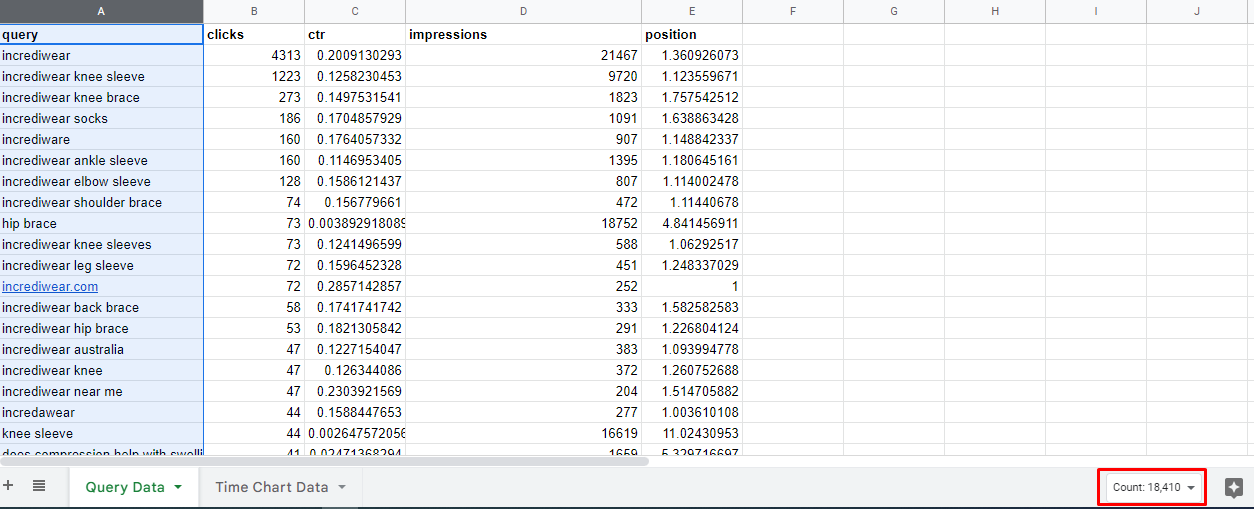
Fill out the particular fields and the property for which you want to extract the data. In my case I wanted to recreate the queries data section exporting all the queries of Google search console along with metric like clicks and impressions. Select the type as web and use an appropriate date range. Here’s the result I obtained below.
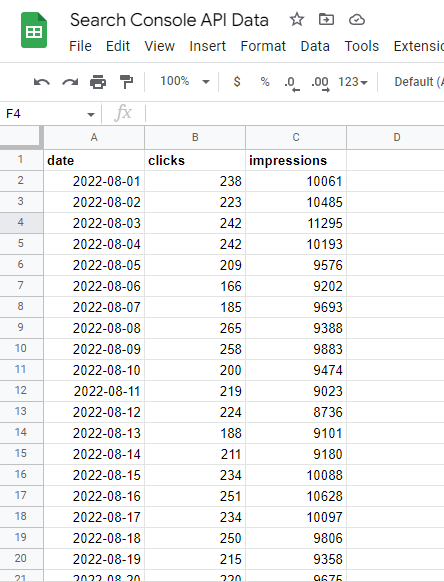
Using a similar method, one can also export the date-wise clicks and impressions data. One has to mention the date, clicks, and impressions fields in KPIBees Tab. Here we have exported sample data below.
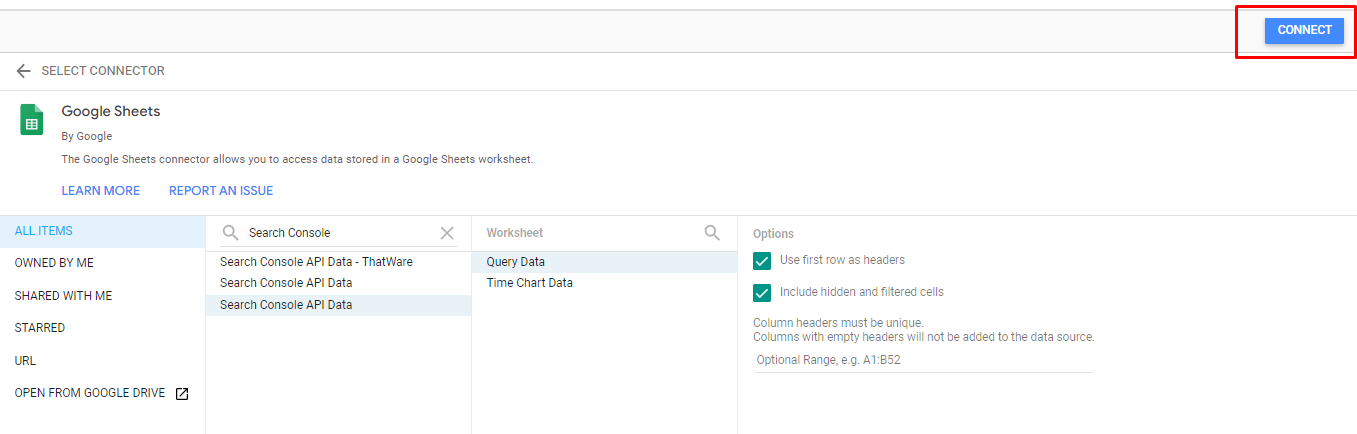
8. Now, let’s visualize this data in Data Studio. To do this, we need to connect the Google Sheets with Data Studio using the Look Up Connectors. Follow the following steps.
Find the Google Sheet connector in https://datastudio.google.com/data.
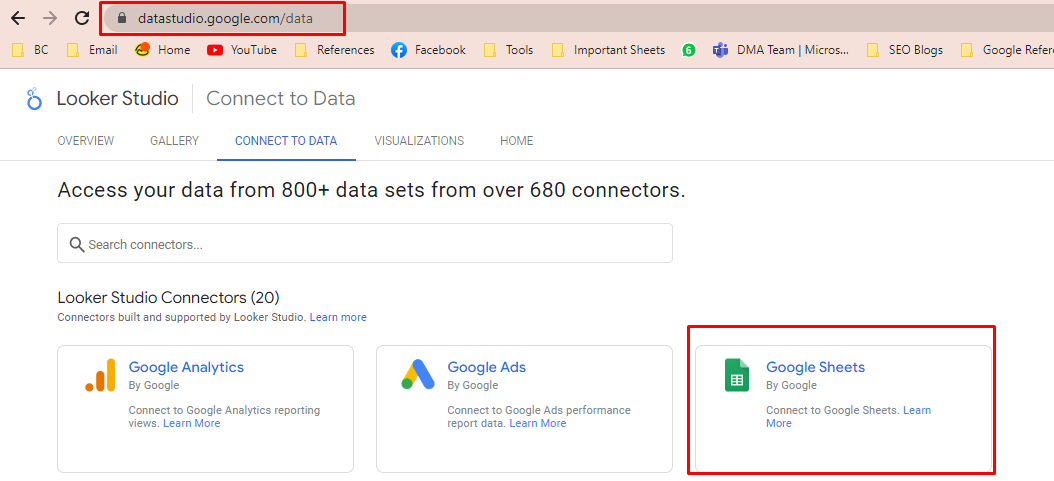
Select the appropriate Data Source Link and hit connect.
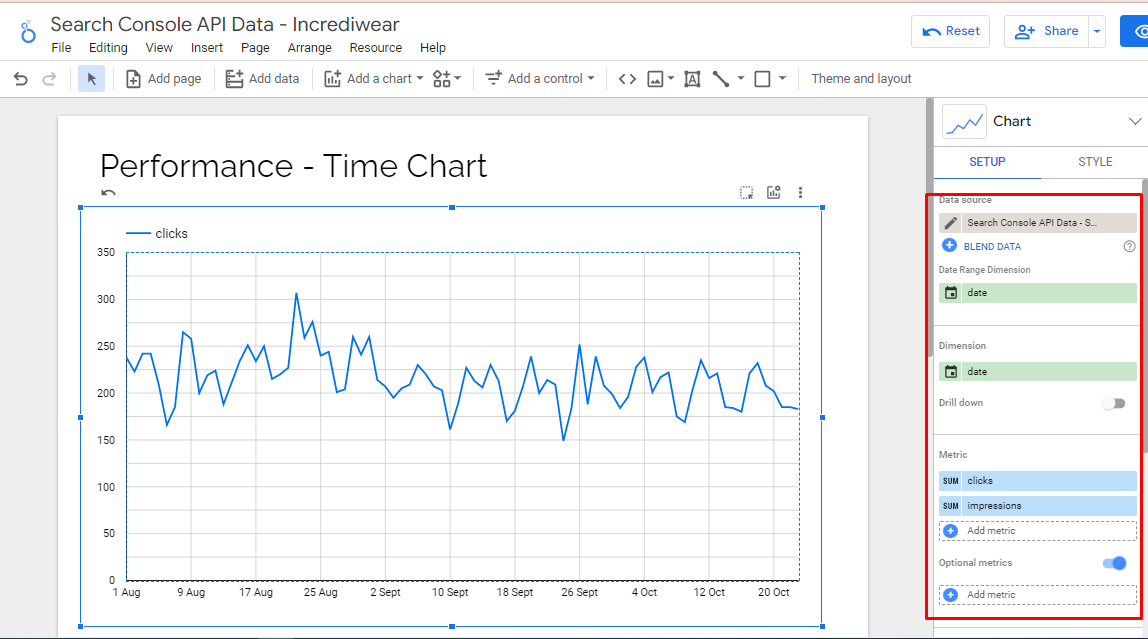
After Choosing the appropriate dimensions, you can create time charts as below to visualize the number of clicks and impressions coming per day.
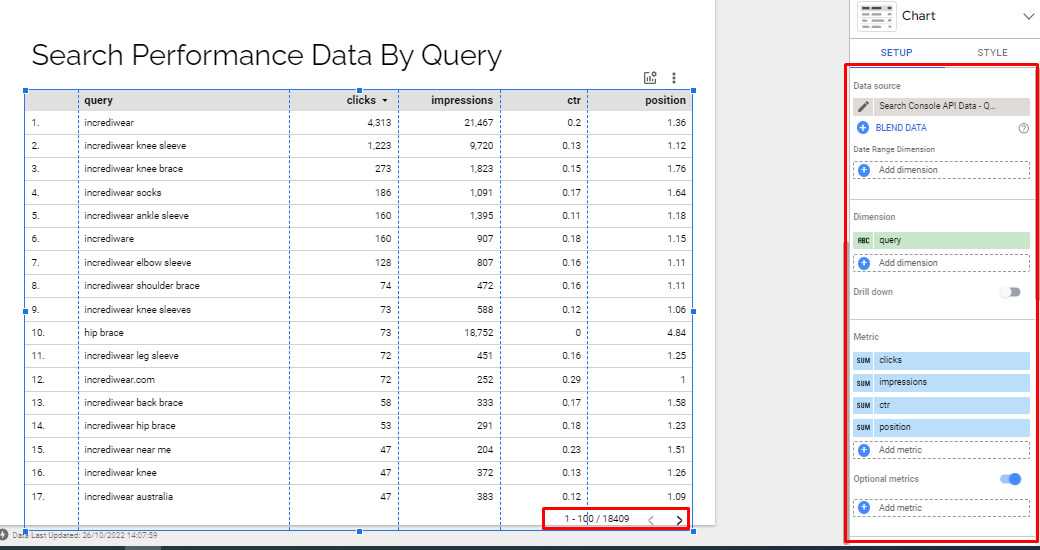
Similarly, you can insert a table chart where you can replicate the query data by selecting the appropriate data source from Google Sheets, as shown below.
Advanced Strategies for Enhancing Search Data Visualization
In today’s digital landscape, leveraging advanced strategies for enhancing search data visualization is essential for businesses looking to gain a competitive edge and maximize their online presence. Beyond the basic setup of utilizing the Search Console API query and Google Sheets, there exist a plethora of advanced techniques and best practices that can further optimize search data analysis and visualization. In this comprehensive guide, we’ll explore these advanced strategies in detail, providing actionable insights and practical guidance for harnessing the full potential of search data.
1. Advanced Data Manipulation Techniques
While basic data manipulation techniques such as filtering and segmentation provide a foundation for analysis, advanced techniques offer deeper insights and actionable intelligence. Advanced data manipulation encompasses techniques such as cohort analysis, predictive modeling, and trend analysis. It will help to understand the Google data visualization API.
Cohort Analysis: Cohort analysis involves grouping users based on shared characteristics or behaviors and analyzing their performance over time. By segmenting users into cohorts based on acquisition date, geographic location, or user behavior, businesses can identify trends, patterns, and anomalies in search performance. For example, businesses can analyze the behavior of users acquired through different marketing channels to understand their lifetime value and engagement patterns.
Predictive Modeling: Predictive modeling involves using historical data to forecast future trends and outcomes. Techniques such as time series analysis, regression modeling, and machine learning algorithms can help businesses anticipate changes in search behavior and performance metrics. By integrating predictive models into data visualization dashboards, stakeholders can proactively identify opportunities and risks, enabling more informed decision-making.
Trend Analysis: Trend analysis involves identifying patterns and trends in search data over time. By visualizing historical trends in key metrics such as organic traffic, keyword rankings, and click-through rates, businesses can uncover seasonality, identify long-term growth opportunities, and track the effectiveness of optimization efforts. Trend analysis enables stakeholders to make data-driven decisions based on historical performance and projected future trends.
2. Integration with Third-Party Tools
While Google Sheets and Data Studio provide robust visualization capabilities, integrating the Search Console API query with third-party analytics platforms offers additional flexibility and customization options. Platforms such as Tableau, Power BI, and Klipfolio provide advanced visualization features, interactive dashboards, and seamless integration with other data sources.
Tableau: Tableau is a powerful data visualization and analytics platform that allows users to create interactive dashboards and reports. By connecting Tableau with the Search Console API, businesses can create dynamic visualizations, perform ad-hoc analysis, and share insights with stakeholders. Tableau’s drag-and-drop interface and advanced analytics capabilities make it ideal for exploring complex search data and uncovering actionable insights.
Power BI: Power BI, developed by Microsoft, is a business analytics tool that empowers users to visualize and analyze data sourced from various channels. By connecting Power BI with the Search Console API, businesses can create interactive dashboards, perform advanced data modeling, and share insights across the organization. Power BI’s integration with Microsoft Azure and other Microsoft products makes it a popular choice for businesses looking to leverage their existing technology stack.
Klipfolio: Klipfolio is a cloud-based dashboard platform that allows users to create custom dashboards and reports. By integrating Klipfolio with the Search Console API, businesses can visualize key search metrics, track performance over time, and monitor KPIs in real-time. Klipfolio’s pre-built dashboard templates and customizable widgets make it easy to create tailored visualizations for different stakeholders and use cases.
3. Custom Metric Formulas
While the Search Console API provides access to standard metrics such as clicks, impressions, and CTR, creating custom metric formulas allows businesses to derive deeper insights and measure performance against specific KPIs. Custom metric formulas can be defined within Google Sheets or Data Studio using calculated fields or scripting languages.
Average Position Weighted by Clicks: Calculating the average position weighted by clicks allows businesses to prioritize keywords and pages with higher click-through rates and visibility in search results. By weighting the average position by clicks, businesses can identify opportunities to optimize content and improve organic search performance.
Branded vs. Non-Branded Search Queries: Analyzing the ratio of branded to non-branded search queries helps businesses understand their brand visibility and SEO effectiveness. By categorizing search queries as branded (containing the brand name) or non-branded (generic terms), businesses can assess brand awareness, measure the impact of branding initiatives, and identify opportunities for organic growth.
Conversion Rate by Keyword: Calculating the conversion rate by keyword enables businesses to identify high-converting search queries and optimize their content strategy accordingly. By correlating keyword performance with conversion data from Google Analytics, Google data visualization API or other tracking platforms, businesses can prioritize keywords that drive the most valuable traffic and revenue.
4. Predictive Modeling and Forecasting
Leveraging historical search data to forecast future trends and performance metrics is essential for strategic planning and resource allocation. Predictive modeling techniques such as time series analysis, regression modeling, and machine learning algorithms can help businesses anticipate changes in search behavior and make data-driven decisions.
Time Series Analysis: Time series analysis involves analyzing sequential data points collected over time to identify patterns, trends, and seasonality. By visualizing historical search data using time series plots, businesses can detect recurring patterns, forecast future trends, and make informed decisions based on past performance.
Regression Modeling: Regression modeling involves analyzing the relationship between independent variables (e.g., search queries, keyword rankings) and a dependent variable (e.g., organic traffic, conversions). By fitting regression models to historical search data, businesses can identify factors that influence search performance, quantify their impact, and make predictions about future outcomes.
Machine Learning Algorithms: Machine learning algorithms such as decision trees, random forests, and neural networks can be used to analyze complex search data and make predictions about future behavior. By training machine learning models on historical search data, businesses can identify hidden patterns, segment their audience, and personalize search experiences to improve engagement and conversion rates.
5. Competitive Analysis and Benchmarking
Understanding how your website’s search performance compares to competitors is essential for identifying strengths, weaknesses, and opportunities for improvement. Competitive analysis and benchmarking allow businesses to assess their market position, identify gaps in their strategy, and set realistic performance targets.
Competitor Benchmarking: Benchmarking your website’s search performance against competitors allows you to assess your relative position in the market and identify areas where you can gain a competitive advantage. By comparing key metrics such as organic traffic, keyword rankings, and backlink profiles, businesses can identify competitors’ strengths and weaknesses and develop strategies to outperform them.
Gap Analysis: Gap analysis involves identifying discrepancies between your website’s search performance and that of your competitors. By conducting a comprehensive audit of competitors’ websites, content strategies, and backlink profiles, businesses can identify gaps in their own strategy and prioritize areas for improvement. Gap analysis helps businesses understand where they stand in relation to competitors and develop strategies to close the gap and gain a competitive edge.
Opportunity Identification: Competitive analysis not only helps businesses identify threats posed by competitors but also opportunities for growth and expansion. By analyzing competitors’ keyword strategies, content marketing efforts, and link-building tactics, businesses can identify untapped market segments, emerging trends, and gaps in the market that present opportunities for growth. Opportunity identification enables businesses to capitalize on market trends and gain a competitive advantage.
6. User Behavior Analysis
Understanding how users interact with your website’s search functionality is essential for optimizing user experience and driving conversions. User behavior analysis involves analyzing search queries, navigation patterns, and engagement metrics to gain insights into user intent and preferences.
Search Query Analysis: Analyzing search queries allows businesses to understand what users are looking for and tailor their content strategy accordingly. By categorizing search queries based on intent (e.g., informational, navigational, transactional), businesses can optimize their website’s search functionality, improve search relevance, and drive conversions.
Navigation Patterns: Analyzing navigation patterns helps businesses understand how users move through their website and identify opportunities to streamline the user journey. By visualizing user navigation paths using flowcharts or heatmaps, businesses can identify common entry and exit points, optimize navigation menus, and improve the overall user experience.
Engagement Metrics: Tracking engagement metrics such as bounce rate, time on page, and conversion rate allows businesses to assess the effectiveness of their search functionality and content strategy. By correlating search queries with engagement metrics, businesses can identify high-performing content, optimize landing pages, and improve overall website performance.
7. Real-Time Monitoring and Alerts
Staying informed about changes in search performance is essential for identifying opportunities and addressing issues before they escalate. Real-time monitoring and alerts enable businesses to track key metrics, detect anomalies, and take immediate action to optimize performance.
Key Metric Monitoring: Monitoring key metrics such as organic traffic, keyword rankings, and click-through rates in real-time allows businesses to stay informed about changes in search performance and identify trends as they emerge. By setting up automated reports and dashboards, businesses can track performance metrics continuously and react quickly to changes in search behavior.
Anomaly Detection: Anomaly detection involves identifying sudden deviations from normal patterns or trends in search performance metrics. By applying statistical algorithms and machine learning techniques to historical search data, businesses can detect anomalies in real-time and investigate the root cause of unexpected changes. Anomaly detection enables businesses to identify issues such as algorithm updates, technical errors, or competitor activity and take corrective action promptly.
Alerting Systems: Alerting systems notify stakeholders about significant changes or anomalies in search performance metrics via email, SMS, or push notifications. By setting up customized alerts based on predefined thresholds or rules, businesses can ensure timely communication and rapid response to emerging issues. Alerting systems help stakeholders stay informed about changes in search behavior and take proactive measures to optimize performance.
8. Iterative Optimization and Testing
Continuous optimization and testing are essential for improving search performance and maximizing ROI. Implementing A/B testing frameworks, conducting multivariate experiments, and iterating on optimization strategies enable businesses to refine their approach and drive incremental improvements over time. Hence, proper testing helps in Google data visualization API.
A/B Testing: A/B testing involves comparing two or more variations of a web page, landing page, or ad creative to determine which performs better in terms of key metrics such as click-through rate, conversion rate, and revenue. By testing different elements such as headlines, call-to-action buttons, and page layouts, businesses can identify winning variations and optimize their content strategy accordingly.
Multivariate Testing: Multivariate testing involves testing multiple variations of multiple elements simultaneously to identify the most effective combination. By testing different combinations of headlines, images, and copy, businesses can uncover synergies between different elements and optimize their website for maximum impact. Multivariate testing allows businesses to explore a wide range of possibilities and identify the optimal configuration for driving conversions.
Iterative Optimization: Iterative optimization involves continuously monitoring performance metrics, identifying areas for improvement, and implementing changes based on data-driven insights. By adopting an iterative approach to optimization, businesses can refine their strategy over time, respond to changes in user behavior, and adapt to evolving market trends. Iterative optimization enables businesses to stay agile and proactive in optimizing their search performance.
9. Cross-Channel Integration
Integrating search data with data from other marketing channels allows businesses to gain a holistic view of their overall marketing performance and identify opportunities for synergy and optimization. Cross-channel integration enables businesses to understand how different channels interact and influence each other, allowing for more informed decision-making and resource allocation.
Cross-Channel Attribution: Cross-channel attribution involves allocating credit for conversions and revenue across multiple marketing channels and touchpoints. By integrating search data with data from other channels such as social media, email marketing, and paid advertising, businesses can gain insights into the effectiveness of each channel and optimize their marketing mix accordingly. Cross-channel attribution enables businesses to identify the most effective channels and allocate resources strategically to maximize ROI.
Conversion Path Analysis: Conversion path analysis involves analyzing the sequence of touchpoints that lead to a conversion or sale. By visualizing conversion paths across different channels and devices, businesses can identify common patterns, bottlenecks, and opportunities for optimization. Conversion path analysis helps businesses understand how different channels contribute to the customer journey and optimize their marketing efforts to drive conversions.
Omnichannel Optimization: Omnichannel optimization involves aligning marketing strategies and messaging across multiple channels to create a seamless and integrated customer experience. By integrating search data with data from other channels, businesses can deliver personalized and consistent messaging to customers at every touchpoint, driving engagement, loyalty, and conversions. Omnichannel optimization enables businesses to maximize the impact of their marketing efforts and deliver a cohesive brand experience across all channels.
Conclusion
If you notice the number of queries, you will find that using Google Search Console API, and Google Data Visualization API we are getting data on 18000+ queries, much more than the 1000 query limit. Also using the API connector we can export the query data and pages data simultaneously as well. Thus, in this way we can generate customized reports and visualize them using customizable charts using Data Studio.
This enables you to create comprehensive reports for clients and level up your search data analytics game.
