SUPERCHARGE YOUR ONLINE VISIBILITY! CONTACT US AND LET’S ACHIEVE EXCELLENCE TOGETHER!
There is a convenient way to produce Lighthouse Audits through the Node Command Line Interface or Node CLI. The reports generated may be with or without customization.
The CLI live documentation can and instructions to run can be found on the main Github page > https://github.com/GoogleChrome/lighthouse#output-examples
Getting Started
- If you are trying to use the CLI, then you should install the lighthouse remotely using the code:
npm install lighthouse
Or you can install globally using
npm install -g lighthouse
Note: Lighthouse requires Node 14 LTS (14.x) or later.
- You can now Run the lighthouse report on any URL by the following line
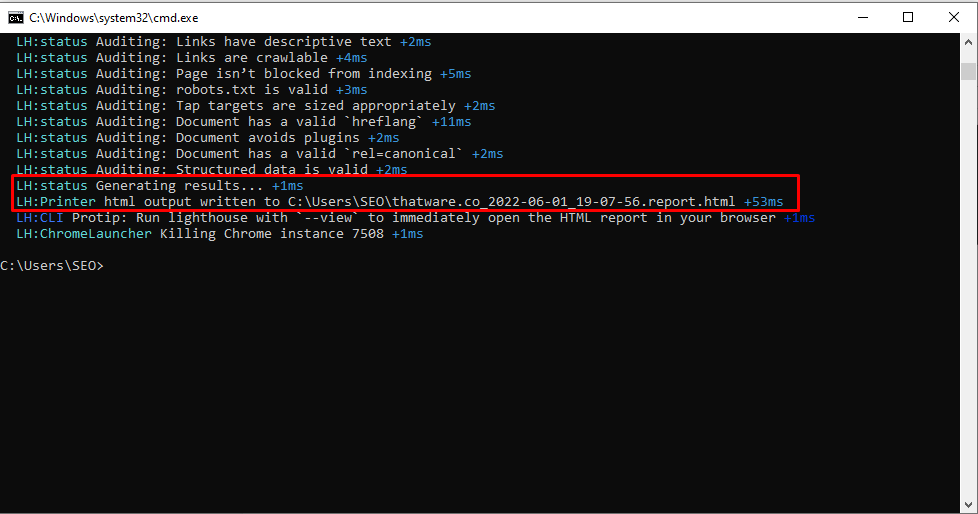
lighthouse https://thatware.co/

Lighthouse will start gathering all performance related data to check in the reports.
The final report will be generated by default in C:/ drive. In this case it was generated in the following path.
C:\Users\SEO\thatware.co_2022-06-01_19-07-56.report.html
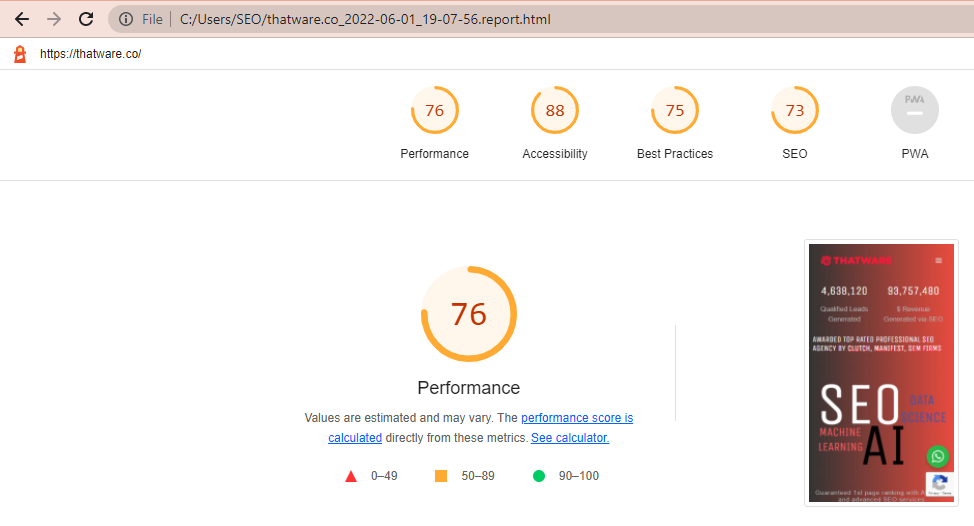
Final Report
Here’s a sample Report generated for ThatWare:
Notes on Error Reporting
The first time you run the CLI you will be prompted with a message asking you if Lighthouse can anonymously report runtime exceptions. The Lighthouse team uses this information to detect new bugs and avoid regressions. Opting out will not affect your ability to use Lighthouse in any way.
Setting up Node JS environment
To use different npm packages and run JavaScript applications, you must first set up a Node.js environment. Here’s how to install Node.js and npm on your system and a list of all the npm packages you need to run Lighthouse audits using the Node CLI, including Puppeteer and Lighthouse:
Setting up npm and Node.js:
Get Node.js here.
- Visit https://nodejs.org/, the official Node.js website.
- Get the most recent Long-Term Support (LTS) version that works with your operating system (Windows, macOS, or Linux) by downloading it.
Set up Node.js:
- After the download is finished, launch the installer and adhere to the wizard’s instructions for installation.
- After selecting the installation directory and accepting the license agreement, the installation can begin.
Check the Installation:
- Launch a command prompt window or terminal.
- Verify the installation of npm and Node.js by running the following commands:
- The installed versions of npm and Node.js should be shown by these commands, respectively.
NPM Package Overview for Lighthouse Audits:
Lighthouse:
- Google offers Lighthouse, an open-source tool for auditing SEO, accessibility, and other aspects of web page performance.
- The npm command to install Lighthouse globally is as follows: Copy the programming and Installing Lighthouse with npm
The puppeteer:
- Google created the Node.js library puppeteer to control headless Chrome or Chromium browsers.
- Lighthouse uses Puppeteer to generate reports and simulate user interactions.
- Use npm to add Puppeteer as a dependency to your project: Copy the programming and Puppeteer install with npm
Utilizing Node CLI to Conduct Lighthouse Audits:
Using CLI for Lighthouse:
- The following syntax can be used to run audits from the command line after installing Lighthouse globally: lighthouse <URL> –output-path <output_file_path.json> –output json
- To save the audit report, replace <output_file_path.json> with the desired path and replace <URL> with the URL of the webpage you want to audit.
Puppeteer Utilizing Lighthouse:
- Lighthouse audits can be programmatically launched using Puppeteer by using its API to start a headless browser and then run Lighthouse audits.
- For examples and best practices regarding the integration of Lighthouse with Puppeteer, refer to Puppeteer’s documentation.
These steps will help you install the required npm packages for Lighthouse audits, set up a Node.js environment, and start efficiently analyzing web page performance and optimization opportunities.
Lighthouse and Puppeteer Installation
Using yarn package managers or npm package managers, installing Lighthouse and Puppeteer npm packages is simple. Here’s a detailed how-to:
Making use of npm:
- Install Lighthouse everywhere
- Put Puppeteer in place locally
Using yarn
- Install the Lighthouse everywhere.
- Put Puppeteer in place locally:
The Meaning of Puppeteer
Google created Puppeteer, a robust Node.js library that offers a high-level API for programmatically controlling headless Chrome or Chromium browsers. Without a graphical user interface, it enables developers to carry out a variety of browser automation tasks, including creating screenshots, scraping websites, and simulating user interactions.
Under the hood, Lighthouse uses Puppeteer to automate the loading of webpages, the gathering of performance metrics, and the creation of thorough audit reports. To mimic user behavior, Puppeteer starts a headless browser instance, navigates to the designated website, clicks links, fills out forms, and scrolls.
Lighthouse can perform thorough audits of web pages thanks to Puppeteer’s capabilities, which include evaluations of best practices, SEO, accessibility, and performance. Lighthouse can reliably assess web page performance and spot optimization opportunities without the need for manual intervention by utilizing Puppeteer’s headless browsing capabilities.
To sum up, Lighthouse uses Puppeteer as the underlying browser automation library to mimic user interactions, gather performance information, and produce informative reports. Through the installation of both Lighthouse and Puppeteer npm packages, developers can effectively utilize the combined power of these tools for web page performance analysis and optimization.
Running Lighthouse Audits via Node CLI
Using the lighthouse npm package, scripts can be written to automate the process of running Lighthouse audits via the Node CLI. This enables you to use command-line scripts to programmatically specify target URLs, audit configurations, and output formats. Here’s how to make this happen:
1. Establishing the Project
Be sure that npm and Node.js are installed on your computer before beginning to write the script. Run npm init -y in your terminal to start a new Node.js project and create a new directory for it. Next, use npm install lighthouse to add the lighthouse npm package as a dependency.
2. Composing the Screenplay
In your project directory, create a new JavaScript file (such as audit.js) and open it with your favorite code editor. The lighthouse package will be imported into this script, along with the configurations needed to run the audits.
3. Running the Script:
This will trigger Lighthouse audits for each URL specified in the script. The audit reports will be generated in the specified output formats (HTML, JSON, or CSV) and saved in the project directory.
By writing Node.js scripts to automate Lighthouse audits, you can efficiently analyze the performance, accessibility, SEO, and best practices of your web pages and identify areas for optimization.
Interpreting Lighthouse Audit Results
It’s critical to interpret Lighthouse audit results to comprehend the performance of your website and pinpoint areas in need of development. Lighthouse offers comprehensive reports that include passed audits, opportunities for optimization, diagnostics, and a variety of performance metrics. Here’s how to properly interpret the results of a Lighthouse audit:
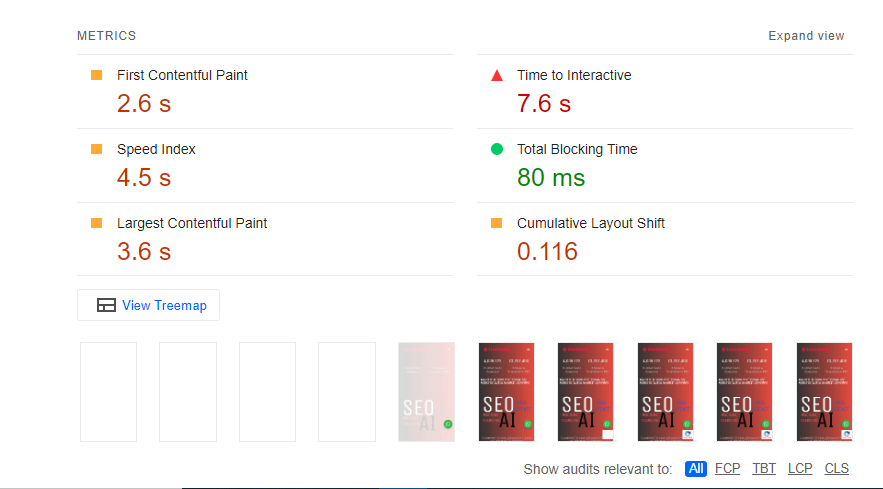
1. Metrics of Performance:
Lighthouse analyzes many performance indicators to determine how well your website performs overall. Among these metrics are:
- First Contentful Paint (FCP): Calculates how long it takes to paint the first piece of content onto the screen.
- Speed Index: The speed at which content loads visually is indicated by the speed index.
- Largest Contentful Paint: The largest content element in the viewport’s render time is indicated by the Largest Contentful Paint (LCP) feature.
- Time to Interactive (TTI): Calculates how long it takes for a webpage to respond to user input and become fully interactive.
- Total Blocking Time (TBT): Measures the duration of the main thread’s blocking, which prevents it from responding to user input, during page load.
- Cumulative Layout Shift (CLS): Quantifies unexpected layout shifts to determine how stable a page is visually.
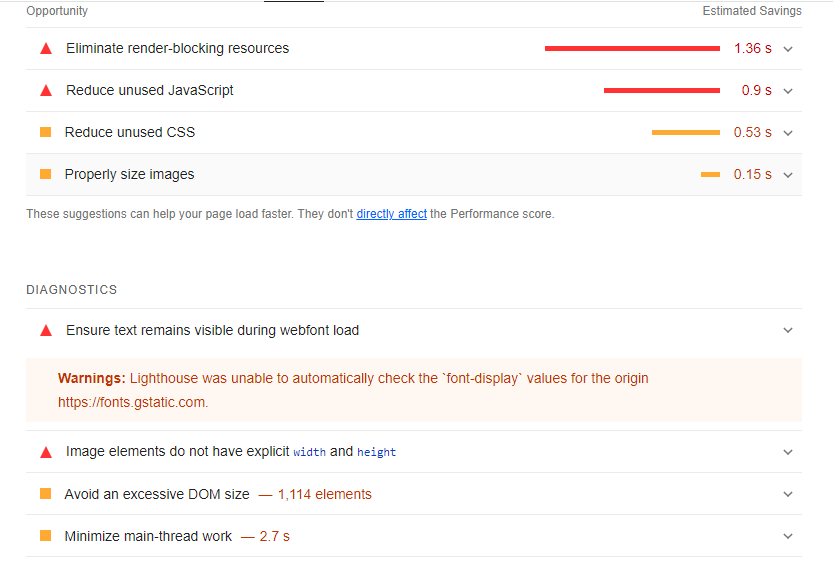
2. Possibilities for Enhancement:
Lighthouse pinpoints particular areas where your website can be improved. These opportunities offer actionable insights for optimization and are grounded in industry standards and best practices. Typical opportunities include the following:
- Reduce Render-Blocking Resources: To reduce render-blocking resources and speed up page loads, optimize the delivery of CSS and JavaScript.
- Reduce Server Response Times: Use caching, optimize database queries, and send as few HTTP requests as possible to improve server response times.
- Optimize Images: To minimize file sizes and enhance the speed at which pages load, compress and resize images.
- Minimize Main Thread Work: To enhance page responsiveness, minimize main thread work, and optimize JavaScript execution.
3. Diagnoses:
Additionally, Lighthouse offers diagnostics to point out possible problems or trouble spots that could compromise the functionality of your website. These diagnostics provide information about particular problems that require attention, like:
- Unused CSS: This tool finds CSS rules that are not in use and can be eliminated to speed up loading times and minimize file sizes.
- Unused JavaScript: JavaScript code that is not being used is indicated by this flag, which can be safely removed to improve performance.
- Accessibility Problems: Draws attention to problems with accessibility, such as inadequate color contrast or missing alt attributes on photos.
- Security Vulnerabilities: Notifies you of possible security flaws like using out-of-date libraries or making unsafe HTTP connections.
4. Successful Audits:
Additionally, Lighthouse displays audits that your website has successfully passed. These audits highlight the sections of your website that already function well and adhere to recommended guidelines.
Making Use of Lighthouse Ratings and Suggestions:
Based on the aforementioned aggregated performance metrics, Lighthouse generates overall performance scores for your website. These scores assist you in evaluating the performance of your website in comparison to industry standards and pinpointing areas that need improvement.
Prioritize your optimization efforts by concentrating on high-impact opportunities and diagnostics that could greatly enhance the functionality of your website. Start with optimizations that provide the biggest improvements in important metrics like visual stability, interactivity, and page load speed.
Continually monitor the outcomes of Lighthouse audits and observe how performance scores evolve. Iterate continuously on optimizations and enhancements to guarantee that your website stays user-friendly, quick, and accessible.
Lighthouse Performance Audit Services by ThatWare
In today’s competitive digital landscape, your website’s performance is more critical than ever. Slow loading speeds, poor accessibility, and technical glitches can drastically affect your website’s user experience and search engine rankings. At ThatWare, we specialize in Lighthouse performance audits, a comprehensive evaluation that ensures your website is optimized for speed, usability, and search visibility.
Our Lighthouse performance audit goes beyond standard website checks. Using Google’s powerful Lighthouse tool, we deliver actionable insights to enhance your site’s performance, improve Core Web Vitals, and create an unparalleled user experience.
What is a Lighthouse Performance Audit?
Lighthouse is an open-source tool developed by Google that evaluates web pages across multiple categories, including performance, accessibility, best practices, SEO, and Progressive Web App (PWA) standards. A Lighthouse performance audit analyzes these metrics and provides a detailed report highlighting areas of improvement.
At ThatWare, we leverage the Lighthouse audit to:
- Optimize website loading speeds.
- Improve accessibility for a diverse range of users.
- Ensure adherence to best coding and security practices.
- Maximize SEO potential for better search engine rankings.
Why is a Lighthouse Performance Audit Important?
In an era where user expectations are higher than ever, a well-performing website can significantly impact your business’s bottom line. Here’s why a Lighthouse performance audit is essential:
1. Improved User Experience
A slow, poorly optimized website can drive users away. A Lighthouse audit identifies bottlenecks and areas to enhance, ensuring seamless navigation and engagement.
2. Higher Search Engine Rankings
Search engines prioritize websites that offer fast loading times and excellent user experiences. A Lighthouse audit helps improve your Core Web Vitals, boosting your SEO rankings.
3. Increased Accessibility
Web accessibility ensures that people with disabilities can interact with your website effectively. Lighthouse audits help you identify and resolve accessibility issues to make your website more inclusive.
4. Enhanced Security and Best Practices
By auditing for best practices, a Lighthouse performance audit ensures your website is secure, trustworthy, and adheres to industry standards.
ThatWare’s Comprehensive Lighthouse Performance Audit
Our Lighthouse performance audit process is designed to address every critical aspect of website optimization. Here’s what you can expect when you choose ThatWare:
1. Performance Optimization
We measure key performance metrics, including:
- First Contentful Paint (FCP)
- Largest Contentful Paint (LCP)
- Time to Interactive (TTI)
- Total Blocking Time (TBT)
- Cumulative Layout Shift (CLS)
Our team identifies elements slowing your website down, such as large media files, inefficient scripts, or server response times. We provide recommendations to improve loading speeds and responsiveness.
2. Accessibility Enhancements
ThatWare audits your website’s accessibility features, ensuring compliance with WCAG (Web Content Accessibility Guidelines). We assess:
- Keyboard navigation compatibility.
- Alt text for images.
- ARIA roles and attributes for interactive elements.
- Contrast ratios for readability.
3. SEO Audit and Optimization
We analyze SEO-critical elements to ensure your site ranks high on search engines. This includes:
- Proper use of meta tags and descriptions.
- Structured data implementation.
- Mobile-friendliness.
- Elimination of broken links and duplicate content.
4. Best Practices and Security
Our Lighthouse audit evaluates your website’s adherence to industry best practices, including HTTPS implementation, proper use of HTTP headers, and avoidance of outdated APIs or libraries.
5. Progressive Web App (PWA) Evaluation
For businesses leveraging PWAs, our audit ensures compliance with PWA standards, delivering a fast and reliable user experience.
Benefits of Choosing ThatWare for Lighthouse Performance Audits
When you work with ThatWare, you gain access to a team of experienced professionals who understand the nuances of website optimization. Here’s why businesses trust us:
Tailored Solutions
We understand that every website is unique. Our recommendations are customized to your specific requirements, ensuring maximum impact.
Proven Expertise
ThatWare has a proven track record of helping businesses achieve higher performance scores, better SEO rankings, and enhanced user satisfaction.
Comprehensive Reporting
Our audit reports are detailed yet easy to understand, outlining issues, solutions, and the expected impact of improvements.
Long-Term Results
Our solutions are designed not just to fix immediate issues but to ensure long-term performance and scalability.
The Lighthouse Audit Process at ThatWare
Our step-by-step approach ensures that no aspect of your website is overlooked.
- Initial Consultation
- Understanding your website’s goals and target audience.
- Identifying specific areas of concern or improvement.
- Audit Execution
- Running the Lighthouse audit using the latest tools and technologies.
- Gathering insights across performance, accessibility, SEO, and more.
- Comprehensive Analysis
- Analyzing the Lighthouse report to identify strengths and weaknesses.
- Categorizing issues based on priority and impact.
- Actionable Recommendations
- Providing a detailed action plan with steps to improve performance.
- Suggesting tools, techniques, or updates for seamless implementation.
- Implementation Support
- Assisting with or overseeing the implementation of recommendations.
- Conducting follow-up audits to ensure changes are effective.
Industries We Serve
ThatWare’s Lighthouse performance audits cater to businesses across diverse industries, including:
- E-commerce
- Healthcare
- Education
- Real estate
- Technology
- Finance
No matter your niche, our solutions are tailored to meet your industry’s specific challenges and goals.
Case Studies
Case Study 1: E-commerce Website
A major e-commerce client approached ThatWare to improve their slow-loading website. After conducting a Lighthouse audit, we identified issues with large images and inefficient JavaScript. Post-implementation, their page loading time improved by 45%, resulting in a 30% increase in sales.
Case Study 2: Healthcare Portal
A healthcare portal requires better accessibility and SEO rankings. Our audit identified missing alt texts, poor contrast ratios, and broken links. Implementing our solutions helped them achieve WCAG compliance and a 20% boost in organic traffic.
Why Lighthouse Scores Matter
Lighthouse scores are a benchmark for your website’s overall health. Google and other search engines use these scores to determine your website’s ranking potential. A higher score signifies better performance, usability, and reliability, which directly impacts user satisfaction and business outcomes.
The Future of Website Optimization with Lighthouse Audits
As digital trends evolve, the importance of maintaining an optimized website continues to grow. A Lighthouse performance audit is not just a tool for today’s website challenges but a gateway to staying competitive in the future. At ThatWare, we understand the dynamics of an ever-changing digital landscape and how crucial it is to stay ahead of the curve.
Staying Aligned with Google’s Updates
Google constantly updates its algorithms to enhance user experience and reward websites that meet its standards. Metrics such as Core Web Vitals are now essential ranking factors, and their importance will only increase. A Lighthouse audit ensures your website aligns with these evolving standards, helping you maintain or improve your search engine rankings.
The Rise of Mobile Optimization
With the majority of users accessing websites through mobile devices, optimizing for mobile performance is no longer optional. Lighthouse audits focus heavily on mobile usability, ensuring fast loading times, intuitive navigation, and seamless responsiveness. As a leading service provider, ThatWare prioritizes mobile-first optimization, setting your website up for long-term success.
Preparing for Voice Search
Voice search is gaining prominence as users increasingly rely on smart devices to find information. Websites optimized for fast loading times, clean code, and structured data have a significant advantage in voice search rankings. Our Lighthouse audits include SEO enhancements that make your website more accessible to voice search technologies.
Enhancing Security for the Future
Cybersecurity threats are on the rise, and ensuring your website is secure is critical for both user trust and compliance. A Lighthouse audit evaluates your site’s security practices, ensuring proper implementation of HTTPS, secure APIs, and up-to-date libraries. Future-proofing your website against vulnerabilities is a key focus area for ThatWare.
Sustainability in Website Performance
The future of website performance also ties into sustainability. Energy-efficient websites with minimal resource consumption are becoming a priority for environmentally conscious users and businesses. Lighthouse audits identify opportunities to reduce the carbon footprint of your website, such as optimizing server requests, compressing files, and improving caching strategies.
Partner with ThatWare for Future-Ready Solutions
By choosing ThatWare’s Lighthouse performance audit services, you’re not just addressing your website’s current needs; you’re investing in its future. With our expert team, cutting-edge tools, and customer-centric approach, we ensure your website remains competitive and relevant in the years to come.
Let ThatWare guide you toward sustainable growth, higher rankings, and exceptional user experiences. Reach out today to secure your place in the digital future!
