SUPERCHARGE YOUR Online VISIBILITY! CONTACT US AND LET’S ACHIEVE EXCELLENCE TOGETHER!
In this blog, we will walk you through the process of testing JavaScript (JS) rendering on your website using Screaming Frog and Python. With search engines becoming more sophisticated in crawling and indexing dynamic content, it’s crucial to ensure that your website’s JavaScript-rendered content is accessible to Googlebot and other search engines. We will guide you step-by-step through the entire procedure, from configuring Screaming Frog to run crawls with both “Text Only” and “JavaScript” rendering, to exporting the crawl data into CSV files for further analysis.
Once you have your data, we will show you how to load it into Python using Pandas, combine the two crawls into a single dataset, and analyze the differences, such as variations in word count, links, and inlinks between the two rendering methods. This process will help you identify if any content is being hidden behind JavaScript and whether it’s affecting your SEO. Additionally, we will cover how to visualize these differences using Python’s powerful libraries, ensuring you can make informed decisions about optimizing your website’s crawlability. By the end of this guide, you’ll be equipped with the knowledge to perform JS rendering tests at scale and make adjustments to improve your site’s SEO performance.

Prerequisites:
- Need to install Python and Anaconda consoles on Windows/Mac
- Need to have a licensed Screaming Frog tool to test
How to Test JavaScript Rendering on a Large Scale? (Step-By-Step)
Now it is time to put our website’s JavaScript (JS) to the test.
What we want to do is to:
Make two crawls with Screaming Frog, one with “Text Only” rendering and the other with “JavaScript” rendering.
- Export the Data in CSV
- Load the Crawl Data Using Python
- Combine the Crawls Into One Data Frame
- Check Differences Between Crawls
- Make a Report With Excel
Text Only Rendered Crawl
First, let’s crawl our website like Googlebot would do in its first wave before it renders the JS.
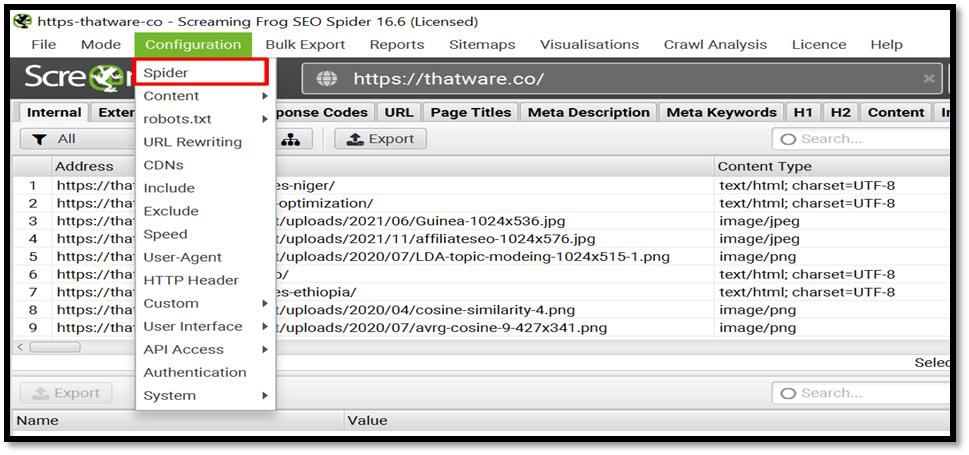
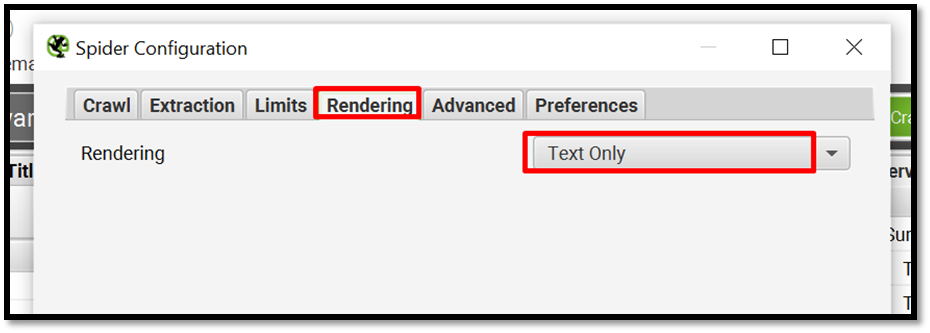
Go to Screaming frog > Configuration > Spider > Rendering > Text Only as shown here.


Then click on Start to crawl

JavaScript Rendered Crawl
Now, let’s crawl our website including rendered results. This will mimic which link Google will find in its second wave, where it renders the JS content after it has available resources.
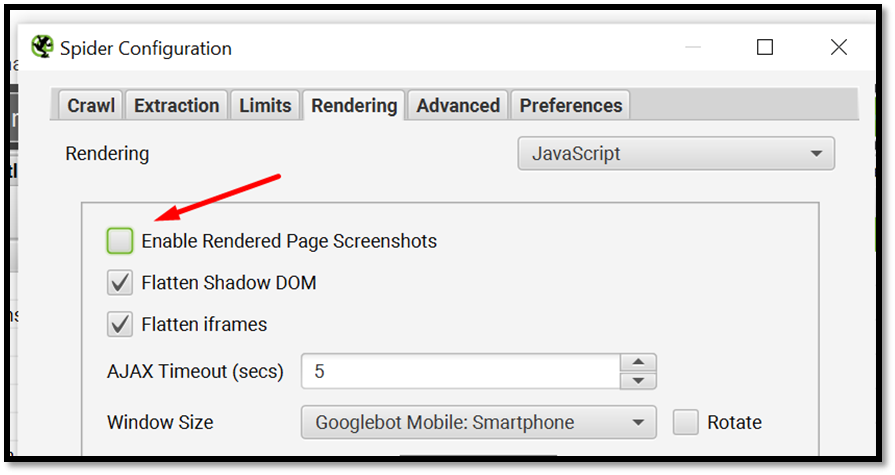
Go to Screaming frog > Configuration > Spider > Rendering > JavaScript
Make sure to deselect the checkbox for Enable Rendered Page Screenshots

Then click on Start to crawl

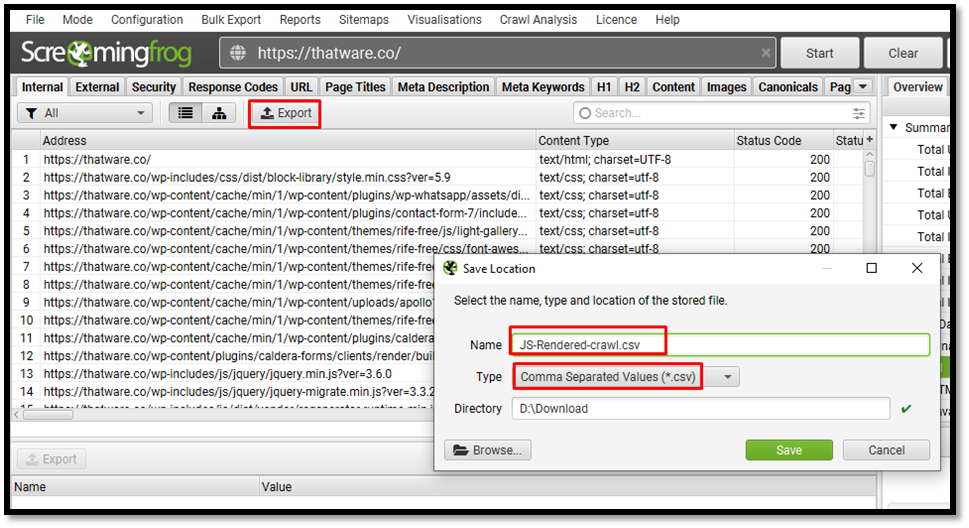
Now that your crawl is complete, you will want to export the Data to CSV.
Go in Screaming Frog > Export

Now you have two different CSV files ready for your site, one for text-only version crawl and the other one is for JS rendered crawl data.
Now we run the crawls to Pandas to perform the test rendering
We only consider the following metrics:
- Address
- Status Code
- Word Count
- Outlinks
- Unique Outlinks
- Inlinks
- Unique Inlinks
Check Differences Between Crawls
Because it will mean that a lot of content is hidden behind JavaScript and can’t be accessed from Google’s first wave crawling.
##Check the differences in each crawl
df['Diff Wordcount'] = df['Word Count_y'] - df['Word Count_x']
df['Diff Outlinks'] = df['Outlinks_y'] - df['Outlinks_x']
df['Diff Unique Outlinks'] = df['Unique Outlinks_y'] - df['Unique Outlinks_x']
df['Diff Inlinks'] = df['Unique Inlinks_y'] - df['Unique Inlinks_x']
##Check if canonical links are equivalent
## Need NumPy library
import numpy as np
df["Canonicals are equal"] = np.where((df["Canonical Link Element 1_y"] == df["Canonical Link Element 1_x"]), "yes", "no")
Identifying Key Differences Between Crawls
Once you’ve successfully completed both the “Text Only” and “JavaScript Rendered” crawls using Screaming Frog, the next critical step is to identify and analyze the key differences between the two datasets. This process helps to highlight any content that may be hidden behind JavaScript, which could potentially affect your site’s SEO performance. Let’s break down the key areas to focus on and how to analyze them.
Word Count Differences
The first metric to compare is the Word Count between the two crawls. In many cases, content that’s dynamically loaded via JavaScript won’t appear in the “Text Only” crawl because it hasn’t been rendered yet. When you compare the Word Count in the JavaScript-rendered crawl, you may notice significant differences, particularly on pages with heavy JavaScript-driven content. To identify these differences, we calculate the difference in word count using the following Python code:
df[‘Diff Wordcount’] = df[‘Word Count_y’] – df[‘Word Count_x’]
If the Diff Wordcount is large, this indicates that a substantial amount of content is only visible when JavaScript is rendered, which could mean that search engines might miss important information on the page during the initial crawl.
Outlinks and Inlinks
Next, you should compare Outlinks and Inlinks between the two crawls. Outlinks refer to external links pointing from your website to other domains, while Inlinks are the links pointing to other pages within your site. JavaScript often generates additional outlinks or modifies the link structure based on user interactions or dynamic content.
By comparing the Outlinks and Inlinks across the two crawls, you can identify if JavaScript alters the link structure significantly. Discrepancies in the number of outlinks or inlinks between the two crawls may suggest that critical links are being added or modified by JavaScript after the initial crawl. Here’s an example of the Python code to calculate the differences:
df[‘Diff Outlinks’] = df[‘Outlinks_y’] – df[‘Outlinks_x’]
df[‘Diff Inlinks’] = df[‘Unique Inlinks_y’] – df[‘Unique Inlinks_x’]
A substantial difference in these values might signal that search engines could miss valuable link relationships if they don’t fully render the JavaScript.
Canonical Link Comparison
Finally, it’s important to check for consistency in Canonical Links. Canonical tags tell search engines which version of a page should be indexed when multiple versions of the same content exist. You can check whether the canonical URLs are consistent across both crawls by comparing the canonical link elements:
df[“Canonicals are equal”] = np.where((df[“Canonical Link Element 1_y”] == df[“Canonical Link Element 1_x”]), “yes”, “no”)
If the canonical tags differ between the crawls, this could indicate that JavaScript is dynamically modifying or adding canonical tags, potentially leading to indexing issues.
Analyzing Hidden Content and SEO Issues
After comparing the differences between the “Text Only” and “JavaScript Rendered” crawls, it’s time to dig deeper into identifying hidden content and potential SEO issues. Content that is only accessible when JavaScript is rendered could be overlooked by search engines that don’t fully execute JavaScript or by search engines that index only the initial HTML document. This hidden content can have a significant impact on how your site ranks in search results. In this section, we’ll explore how to analyze the hidden content and its potential SEO implications.
1. Understanding How JavaScript Affects SEO
JavaScript is used to dynamically load content, such as images, text, or interactive elements, on web pages. While modern search engines like Google are capable of rendering JavaScript, older search engines or crawlers might not execute JS, potentially missing important content. Googlebot, for instance, typically performs two separate phases when crawling: the first wave is the standard crawl, which only fetches the static HTML of a page (similar to the “Text Only” crawl), and the second wave involves rendering the page with JavaScript. However, other search engines may not be as advanced in their crawling and may miss dynamic content entirely.
When you perform a “Text Only” crawl, you’re essentially simulating how search engines that cannot execute JavaScript see your site. On the other hand, a “JavaScript Rendered” crawl shows how content is presented when JavaScript is fully executed. If the “Text Only” crawl shows a page with less content or fewer links than the “JavaScript Rendered” crawl, it could indicate that critical SEO elements are being generated by JavaScript.
2. Identifying Hidden Content
Hidden content often includes elements like:
Text: Articles, blog posts, product descriptions, or other text content that is loaded via JavaScript.
Images: Some sites load images only after user interactions, and these images may be critical for SEO if they contain alt text or other valuable metadata.
Internal Links: Links that connect different pages of your website, potentially improving your internal link structure.
External Links: Links pointing to external websites that could help in link building.
Metadata: Meta descriptions, title tags, or schema markup that may be dynamically generated by JavaScript.
To effectively identify this hidden content, examine the differences in Word Count, Outlinks, Inlinks, and other elements in the “JavaScript Rendered” crawl compared to the “Text Only” crawl. Any discrepancies suggest that content is being dynamically loaded by JavaScript and is not present in the HTML of the page.
For example, if you observe that the Word Count is significantly higher in the “JavaScript Rendered” crawl, it implies that additional content is rendered when JavaScript is executed. This content could be crucial for user engagement or SEO but is inaccessible in the “Text Only” version, which may negatively impact the page’s performance in search rankings.
3. Analyzing the Impact of Hidden Content on SEO
Hidden content can affect SEO in several ways:
Indexing Issues: If important content (such as product descriptions or blog posts) is loaded only via JavaScript, search engines may miss indexing this content if they don’t execute JavaScript properly or at all. This could result in incomplete indexing, meaning parts of your site won’t appear in search results, directly affecting your site’s visibility.
Crawl Budget Wastage: Googlebot allocates a certain amount of time to crawl and index each website, known as the crawl budget. If a search engine cannot access crucial content because it’s hidden behind JavaScript, the crawl budget may be wasted, preventing other important pages from being crawled and indexed.
Internal Linking Structure: JavaScript often modifies the internal linking structure, adding or removing links dynamically. If these links are crucial for navigating your site and passing link equity, they may not be accessible to search engines that don’t execute JavaScript.
User Experience: Google values user experience, and pages that fail to load content quickly or provide a good experience may be penalized. If JavaScript renders crucial content too late, causing delays in content visibility, users may leave before the page fully loads. This can affect the page’s bounce rate and dwell time, both of which can impact rankings.
Meta Tags and Structured Data: JavaScript can also modify meta tags and structured data (like schema markup) on the fly. If search engines miss this dynamic content, they may misinterpret the content of your page, affecting your rankings and potentially preventing rich snippets (like product ratings or event details) from being displayed in search results.
4. Use of JavaScript to Load Critical SEO Elements
Sometimes, JavaScript is used to enhance the user experience by dynamically loading SEO-critical elements like product prices, descriptions, or review ratings. While this is common on e-commerce sites, it can also lead to problems if search engines are unable to render this JavaScript. For example:
E-Commerce Sites: If prices or product information are loaded with JavaScript, Googlebot needs to see this information to properly index the page. Otherwise, Google may not be able to display your products in relevant searches.
Structured Data: If your site uses structured data for rich snippets (like reviews, prices, or availability), but it’s rendered by JavaScript, Googlebot must execute the JavaScript to see this data. If not, your pages won’t have the rich snippets that can increase your visibility and click-through rates (CTR).
To ensure these critical elements are accessible to search engines, always check whether they are visible in the “Text Only” crawl. If they aren’t, you may need to adjust your JavaScript so that important content is rendered in a way that can be seen by search engines.
5. Addressing SEO Issues Caused by JavaScript Rendering
If your analysis reveals that important content is being hidden or not indexed correctly due to JavaScript rendering, here are a few strategies to address the issue:
Progressive Enhancement: This strategy involves making sure that the core content and functionality of your website are accessible in the HTML, with JavaScript enhancing the user experience. This ensures that search engines can access the content without executing JavaScript, while users still enjoy the enhanced features.
Server-Side Rendering (SSR): SSR allows your JavaScript content to be rendered on the server before it reaches the user’s browser. This means that search engines can index the content without needing to execute JavaScript. Implementing SSR can improve your site’s crawlability and SEO performance.
Prerendering: Prerendering is a technique that involves rendering the JavaScript content on a separate server and then serving it as static HTML to search engines. This ensures that search engines see the fully rendered page without needing to execute JavaScript.
Lazy Loading Optimization: If your site uses lazy loading for images or other media, ensure that this process doesn’t delay the loading of important SEO content. For example, JavaScript may load images or text too slowly, causing the content to appear late in the page lifecycle, which could harm SEO and user experience.
SEO Audit Tools: Use SEO audit tools like Google Search Console, Screaming Frog, or DeepCrawl to check how your pages are rendered by search engines. These tools can give you insights into how your content is being indexed and help identify which elements are not being picked up.
6. Testing and Validating Changes
Once you’ve made adjustments to address the hidden content and SEO issues caused by JavaScript, it’s essential to validate your changes. Perform another round of crawling using both “Text Only” and “JavaScript Rendered” settings to confirm that the issues have been resolved. Additionally, use Google’s Mobile-Friendly Test and Rich Results Test to ensure that your pages are accessible and that rich snippets are being generated correctly.
Monitoring how your site is rendered and indexed by search engines will help you stay ahead of any potential issues and maintain optimal SEO performance.
Generating Reports and Visualizing the Differences
After analyzing the differences between the “Text Only” and “JavaScript Rendered” crawls, the next step is to effectively present the findings. This involves generating comprehensive reports and visualizing the data to make the comparison easy to understand and actionable. Reports not only help in identifying SEO issues but also provide a clear view of what needs to be optimized or fixed. In this section, we will explore how to generate detailed reports and create visualizations to highlight the key differences between the two crawls, ultimately leading to better SEO performance and improved decision-making.
1. Exporting the Crawl Data from Screaming Frog
Before we dive into generating reports, we first need to ensure that the crawl data has been properly exported from Screaming Frog. Once the two crawls are completed—one with the “Text Only” rendering and one with “JavaScript” rendering—you can export the data to CSV files by following these steps:
Navigate to Screaming Frog: After completing both crawls, go to the Screaming Frog interface.
Export the Crawl Data: Click on File > Export > Choose the format (CSV, Excel, etc.). Export both the “Text Only” crawl and the “JavaScript Rendered” crawl.
By doing this, you will have two separate CSV files containing all the crawl data that you can work with. The next step is to load these files into Python and manipulate the data to visualize the differences.
2. Importing the Data into Python for Analysis
Once you have the CSV files, the next task is to load the data into Python for comparison and visualization. Here, we will use Pandas, a powerful Python library for data analysis, to manipulate and analyze the crawl data.
In this step, we merge the two crawls into one dataframe. This allows us to directly compare the data from both crawls, making it easier to identify key differences, such as changes in Word Count, Outlinks, Inlinks, or any other SEO metrics.
3. Creating a Comparative View
To generate a comprehensive report, we need to focus on comparing the key SEO metrics that may vary between the “Text Only” and “JavaScript Rendered” crawls. These differences could indicate whether essential content is hidden behind JavaScript. The following comparisons are crucial:
Word Count: JavaScript often loads additional content that is not present in the initial HTML.
Outlinks and Inlinks: Links may be dynamically generated or modified by JavaScript, and this can impact your site’s internal and external link structure.
Unique Outlinks and Inlinks: Similar to the above, these metrics help assess whether JavaScript affects the diversity of links on your pages.
Status Code: Ensure that there are no discrepancies in the status codes between both crawls.
To calculate the differences, we can use the following code:
This will generate new columns that show the difference in each metric. A positive difference indicates that JavaScript rendering added content or links, while a negative value suggests that content is missing in the JavaScript-rendered version.
4. Visualizing the Data Differences
Once the differences are calculated, the next step is to visualize these changes for a better understanding. Visualization can help identify patterns and outliers in the data, making it easier to pinpoint issues that need attention.
Bar Charts for Key Metrics: A bar chart is one of the most effective ways to visualize the differences in metrics such as Word Count, Outlinks, and Inlinks. Here’s how you can generate a bar chart to visualize the difference in Word Count:
This bar chart will display the difference in Word Count for each URL. If the difference is large, it indicates that a significant amount of content is being dynamically loaded with JavaScript.
Scatter Plots for Outlinks and Inlinks: To visualize how JavaScript affects the link structure, you can use scatter plots to compare the Outlinks and Inlinks from both crawls.
Scatter plots will give you a quick overview of how the links differ across the two crawls. A strong correlation (points aligned diagonally) suggests minimal differences between the crawls, while scattered points indicate a substantial variation.
Heatmaps for Correlations: If you want to see the correlation between various metrics, such as Word Count, Outlinks, and Inlinks, a heatmap can be very useful. This visualization helps identify which metrics are most affected by JavaScript rendering.
5. Generating the Final Report
Once you’ve visualized the data, it’s time to compile everything into a comprehensive report. The report should include:
Executive Summary: Provide an overview of the findings, including any major discrepancies between the “Text Only” and “JavaScript Rendered” crawls.
Visualizations: Include charts and graphs that show the differences in key metrics like Word Count, Outlinks, and Inlinks.
Recommendations: Based on the analysis, offer suggestions on how to optimize the site for better crawlability and SEO performance.
Actionable Insights: Highlight pages that require attention due to hidden content or SEO issues caused by JavaScript.
In this way, you will find out all the rendered JS files with the help of Screaming Frog and Python.

