Get a Customized Website SEO Audit and Online Marketing Strategy and Action Plan
Search queries play a crucial role in search engine optimization (SEO). They reveal what users are searching for, how they find your website, and which content resonates with them. Analyzing search queries allows businesses to refine their keyword strategies, optimize website content, and improve overall user experience. A well-structured query analysis can enhance organic traffic, boost rankings, and increase conversion rates.

Google Search Console (GSC) is one of the most powerful tools for query analysis. It provides valuable data on how users discover a website through Google Search. By analyzing query data, SEO professionals can identify high-performing keywords, optimize underperforming pages, and improve overall search visibility.
What is Google Looker Studio?
Google Looker Studio (formerly Google Data Studio) is a free data visualization and reporting tool from Google. It allows users to connect multiple data sources, including Google Search Console, to create interactive dashboards and reports. With its customizable interface, Looker Studio helps businesses analyze large datasets efficiently.
Benefits of Using Looker Studio for GSC Data Analysis
- Enhanced Visualization: Looker Studio provides various charts, graphs, and tables to present data in a clear and actionable format.
- Real-Time Data Updates: It can automatically pull and refresh data, ensuring up-to-date query analysis.
- Custom Dashboards: Users can tailor dashboards to focus on key performance indicators (KPIs) that matter most to their SEO strategy.
- Multi-Source Integration: Looker Studio allows integration with Google Analytics, Google Ads, and third-party data sources to provide a comprehensive view of SEO performance.
- Collaboration and Sharing: Reports can be easily shared with teams, clients, or stakeholders for collaborative decision-making.
Objective of This Guide
The purpose of this guide is to provide a step-by-step approach to conducting a detailed query analysis using Google Search Console and Google Looker Studio. By the end of this guide, users will be able to:
- Extract and analyze search query data effectively
- Identify opportunities to improve SEO performance
- Build interactive dashboards for ongoing monitoring and reporting
Understanding Google Search Console (GSC) Query Data
Types of Query Data in GSC
Google Search Console provides multiple data points that are essential for SEO analysis. The key metrics include:
- Impressions: The number of times a URL from your site appears in search results.
- Clicks: The number of times users click on your website from search results.
- CTR (Click-Through Rate): The percentage of impressions that result in clicks.
- Average Position: The average ranking of a URL in search results for a specific query.
GSC also allows segmentation of query data based on different dimensions:
- Queries: The exact keywords users searched for.
- Pages: The specific URLs that appeared in search results.
- Countries: Geographic location of searchers.
- Devices: Desktop, mobile, or tablet usage breakdown.
Limitations of Google Search Console
While GSC provides valuable insights, it has some limitations:
Data Sampling Issues
Google Search Console often samples data, especially for large websites, leading to incomplete query reports. This can make it challenging to analyze every search query in detail.
API Limitations and Data Retention Policies
- GSC retains query data for only 16 months, limiting historical analysis.
- The API has query limits, which can restrict large-scale data extraction.
- Some low-volume search queries are not reported due to Google’s privacy policies.
Exporting Query Data from GSC
To perform a deeper analysis, GSC query data can be exported using the following methods:
Manual Export (CSV, Google Sheets)
- GSC allows downloading data directly into CSV files or exporting it to Google Sheets.
- Ideal for small-scale analysis but may not be practical for larger datasets.
Using the GSC API for Large-Scale Data Extraction
- The Google Search Console API allows programmatic access to query data.
- It enables users to automate data extraction and integrate it with data processing tools like BigQuery.
- Ideal for advanced users dealing with extensive SEO data.
What is Google Looker Studio?
Google Looker Studio is an advanced reporting and visualization tool that enables users to analyze complex datasets efficiently. It enhances SEO analysis by transforming raw data into meaningful insights.
Free vs. Pro Version
- Free Version: Provides all essential features for creating and sharing reports.
- Pro Version: Offers additional capabilities such as enterprise-level security, scheduled data refresh, and enhanced collaboration tools.
Key Features Relevant to SEO and GSC Data
- Data Blending: Merge GSC data with Google Analytics or other SEO tools.
- Custom Calculations: Create new metrics, such as keyword growth trends.
- Interactive Filters: Users can filter data dynamically to focus on specific queries, devices, or countries.
- Automated Reporting: Schedule updates to keep reports current.
- Multiple Chart Types: Use line charts, bar graphs, and tables to present data effectively.
Connecting Google Search Console to Looker Studio
Google Looker Studio offers direct integration with GSC, making it easy to visualize and analyze search query data.
Direct Integration Method
- Open Google Looker Studio and create a new report.
- Select ‘Google Search Console’ as the data source.
- Authorize Access to your GSC property.
- Choose the Data View (e.g., Site Performance, URL Inspection).
- Load the Data and start creating visualizations.
Using BigQuery for Large Datasets
For websites with a large volume of query data, Google BigQuery can be used to store and analyze data efficiently.
- Extract GSC data using the API and store it in BigQuery.
- Connect BigQuery to Looker Studio as a data source.
- Use SQL queries to filter and manipulate large datasets before visualization.
- Enhance performance by handling millions of rows efficiently.
Customizing Looker Studio for Query Analysis
Understanding Data Visualization and Metrics
- Impressions vs. Clicks Trends: Identify high-impression queries with low CTR to improve metadata.
- Ranking Position Changes: Detect keyword ranking fluctuations over time.
- Device-Based Performance: Compare query performance on mobile vs. desktop.
- Geo-Based Search Analysis: Identify top-performing countries and regions.
Creating Custom Reports and Dashboards
- Query Performance Overview: A dashboard displaying impressions, clicks, CTR, and rankings.
- High-Opportunity Keywords: A report highlighting queries ranking on page 2 of Google (positions 11-20).
- Branded vs. Non-Branded Queries: Separate brand-related searches from generic queries.
- CTR Optimization Report: Identifies underperforming pages with high impressions but low CTR.
- Historical Data Comparison: Track keyword performance over different time frames.
By setting up Looker Studio effectively, businesses can extract meaningful insights, optimize their SEO strategies, and improve search visibility.
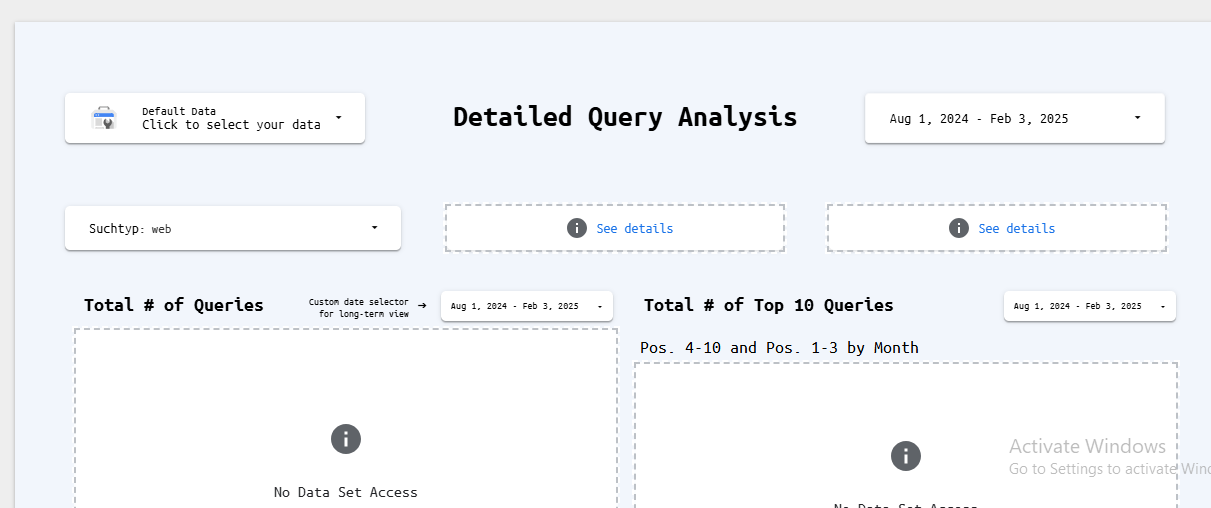
Building a Detailed Query Analysis Dashboard in Looker Studio
Step 1: Setting Up the Data Source
Connecting GSC Data
The first step in building a detailed query analysis dashboard in Google Looker Studio is to connect Google Search Console (GSC) as a data source. Looker Studio offers a built-in GSC connector that allows users to pull search performance data directly into the platform. To do this:
- Open Looker Studio and create a new report.
- Click on “Add Data” and search for the Google Search Console connector.
- Select the appropriate GSC property and define the dataset (site impressions, clicks, and query data).
- Configure the access permissions and import the data.
Ensuring Correct Data Extraction and Filtering
After connecting GSC data, applying appropriate filters is crucial to ensure that only relevant information is extracted. Key considerations include:
- Setting the correct date range (e.g., last 30 days or a custom timeframe for historical analysis).
- Filtering by country to focus on specific geographic regions.
- Excluding branded search terms for unbiased organic performance analysis.
- Ensuring all required fields, such as queries, impressions, clicks, and average position, are included.
Step 2: Creating Essential Metrics & Dimensions
Filtering by Query, Page, Country, and Device
Looker Studio allows the creation of custom filters to refine GSC query data. Standard filtering techniques include:
- Query-level filters to isolate specific keyword performances.
- Page-level filters to analyze individual URL performance.
- Country and device segmentation to compare mobile vs. desktop search trends.
Adding Calculated Fields (CTR, Rank Improvement)
Custom calculated fields enhance the depth of query analysis. Some useful metrics to create include:
- Click-Through Rate (CTR): (Clicks / Impressions) * 100
- Ranking Position Change: (Previous Position – Current Position) to identify ranking improvements or declines.
- Estimated Traffic Value: Clicks * Estimated CPC (Cost Per Click) for keyword valuation.
Step 3: Designing the Dashboard Layout
Query Performance Overview
A well-structured dashboard should include an overview section displaying key metrics such as total impressions, clicks, CTR, and average position. Visualizing these metrics through scorecards or summary tables allows quick performance assessment.
Top-Performing vs. Underperforming Queries
Using tables or bar charts, categorize queries into:
- Top-performing queries: High impressions, high clicks, and strong rankings.
- Underperforming queries: High impressions but low clicks (indicating low CTR), or queries ranking on the second page.
Trends in Impressions, Clicks, and CTR Over Time
Time-series line graphs help analyze query performance trends over weeks or months. This helps identify seasonal patterns and performance anomalies.
Step 4: Advanced Filtering and Segmentation
Filtering by Branded vs. Non-Branded Queries
Segregating branded vs. non-branded queries helps understand organic search growth beyond direct brand recognition. This can be done by:
- Using regex filters to exclude queries containing brand terms.
- Comparing CTRs for branded and non-branded terms.
Analyzing Query Performance Based on Ranking Positions
Queries should be segmented based on their average ranking position:
- Positions 1-3: Highly competitive queries dominating search results.
- Positions 4-10: Strong-performing queries needing minor optimizations.
- Positions 11-20: High-opportunity keywords that require strategic SEO improvements.
Step 5: Using Conditional Formatting & Alerts
Highlighting Queries with Declining Performance
Conditional formatting in tables can be used to highlight queries with decreasing CTR, impressions, or ranking drops. Color coding (e.g., red for decline, green for improvement) provides quick insights.
Setting Up Automated Alerts for Significant Changes
Looker Studio can integrate with Google Sheets or email alerts to notify when:
- A query drops more than X positions in ranking.
- CTR decreases below a specific threshold.
- Impressions suddenly spike, indicating a potential trend.
Advanced Query Analysis Techniques
Identifying High-Opportunity Keywords
Queries Ranking on Page 2 (Positions 11-20)
Identifying queries ranking just outside the first page of Google is crucial for SEO improvement. Strategies to push these queries to Page 1 include:
- Enhancing content depth and quality.
- Improving internal linking to the target page.
- Gaining authoritative backlinks.
Queries with High Impressions but Low CTR
Queries with high visibility but poor click performance often indicate:
- Unattractive title tags or meta descriptions.
- Mismatched search intent.
- Poor SERP positioning (e.g., lower placements even with high impressions).
Analyzing Seasonal & Trend-Based Search Queries
Using Time-Series Analysis to Detect Trends
Plotting query performance over time can reveal:
- Seasonal fluctuations (e.g., holiday-related searches peaking in December).
- Trends in user search behavior (e.g., growing interest in emerging topics).
Comparing Query Performance Across Different Time Periods
Comparing year-over-year (YoY) or month-over-month (MoM) data can indicate whether a query’s performance is improving or declining.
Segmenting Queries by Intent
Informational, Navigational, and Transactional Queries
Segmenting queries based on user intent helps in tailoring content strategies:
- Informational queries: Focus on blog posts, guides, and educational content.
- Navigational queries: Optimize site structure for better brand discovery.
- Transactional queries: Improve product pages and CTAs for conversions.
Combining GSC Query Data with Other SEO Metrics
Merging GSC Data with Google Analytics (GA4)
Integrating GA4 with Looker Studio enables cross-analysis of query performance with:
- On-page user behavior (bounce rate, session duration).
- Conversion tracking for transactional queries.
Using Third-Party Keyword Tools for Deeper Insights
External keyword tools (Ahrefs, SEMrush, Moz) can complement GSC data by:
- Identifying additional keyword opportunities.
- Providing backlink analysis for ranking improvements.
Improving SEO Strategy Based on Query Analysis
Optimizing Content for High-Potential Queries
Improving Underperforming Content
- Enhancing content with additional information, FAQs, and media.
- Addressing search intent gaps in existing pages.
Enhancing Metadata (Titles, Descriptions) for Higher CTR
- Writing compelling, keyword-rich meta descriptions.
- A/B testing title tag variations for better engagement.
Technical SEO Adjustments Based on Query Insights
Mobile vs. Desktop Performance Differences
- Using GSC’s device segmentation to address mobile-specific issues.
- Ensuring responsive design and fast mobile page speed.
Fixing Slow-Loading Pages Affecting Query Performance
- Conducting Core Web Vitals analysis.
- Implementing lazy loading and optimizing images.
Link-Building Strategies from Query Data
Finding High-Ranking Pages to Boost with Backlinks
- Identifying pages with high authority and leveraging them for interlinking.
Internal Linking Strategies to Support Weak Queries
- Using anchor text optimization to distribute page authority effectively.
Tracking SEO Performance Over Time
Setting Up Automated Looker Studio Reports
- Creating scheduled email reports for performance tracking.
Using Historical Data Comparison for Trend Analysis
- Leveraging year-over-year comparisons to measure long-term growth.
By following these strategies, businesses can leverage Google Looker Studio for in-depth query analysis, optimize SEO performance, and drive more organic traffic.
Common Challenges & Troubleshooting in Looker Studio
Google Looker Studio is a powerful tool for analyzing query data from Google Search Console (GSC), but users often encounter various challenges while integrating and visualizing data. These challenges primarily involve data accuracy issues, performance optimization, and API limitations. Addressing these issues effectively ensures accurate insights and smooth operations.
Data Accuracy Issues in GSC Reports
Handling Discrepancies Between GSC and Looker Studio
One of the most common challenges when using Looker Studio with GSC data is discrepancies between the numbers shown in Looker Studio and the GSC web interface. These inconsistencies arise due to several factors:
- Data Sampling: GSC may apply data sampling for larger datasets, leading to differences in reported metrics.
- Data Aggregation: GSC presents aggregated data differently depending on filters and segmentations applied.
- Time Zone Differences: GSC operates on Pacific Time (PT), while Looker Studio may use local time settings.
Solution:
- Always verify the selected date range in both GSC and Looker Studio.
- Use the Google Search Console API to pull raw data and cross-check with Looker Studio reports.
- Be mindful of data processing delays; GSC data updates may take 48-72 hours.
Dealing with Missing or Incomplete Data
Sometimes, Looker Studio reports display missing or incomplete data, which can mislead SEO analysis.
Causes:
- Row Limitations: Looker Studio limits the number of rows displayed in reports.
- Query Sampling: GSC may not display all queries due to privacy restrictions.
- Data Syncing Delays: API sync issues can cause missing data.
Solution:
- Use BigQuery integration to store large datasets and analyze them beyond Looker Studio’s row limits.
- Ensure filters and dimensions in Looker Studio match those used in GSC.
- Regularly refresh data sources and automate data extraction to minimize syncing issues.
Performance Optimization in Looker Studio
Speed Issues When Handling Large Datasets
When working with large GSC datasets, Looker Studio dashboards can become sluggish due to:
- A large number of rows and columns are being processed.
- Complex calculated fields slow down report rendering.
- Multiple data source connections increase load time.
Solution:
- Use aggregated data instead of raw data for faster performance.
- Optimize calculated fields by pre-processing data in Google Sheets or BigQuery before importing them into Looker Studio.
- Minimize unnecessary filters and visual elements on dashboards.
Using BigQuery for Enhanced Query Analysis
BigQuery offers a more robust approach for handling large datasets from GSC.
Advantages:
- Can store and analyze millions of rows without slowing down.
- Allows advanced query manipulation using SQL.
- Provides better scalability for growing SEO data.
Solution:
- Connect GSC data to BigQuery and use it as the data source for Looker Studio.
- Create pre-processed query tables in BigQuery to improve performance before visualization.
API Limitations & Workarounds
Overcoming API Restrictions with Third-Party Tools
Google Search Console API has limitations, including:
- Data retention limits (16 months for query data).
- API quota restrictions that may limit data extraction frequency.
Solution:
- Use third-party SEO tools (like Supermetrics, Data Studio Connectors) to bypass API quotas and extend data storage.
- Store historical data in BigQuery or Google Sheets for long-term analysis.
Automating Data Refresh for Real-Time Analysis
Manual data refreshes can be time-consuming and prone to human error.
Solution:
- Set up scheduled data refreshes in Looker Studio.
- Use Google Apps Script or third-party automation tools to sync GSC data regularly.
- Leverage BigQuery scheduled queries to preprocess data before Looker Studio pulls it.
Conclusion & Next Steps
How Detailed Query Analysis Enhances SEO Decision-Making
Analyzing query data from GSC using Looker Studio provides invaluable insights into the following:
- User search behavior – Identifying what queries drive traffic.
- Content performance – Understanding which pages rank well and why.
- SEO effectiveness – Measuring how optimizations impact rankings and CTR.
Key Metrics to Focus on for Optimization
- Impressions & Clicks: Identify high-volume queries with low CTR for content improvement.
- Average Position: Track keyword ranking trends to guide SEO strategies.
- CTR Variations: Analyze the effectiveness of title and meta description.
- Query Performance Over Time: Monitor seasonal trends to adjust content accordingly.
Future Improvements & Scalability
Expanding Query Analysis with AI and Machine Learning
AI-powered tools can enhance query analysis by:
- Identifying patterns and correlations in large datasets.
- Using predictive analytics to forecast keyword performance.
- Applying natural language processing (NLP) to classify query intent more accurately.
Integrating Other Data Sources for a Holistic SEO Strategy
To get a comprehensive SEO view, integrating additional data sources can be beneficial:
- Google Analytics 4 (GA4): To correlate user engagement metrics with query performance.
- Backlink Data: From Ahrefs or SEMrush to connect link-building efforts with search visibility.
- Competitor Analysis: Using third-party keyword tracking tools to benchmark performance.
Final Recommendations
Continuous Monitoring of Query Performance
- Schedule regular performance audits using Looker Studio dashboards.
- Keep an eye on emerging queries and shifting user trends.
- Adapt SEO strategies based on historical and real-time data.
Best Practices for Maintaining an Effective SEO Dashboard
- Use Dynamic Filters: To segment data by query, page, country, or device.
- Keep Dashboards Simple & Actionable: Avoid unnecessary complexity in reports.
- Automate Reporting: Use scheduled email reports for stakeholders.
- Regularly Update Data Sources: Ensure Looker Studio always pulls fresh and accurate data.
Businesses and SEO professionals can fully leverage Looker Studio for in-depth GSC query analysis by addressing these challenges and implementing best practices. This approach optimizes search performance and provides valuable insights to refine digital marketing strategies for long-term success.

Thatware | Founder & CEO
Tuhin is recognized across the globe for his vision to revolutionize digital transformation industry with the help of cutting-edge technology. He won bronze for India at the Stevie Awards USA as well as winning the India Business Awards, India Technology Award, Top 100 influential tech leaders from Analytics Insights, Clutch Global Front runner in digital marketing, founder of the fastest growing company in Asia by The CEO Magazine and is a TEDx speaker and BrightonSEO speaker.
