Get a Customized Website SEO Audit and Online Marketing Strategy and Action Plan
What is Server Log Analysis?
Server log analysis involves reviewing log files generated by web servers to understand how search engines (Google, Bing, etc.) and users interact with your website. These logs capture information on all requests made to the site, including search engine bots, helping identify crawling patterns and potential SEO issues.

Why is Server Log Analysis Important for SEO?
- Crawl Behavior Monitoring: Understand how frequently search engines crawl your pages.
- Crawl Budget Optimization: Identify and fix inefficient crawling to ensure high-priority pages are crawled frequently.
- Error Detection: Pinpoint pages returning 404, 500, or other errors to bots.
- Duplicate Content Identification: Check if duplicate or low-value pages are being crawled unnecessarily.
- Bot Identification: Detect harmful or spam bots.
How to Access Server Logs
Accessing your server logs will vary depending on your hosting provider or server type. Common locations include:
- cPanel: Use the “Raw Access Logs” feature.
- Apache Servers: Logs are typically stored in /var/log/httpd/.
- Nginx Servers: Logs are often found at /var/log/nginx/access.log.
- Cloud Platforms: Services like AWS or Cloudflare offer log access via their dashboards.
Tip: Ensure logs are in a readable format and can be downloaded as .log or .txt files.
Key Data Points in Server Logs
A typical log entry includes the following data:
- IP Address: The IP that made the request.
- Date & Time: Timestamp of the request.
- HTTP Method: The type of request (e.g., GET, POST).
- URL Path: The specific page or resource requested.
- User-Agent: Identifies the client making the request (e.g., Googlebot).
- HTTP Status Code: Response code returned (e.g., 200, 404, 500).
- Referrer: The source of the request (if any).
Step-by-Step Guide to Analyzing Server Logs
Step 1: Filter Search Engine Bots
Focus on analyzing search engine crawlers (e.g., Googlebot, Bingbot). Use tools or scripts to filter logs for relevant User-Agent strings.
- Googlebot: Mozilla/5.0 (compatible; Googlebot/2.1; +http://www.google.com/bot.html)
- Bingbot: Mozilla/5.0 (compatible; bingbot/2.0; +http://www.bing.com/bingbot.htm)
Action: Ensure legitimate bots are crawling your site. Use DNS reverse lookup to verify if bots are genuine.
Step 2: Identify Crawled Pages
Determine which pages are being crawled frequently and which are ignored.
- High Crawl Frequency: Indicates pages Google prioritizes.
- Low Crawl Frequency: Pages that may be considered low-priority.
Action:
- Ensure high-value pages (e.g., product pages, category pages) are crawled frequently.
- Internal linking or updating content can boost crawling for ignored pages.
Step 3: Analyze Crawl Errors
Look for errors returned to search engine bots (e.g., 404, 500).
- 404 (Not Found): Page is missing or URL is incorrect.
- 500 (Server Error): Internal server issue.
- 301/302 Redirects: Ensure redirects are valid and efficient.
Action:
- Fix 404 errors by redirecting or restoring content.
- Resolve 500 errors promptly to avoid ranking issues.
- Minimize redirect chains for better crawl efficiency.
Step 4: Detect Over-Crawling of Low-Value Pages
Identify pages that are frequently crawled but offer little value (e.g., login pages, duplicate content, or faceted navigation).
Action:
- Block unnecessary pages with robots.txt.
- Use canonical tags for duplicate pages to consolidate crawl equity.
Step 5: Monitor Crawl Budget
Crawl budget refers to the number of pages a search engine crawls in a given time frame. Wasting this budget on unimportant pages can hinder high-priority pages from being crawled.
Action:
- Remove Thin Content: Delete or noindex low-quality pages.
- Prioritize Key Pages: Ensure your site architecture leads bots to important pages first.
- Reduce JavaScript Rendering: If bots struggle to crawl JavaScript-heavy content, consider server-side rendering (SSR).
Step 6: Analyze User Behavior vs. Bot Behavior
Compare how users and bots navigate your site. Bots should follow your intended crawl path, mirroring user-friendly site architecture.
Action:
- Ensure proper internal linking so bots can access all critical pages.
- Use breadcrumbs or HTML sitemaps for easier navigation.
Here Is the process below to trace the activities of different bots using screaming frog log file analyser:
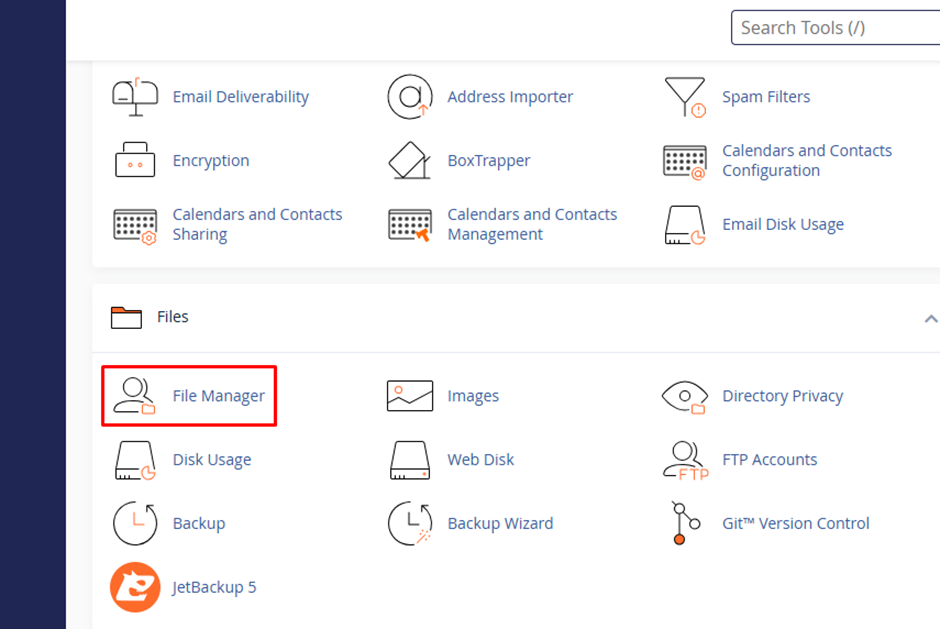
Step 1: Need to log in to the CPannel or Server and go to File manager
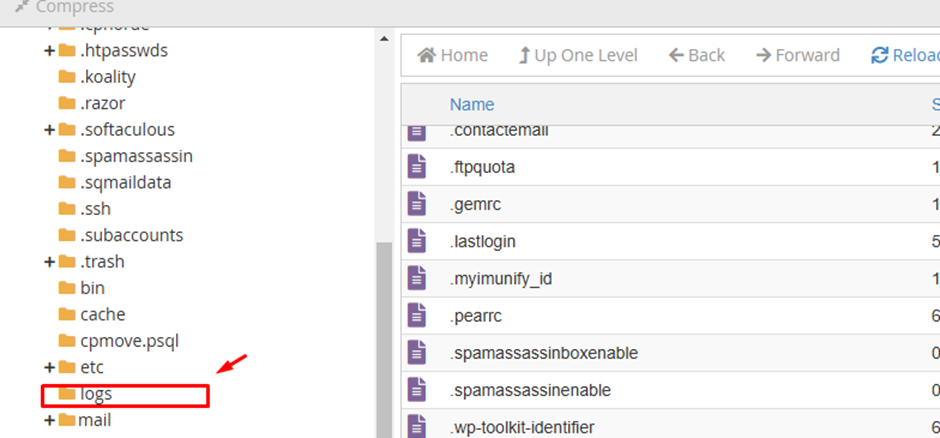
Step 2: Late for “Logs” folder
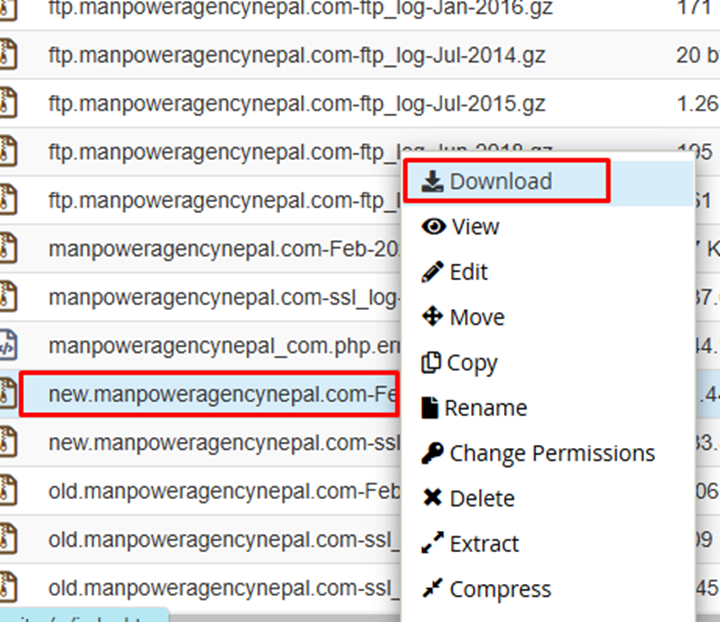
Step 3: Locate and download the log file according to the month you want to analyze:
Step 4: Install the Screamingfrog Log File analyser tool to the desktop:
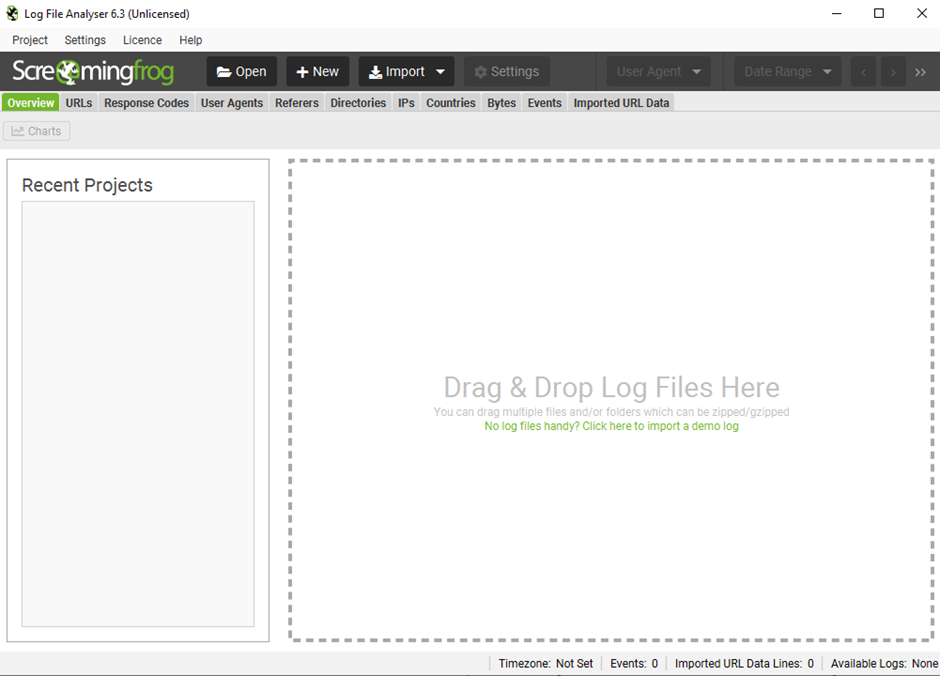
Step 5: Drag and drop the downloaded “log file”

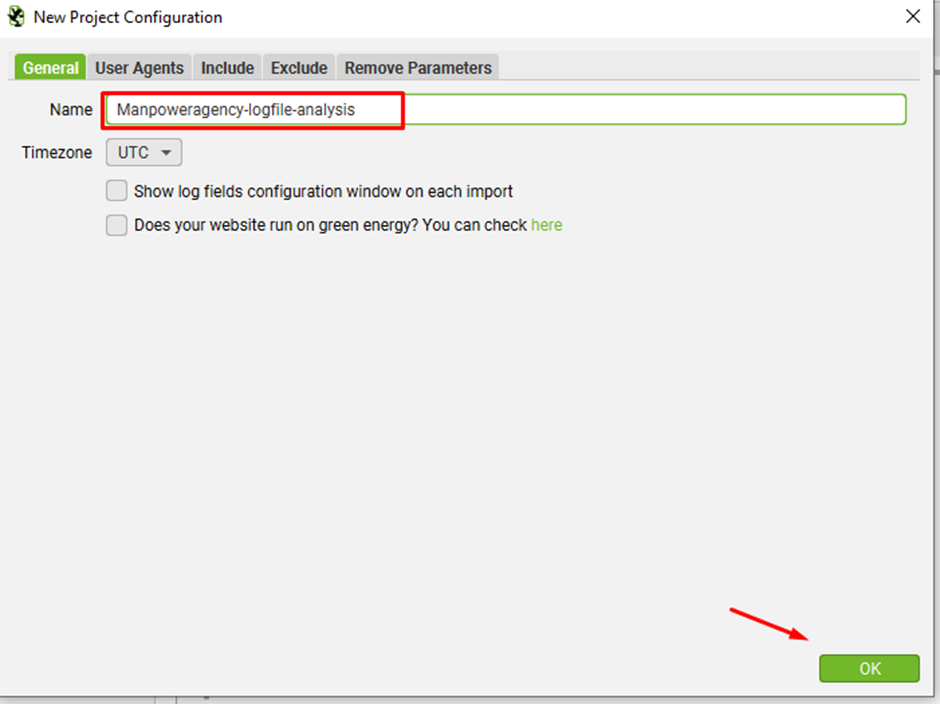
Step 6: Provide a project name
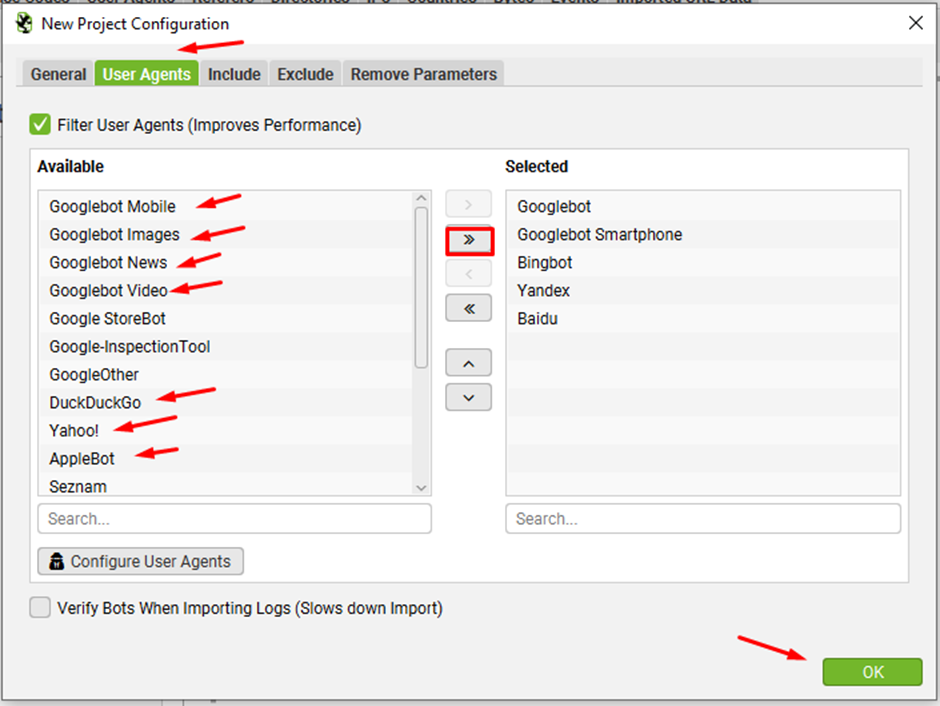
Step 7: Go to “User Agents” tab and select the preferred bots and click on the “>” button or if you want to import all search bots then click on “>>” button and click ok
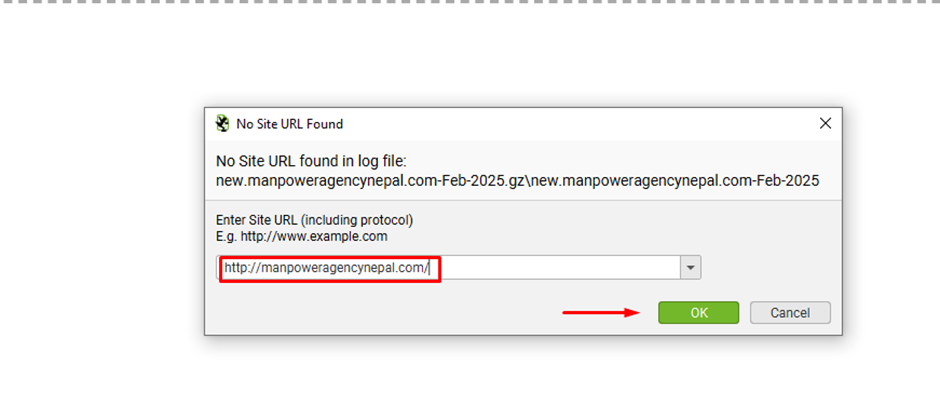
Step 8: Provide the website domain URL
Results:
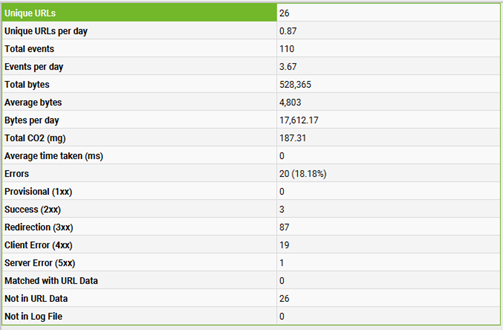
Log file data is a valuable tool for understanding your crawl budget. It reveals the total number of unique URLs crawled, as well as the daily crawl frequency. This information helps estimate how long it may take for search engines to fully re-crawl all your site’s URLs.
In the “Overview” tab, the Log File Analyzer provides a summary of total crawling events during the analysis period, along with a day-by-day breakdown.
The above graphs illustrate the trends in response codes, events, and URLs over time.
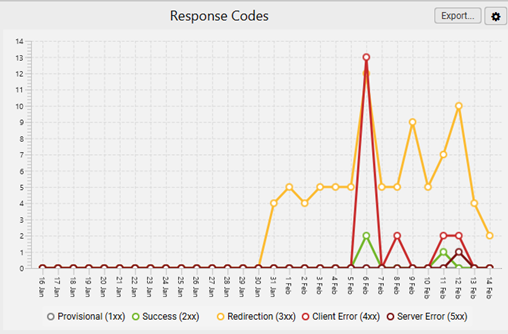
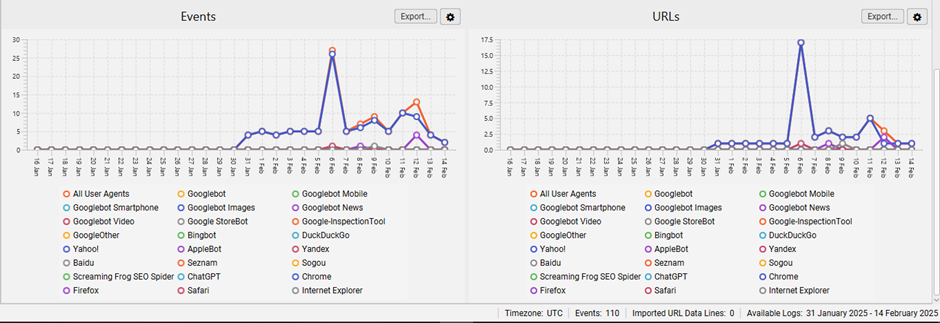
Click on the graphs to access more detailed data, including events, requested URLs, or response codes for each hour of the day. This helps pinpoint when specific issues may have occurred.
Analyse the last response code of the URLs are fetched by crawlers:

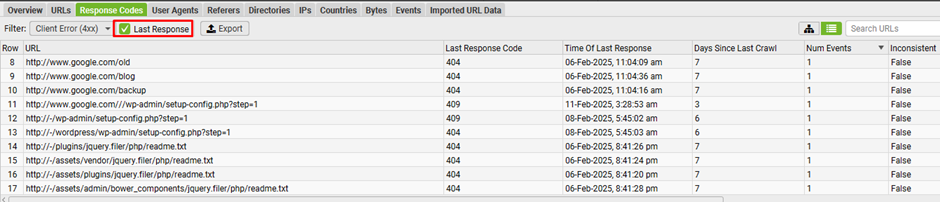
Make sure to tick the “Last Response” box next to the filter. Otherwise, the Log File Analyser will display URLs with all matching events over time, instead of only showing the most recent response.
Logs provide a quick way to analyze the most recent response codes search engines encountered for each crawled URL. Using the “response codes” tab, you can filter and identify any 4XX client errors (e.g., broken links) or 5XX server errors. This level of accuracy is only achievable through server logs or Google Search Console’s “Fetch and Render” feature.
Additionally, you can prioritize fixes by focusing on URLs with the highest crawl frequency, helping you address the most critical issues first.
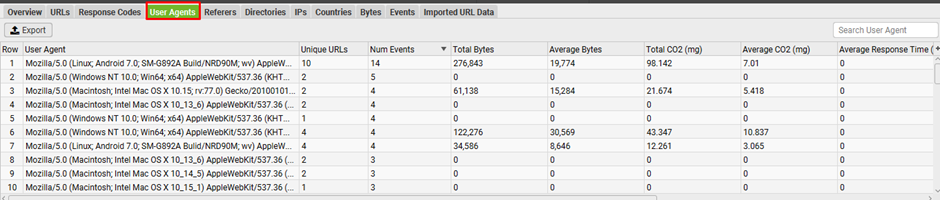
Analyse the user-agent to see which search engine is encountering most issues:
Conclusion
By regularly analysing server logs and making informed optimizations, you can ensure search engines crawl your site more efficiently and prioritize the pages that matter most. This process will improve crawl budget utilization, reduce errors, and ultimately boost your SEO rankings.

Thatware | Founder & CEO
Tuhin is recognized across the globe for his vision to revolutionize digital transformation industry with the help of cutting-edge technology. He won bronze for India at the Stevie Awards USA as well as winning the India Business Awards, India Technology Award, Top 100 influential tech leaders from Analytics Insights, Clutch Global Front runner in digital marketing, founder of the fastest growing company in Asia by The CEO Magazine and is a TEDx speaker and BrightonSEO speaker.
