SUPERCHARGE YOUR ONLINE VISIBILITY! CONTACT US AND LET’S ACHIEVE EXCELLENCE TOGETHER!
What Is Gephi And What Is Its Use?
Gephi is an open-source software designed for network visualization and analysis. It allows users to explore, manipulate, and understand complex systems represented as graphs or networks. Gephi’s intuitive interface and powerful features make it a popular choice among researchers, data analysts, and professionals in various fields.
Gephi is primarily used for visualizing and analyzing large datasets, revealing patterns and trends that might not be apparent through traditional data analysis methods. Its dynamic filtering and clustering capabilities enable users to manage and interpret vast amounts of data efficiently. Users can import data from various sources, including CSV, GEXF, and GraphML, and visualize it in a way that highlights relationships, communities, and key nodes within the network.
Common applications of Gephi include social network analysis, where it helps in identifying influential individuals or groups within social media platforms; biological network analysis, used to map and study interactions between genes, proteins, or other biological entities; and citation network analysis, which helps researchers understand the impact and evolution of scientific literature. Additionally, Gephi is employed in financial networks to detect fraud, in web analytics to map and optimize website structures, and in transportation networks to improve traffic flow and infrastructure planning. Its versatility and ease of use make Gephi an invaluable tool for uncovering insights from complex datasets.
1.Introduction:
Gephi is a free open source software that is used to represent a large computer network, social media network as a form of Graph. Gephi also allows the user to analyze and manipulate the network according to user satisfaction.
This has wide varieties of application which can be used depending on the user’s requirement like, link analysis, exploratory data analysis, social network analysis, biological network analysis, and poster creation. Its main features include dynamic filtering, real-time visualization, input/output, create cartography, layout, and data table & editions.
2.Benefits of Gephi:
After crawling and extracting all the necessary links of your site using a screaming frog, the data has been collected and imported into Gephi then we were able to request any nodes of your website and display links between them(Basically page nodes, collected through site crawl data).
Gephi helps to a particular website’s data turn into visualization. There are a wide variety of layouts available for network visualizations. The layout we used is Force Atlas 2 for graphical representation. Although we are doing link analysis we calculate each and every node’s (target page) based on real-time data.
3.SEO Advantage:
Generally, a very important factor of a strong SEO strategy is to understand how a website is structured, how the pages of a website are connected, how the page rank flows through it. This is where Gephi steps in, through a visual representation of the internal structure of a particular site, we’ll be able to diagnose and detect SEO issues regarding any page rank deficiency, Link equity and also how Google might crawl your website, then we built a network using Gephi which allowed us to detect the issues which might affect the ranking of your page later on.
Note: If there are improper page rank distributions in the network/structure also if the main target page has low page rank, then the main target page won’t get rank higher. Regarding these types of issues, Gephi is used.
4.Getting Started:
Started by crawling the website and collecting the data. (Necessary Internal links):
The tool we used to perform a crawl of your site is Screaming Frog. Once Screaming frog has finished crawling your site we get lots of links which includes an image, js files, CSS files, and many unnecessary things. Mainly we were interested in pages, not the other files, so we needed to exclude those things from the crawl data.
Exporting the files in a spreadsheet and excluding unnecessary files and links:
After we gathered the crawled data, we exported the file from Screaming Frog:
“Bulk Export”>” All links” to an excel spreadsheet.
Later on, we filtered and cleaned the spreadsheet by removing the first column “Type”, and also all the other columns beside “Source” and “Target.” But before that, we renamed the “Destination” column to “Target”.
After that, we also filtered images, CSS and JavaScript files. And also removed links like tags, category, duplicate links, paginations from the source.
Bulk Export >> all links
Exported the crawled link into an excel sheet.
Filtered and Renamed “Destination” to “Target”.
At this point, we have the filtered excel spreadsheet with Source and target information in it.
In Gephi we imported the excel spreadsheet from the “Data Laboratory” section. Once all the data is in the “Data Laboratory,” then we can see a graphical representation of the data, in the “Overview” section. This may not be a proper layout to work with, need tuning in a proper layout algorithm.
After importing the excel sheet-
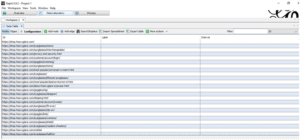
An overview of the present layout-
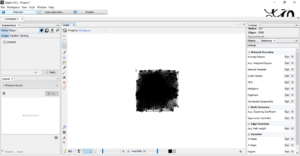
3.1.2 Tuning the Graph:
Generally, all the main layouts run using a “forced-based” algorithm. The layout algorithm we used to clarify the nodes (are the webpage links) and edges (shows the links between webpages) are “Force-Atlas 2”.By adjusting Scaling and Gravity the graph came to a viewable position.
Adjusting the view:
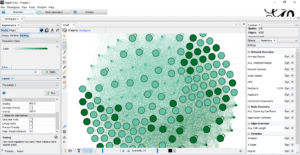
Complete Overview:
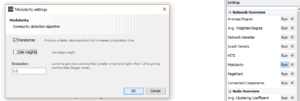
After adjusting the view, we calculated the Pagerank and Modularity.
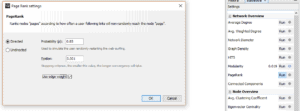
These options are available in the “Statistics” tab, and then we ran using the default settings for PageRank, but for Modularity, we un-ticked “Use weights.” This will append data about your pages in new columns that will be used for the visualization and plotting later on.
Ran Modularity-
Ran PageRank-
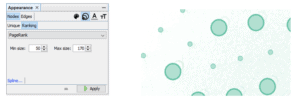
PageRank identification tuning:
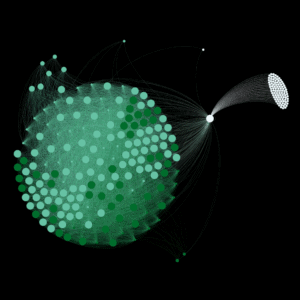
We choose nodes than its size, then the ranking tab gave min size, gave a max size.
This highlights with high page rank in large circles and low page rank with small circles according to the given max-min size.
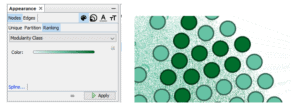
Modularity identification tuning:
Here we choose nodes then Color, then the ranking tab, then choose Modularity class.
This will highlight the nodes which have high modularity are being present as a deep-colored circle, and the nodes which has low Modularity, those nodes are being present as a faded colored circle.
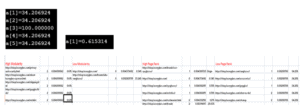
Arranging Data in the Spreadsheets: (According to their PageRank and Modularity)
Basically a table, then 4 columns have been created to note down the measurements according to their:
PageRanks
Modularity
Now in the first column, we added those links which have high modularity.
Then in the second column, we added those links which have low modularity.
Then in the third column, we added those links which have a high PageRank.
Then in the fourth column, we added those links which have a low PageRank.
Note: The topmost ranked page which has the highest PageRank according to Gephi will be count as the root page/ the main page/the origin page.
Calculations of the relative distances between nodes:
This basically measures the distance from the top most Ranked page to every other page, which are present in the data table created or spreadsheet previously (According to their PageRank and Modularity)
The distances are shown in percentage:
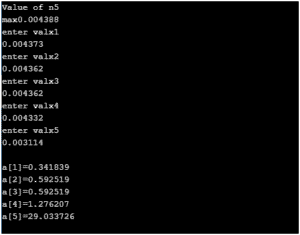
To calculate percentage we used a little c program which takes the max page rank value and all the other page rank values and then gives a result which indicates the relative distance between the origin node and the entire nodes in the spreadsheet.
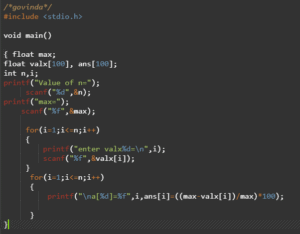
Output of the relative distance in a[i] ( i= 1,2,3,4,5 ):
Plotting the Internal structure:
There are two general theories of page rank distribution to maintain link equity that we followed is:
When the relative distance from the origin page to any other page’s percentage is high, we need to pass the page rank.
When the relative distance from the origin page to any other page’s percentage is low, we need to leave that node as it is (when these kinds of nodes have low modularity then only we need to pass modularity from another page with high modularity count).
For example:
Suppose,
A is the origin page with high page rank, has low modularity.
B is any one of the pages on the website with a low page rank.
C is also any one of the pages in the website with high modularity
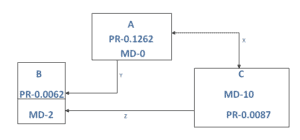
X- Both side arrow connectivity between A and C means, both nodes will pass PR and MD to each other to maintain link equity.
Y- This basically means Only from A will pass PR and MD to B to maintain link equity.
Z- Only from C, PR and MD will pass to B to maintain link equity.
Site’s linking structure, Benefits the homepage:
5. Optimizing Page Clustering for Improved Navigation
In network analysis, clustering is the process of grouping nodes (pages) based on their relationships and similarities. By applying clustering techniques to a website’s internal linking structure, Gephi can help identify clusters of pages that are highly interconnected. This concept can significantly enhance the navigation structure of a website, improving both user experience and SEO.
Gephi offers several algorithms for clustering, with the most commonly used being modularity-based clustering. This technique categorizes nodes into clusters based on the density of edges (links) within the group. Pages that are heavily linked together within a cluster tend to share thematic relevance or content structure, making it easier for users to navigate related content.
To optimize page clustering using Gephi, follow these steps:
Initial Data Import:
Start by collecting crawl data using tools like Screaming Frog. Once you have the data, import it into Gephi to visualize the network of internal links.
Apply Modularity Clustering:
Gephi’s modularity algorithm divides the network into clusters by maximizing the internal density of connections and minimizing connections between clusters. By running the modularity analysis, Gephi identifies which pages are closely related. These clusters represent groups of content that share common themes, topics, or user intents.
Adjusting Visualization for Clarity:
Once clustering is applied, adjust the layout using algorithms like Force Atlas 2 to make the clusters visually distinct. Different colors and sizes can be used to represent different clusters, helping you quickly identify related content.
Analyzing Cluster Results:
Each cluster represents a section of the website with tightly-knit links. Analyzing these clusters allows you to see how content is grouped and whether there are pages that are orphaned or have weak connections to the rest of the site. These isolated pages may require stronger internal links to improve their visibility.
Optimizing Navigation:
Once clusters are identified, it becomes clear which pages can be grouped together in the website’s navigation. For instance, related content can be placed under common category pages, facilitating easier access to users. By clustering pages around similar themes, you can create a more intuitive website structure that allows users to find information more efficiently.
Improving User Engagement:
A well-structured site based on clusters encourages deeper exploration of content. When related pages are grouped together, users are more likely to click through to other sections of the site, increasing time on site and reducing bounce rates. This kind of strategic clustering also helps Google’s crawlers understand the relationships between pages, which can lead to better indexing and ranking of related content.
Page clustering in Gephi helps webmasters and SEO specialists design websites that are not only visually organized but also easy to navigate. The insights gained through clustering can inform the site’s architecture and internal linking strategy, directly impacting user experience and site performance. Optimized page clustering is an effective way to ensure that content is logically grouped, accessible, and discoverable by both users and search engines.
6. Tracking Network Changes Over Time Using Gephi
As websites evolve, so do their internal linking structures. Whether it’s due to adding new pages, updating content, or changing the site’s navigation, understanding how a website’s internal network changes over time is essential for maintaining its SEO health and usability. Gephi provides powerful tools for tracking these changes by visualizing and analyzing network data at different points in time. By comparing different versions of the network, webmasters and SEO professionals can identify trends, potential issues, and areas for improvement.
Key Steps to Track Network Changes:
Data Collection at Multiple Time Points: To track changes over time, you must collect data at different intervals. For example, after a major site redesign, after adding a batch of new pages, or periodically during regular content updates. Using tools like Screaming Frog, you can crawl the site, export the data, and import it into Gephi for visualization.
Network Visualization Over Time:
By importing data from multiple crawls into Gephi, you can create a series of visualizations that represent different versions of the site’s internal structure. For example, you can track how clusters and nodes (pages) evolve, which nodes gain or lose connections, and how new pages are incorporated into the network. This provides a clear visual history of the site’s growth and changes.
Modularity and PageRank Comparisons:
Gephi allows you to run modularity and PageRank calculations on each dataset. By comparing the modularity scores and PageRank values of nodes over time, you can track how the importance of individual pages changes. Are new pages achieving high PageRank values quickly? Are certain pages losing importance due to a lack of internal links? Tracking these metrics over time helps you maintain a healthy link structure.
Identifying Broken Links and Orphan Pages:
By comparing the network before and after updates, you can easily identify orphan pages (pages that have no incoming links) or broken links that may have been introduced during content changes. Gephi’s visualization highlights nodes that are isolated or have a poor connection to the rest of the site, signaling areas that need attention.
Analyzing Structural Shifts:
Over time, websites naturally undergo structural changes, such as shifting from a flat structure to a more hierarchical one, or adding new sections. Gephi can track these shifts by showing how the network’s layout and the clustering of pages change. For instance, a shift from a broad, unstructured network to more tightly-knit clusters may indicate an effort to improve content organization. Understanding these changes helps optimize the site’s future growth strategy.
Optimizing SEO Strategy:
As the website’s internal network evolves, its SEO strategy must adapt. Using Gephi’s network tracking features, you can identify areas where internal links may need to be strengthened or redistributed. For example, you may find that certain high-priority pages have lost links or that there is an uneven distribution of PageRank. With this knowledge, you can modify the internal linking strategy to maintain or improve the site’s SEO performance.
Tracking Long-Term Trends:
Over the course of months or years, you can track long-term trends in how the website’s internal linking evolves. Does the network become more complex as new content is added? Are there any patterns in how content is organized or linked? By observing these trends, you can anticipate future needs and proactively address issues before they impact the user experience or SEO performance.
Tracking network changes over time using Gephi provides invaluable insights into how a website’s internal linking structure evolves. This ongoing analysis helps webmasters make data-driven decisions about content organization, internal linking strategies, and site navigation. By using Gephi to visualize and analyze changes, you can ensure that the site’s structure remains effective, user-friendly, and optimized for search engines as it grows and evolves.
7. Conclusion:
This analysis covers all the basic understanding of the internal linking structure also gives a general overview of the network visualization. This is yet an important analysis help to design a better internal linking strategy in the near future.
After gathering the data, analyzing the data and calculating the data is finished, and then comes the linking strategy internally, which will pass PR MD in such a way that every page will have an equal PR and MD at last.
Through Gephi we have a basic strategy to maintain the link equity of the whole website.

Thatware | Founder & CEO
Tuhin is recognized across the globe for his vision to revolutionize digital transformation industry with the help of cutting-edge technology. He won bronze for India at the Stevie Awards USA as well as winning the India Business Awards, India Technology Award, Top 100 influential tech leaders from Analytics Insights, Clutch Global Front runner in digital marketing, founder of the fastest growing company in Asia by The CEO Magazine and is a TEDx speaker and BrightonSEO speaker..