SUPERCHARGE YOUR ONLINE VISIBILITY! CONTACT US AND LET’S ACHIEVE EXCELLENCE TOGETHER!
Your site can be losing money right now—and you might not even know it.
A landing page goes down at 2:10 AM. Your SEO team is asleep, your sales team isn’t looking at the site, and your inbox is quiet because… the lead form isn’t sending anything. By the time someone notices at 10 AM, you’ve already lost a full morning of traffic, leads, and trust.
That’s the real danger with downtime: it’s not always dramatic. Sometimes it’s obvious—your site won’t load at all. But just as often, it’s subtle. The server still responds, yet something critical is broken. Your homepage might be redirecting unexpectedly. Your key landing page might show a maintenance screen. Your checkout page might throw an error. Your form might load, but submissions fail quietly. Visitors see the problem, leave, and don’t come back.
And the cost stacks up quickly:
- Leads drop because contact forms, CTAs, or key pages aren’t working.
- SEO trust erodes when Google repeatedly encounters errors, timeouts, or unstable performance.
- Revenue gets hit when your high-intent pages (pricing, booking, checkout) fail even briefly.
- Brand reputation takes a silent blow—because users remember the “site is broken” moment far longer than you think.
What makes this worse is that most businesses rely on manual checking. Someone opens the website a few times a day and assumes everything’s fine. But downtime doesn’t schedule itself. It happens on weekends, during the night, right before an important campaign launch, or when your ad spend is peaking.
That’s why uptime monitoring exists—so you stop guessing.
In this guide, we’ll focus on UptimeRobot for Business: a practical monitoring setup that covers not only whether your website is “up,” but also the things that actually matter to a business:
- Uptime monitoring (Are your pages and endpoints accessible?)
- Performance monitoring (Are they getting slow at peak times?)
- Email monitoring (Is your mail server reachable when clients try to email you?)
- Lead form monitoring (Are your lead pipelines running, or silently failing?)
- SSL monitoring (Are certificates valid and not about to expire?)
- Domain expiry alerts (So you never lose your domain by accident)
- Plus: notifications, teams, and operational workflows that help you respond fast.
If you’ve ever had that moment of realizing “we were down and didn’t know,” you’re in the right place.
What is UptimeRobot?
UptimeRobot is an uptime and performance monitoring platform designed to tell you—quickly and reliably—when something you care about goes down, slows down, or behaves unexpectedly. In practice, that “something” might be a website page, an API endpoint, a server, a mail host, a scheduled cron job, or even DNS and SSL-related checks. Instead of you manually checking “is the site working?” throughout the day, UptimeRobot runs those checks automatically at the interval you choose and sends alerts the moment an issue is detected.
At its core, UptimeRobot helps you answer three important questions:
- Is it up right now?
- How fast is it responding?
- When did it fail, for how long, and what happened during the incident?
The main monitor types UptimeRobot supports
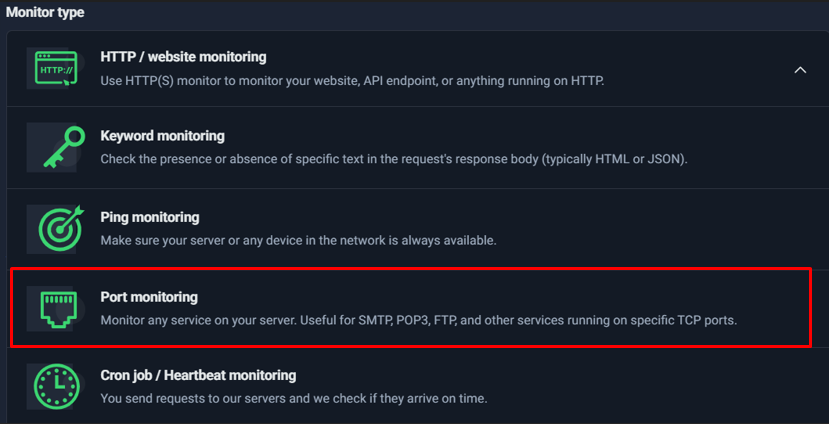
UptimeRobot isn’t limited to one kind of monitoring. It provides multiple monitor types so you can match the check to what you’re trying to protect:
- HTTP(s) Monitoring: Ideal for websites and web endpoints. It checks if a URL responds correctly (based on status codes/timeouts) and tracks response time trends.
- Keyword Monitoring: Useful when a site returns “200 OK” but is still broken (for example, showing an error message or a maintenance page). Keyword monitors confirm the presence (or absence) of specific text in the response body.
- Ping Monitoring: Confirms basic network reachability for an IP/host. This is great for “is the server reachable at all?” checks, but it doesn’t guarantee specific services (like SMTP/HTTPS) are running.
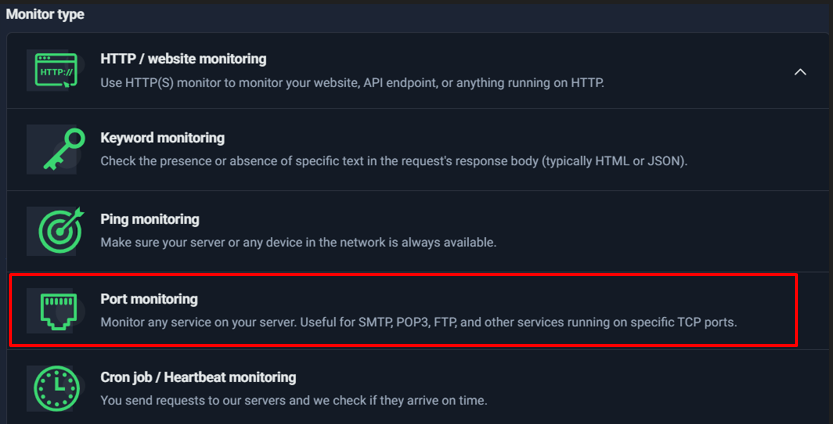
- Port Monitoring: Checks whether a specific TCP port is open and reachable (e.g., 443 for HTTPS, 22 for SSH, 25/587 for SMTP). This is a step deeper than ping because it validates service-level availability.
- Cron Job / Heartbeat Monitoring: Works in the opposite direction—your scripts or scheduled tasks “ping” UptimeRobot. If the expected heartbeat does not arrive within the defined window, you get alerted. This is excellent for backups, lead processing jobs, data sync scripts, and automation pipelines.
- DNS Monitoring: Helps detect DNS issues or unexpected changes that can break a website or email delivery even if servers are healthy.
- API Monitoring: Goes beyond “endpoint up” by validating API responses (often with JSON assertions). This is useful for detecting application-level failures even when HTTP status codes are technically successful.
- UDP Monitoring: Designed for specific network services (like DNS/SNMP or other UDP-based systems). Not everyone needs it, but it’s valuable in the right infrastructure contexts.
The big advantage here is flexibility: you can start with basic HTTP monitoring for critical pages and expand to deeper checks—like keyword validation, port-level checks, and heartbeat pings—when you want more certainty and fewer blind spots.
The core concept: Monitor + Interval + Conditions + Alerts + Escalations
To understand UptimeRobot quickly, it helps to view it as a simple formula:
- Monitor: What you’re checking (URL, host, port, cron job heartbeat, DNS, API, etc.)
- Interval: How often you want it checked (every 1 minute, 5 minutes, 1 hour, etc.)
- Conditions: What qualifies as “Up” vs “Down” (status codes, timeout thresholds, keyword presence, expected heartbeat timing, etc.)
- Alerts: Who gets notified, and how (email, SMS, voice call, push, integrations)
- Escalations: What happens if it continues failing (repeat alerts, different contact groups, “critical-only” channels like SMS/voice)
This framework matters because monitoring isn’t only about detecting an outage—it’s also about reducing false alarms while still catching the problems that impact real users. A clean monitor setup is one where your conditions reflect reality (e.g., treating 5xx errors as downtime) and your alerting is routed to the right people at the right severity.
What a user gets from UptimeRobot
Once you set up your monitors, UptimeRobot becomes a single place to track availability, performance, and incidents. The practical benefits include:
- Visibility
- Uptime: You can see which services are up/down right now and how stable they’ve been.
- Response times: You can track whether your site is “up but slow” and notice performance spikes before they become serious.
- Incident history: You get a timeline of downtime events—when they started, how long they lasted, and when they resolved.
- Notifications & integrations
- Email, SMS, voice calls, push notifications: You choose how you want to be notified.
- Team integrations: Notifications can be routed into tools like Slack/Teams/webhooks depending on your workflow, so incidents don’t stay trapped in one inbox.
- Team workflow & scale
- Roles and seats: You can invite team members with appropriate access (e.g., admin vs view-only).
- Bulk actions: When you manage multiple monitors, bulk updates (tags, groups, notifications, intervals) save time and keep setups consistent.
- Status pages: You can publish selected monitors as a status page (public or private), which is useful for transparency and internal reporting.
Before You Start: Decide What You Want to Monitor
One of the biggest mistakes people make with monitoring tools is jumping straight into setup without thinking strategically. They add a homepage monitor, maybe enable email alerts, and assume they’re covered. But monitoring isn’t about checking “a website.” It’s about protecting business continuity across multiple technical layers.
Before you configure anything inside UptimeRobot, you need clarity on one critical question:
What failures would hurt my business the most — and at what layer could they occur?
Websites and applications fail in different ways:
- The server might go offline.
- The page might load but display an error message.
- The API might return 200 OK but internally fail.
- A cron job might silently stop running.
- Email might stop sending even though the website is live.
- DNS or SSL might expire and break access entirely.
Each of these failures happens at a different technical layer. That’s why we use a layered monitoring model.
The Monitoring Layers Model
Think of monitoring as a stack of protection layers. Each layer guards against a specific type of failure. When combined, they create a complete safety net.
Layer 1: Site Uptime (HTTP Monitoring)
This is the foundation.
HTTP monitoring checks whether your website or endpoint responds successfully. It verifies:
- The server is reachable
- The web application is responding
- The HTTP status code matches expected success (typically 2xx or 3xx)
- The response arrives within your timeout window
If your homepage goes down entirely, this layer catches it.
This is the first and most essential monitor for:
- Homepages
- Service pages
- Blog sections
- Landing pages
- API endpoints
If you only configure one monitor, this is where you start.
Layer 2: Content Correctness (Keyword Monitoring)
Sometimes your site returns 200 OK — but the page is broken.
Examples:
- The database fails and shows “Error establishing connection.”
- The page loads but displays a maintenance banner.
- A product page loads without price or stock details.
Keyword monitoring checks for the presence or absence of specific text in the page body.
For example:
- Confirm the word “Contact” exists on your contact page.
- Confirm “Checkout” appears on your payment page.
- Ensure “Error” does NOT appear.
This layer protects against “soft failures” — situations where the server is technically up, but the user experience is broken.
Layer 3: Infrastructure Reachability (Ping Monitoring)
Ping monitoring checks whether a server or device responds at the network level.
It does not check whether a website loads — it checks whether the machine itself is reachable.
This is useful for:
- Server IP addresses
- Network devices
- Infrastructure hosts
- External mail servers (MX hosts)
If your server is completely unreachable, ping monitoring will detect it quickly.
However, remember:
Ping confirms reachability — not service health.
Layer 4: Service Availability (Port Monitoring)
A server can respond to ping while a critical service is down.
For example:
- SMTP service might be offline.
- SSH service might not be listening.
- HTTPS port 443 might be misconfigured.
- A database port may be blocked.
Port monitoring checks whether a specific TCP port is open and accepting connections.
Examples:
- Port 443 → HTTPS service
- Port 22 → SSH access
- Port 25/587 → SMTP mail sending
- Port 3306 → MySQL database
This layer ensures the service itself is running — not just the machine.
Layer 5: Background Jobs & Pipelines (Heartbeat / Cron Monitoring)
Some of the most critical failures don’t affect users immediately.
Examples:
- Nightly backups stop running.
- Lead processing scripts fail.
- CRM sync jobs stop executing.
- Scheduled reports aren’t generated.
- Payment reconciliation scripts fail silently.
Heartbeat monitoring works differently: instead of UptimeRobot checking you, your system must ping UptimeRobot.
If the expected signal does not arrive within the configured interval, an alert is triggered.
This layer protects:
- Cron jobs
- Data pipelines
- Automation workflows
- Scheduled integrations
It’s essential for business process reliability.
Layer 6: DNS Integrity (DNS Monitoring)
Your website can be perfectly functional — but if DNS breaks, nobody can reach it.
DNS monitoring verifies:
- Records resolve correctly
- Nameservers respond
- Critical DNS changes are detected
This layer protects against:
- Accidental DNS misconfiguration
- Expired DNS records
- Malicious DNS tampering
Without DNS, nothing else matters.
Layer 7: API Correctness (API Monitoring)
Modern systems rely heavily on APIs.
Standard HTTP monitoring checks status codes. But APIs often return 200 OK even when something fails internally.
API monitoring allows:
- JSON validation
- Assertion rules
- Field-level checks
Example:
{
“status”: “success”
}
If the API returns:
{
“status”: “error”
}
Even with a 200 status code, API monitoring can flag it.
This layer ensures application logic works — not just connectivity.
Layer 8: Protocol-Specific Needs (UDP Monitoring)
Some services use UDP instead of TCP.
Examples:
- DNS services
- SNMP monitoring
- Certain network applications
If your infrastructure depends on UDP-based services, this layer becomes important.
For most website owners, this is optional — but for network-heavy environments, it’s critical.
Common Real-World Examples
Let’s translate the layers into practical scenarios.
Homepage and Key Landing Pages
Monitor using:
- HTTP monitor (Layer 1)
- Keyword monitor (Layer 2)
These pages drive traffic, SEO rankings, and conversions. Downtime here directly affects revenue.
Checkout and Contact Pages
Monitor using:
- HTTP monitor
- Keyword monitor (ensure “Submit,” “Checkout,” or “Contact” text exists)
- Optional: Heartbeat if form processing happens via cron
These pages are conversion points. Silent failures cost leads.
API Health Endpoints
Monitor using:
- HTTP monitor for availability
- API monitor for JSON validation
Especially important for SaaS, internal dashboards, or integrations.
Server IP Reachability
Monitor using:
- Ping monitor
- Port monitor (443/22/etc.)
Ensures infrastructure-level awareness before application-level failures escalate.
SMTP / Email Service Reachability
Monitor using:
- Ping monitor for MX host
- Port monitor for SMTP ports
If email fails, password resets, notifications, and lead confirmations stop working.
Backups and Cron Scripts
Monitor using:
- Heartbeat monitor
If backups fail silently for weeks, you discover the issue only after disaster strikes.
Heartbeat monitoring prevents that.
Domain & SSL Expiry
Monitor using:
- SSL certificate checks
- Domain expiry reminders
Expired SSL certificates cause browser security warnings. Expired domains cause total outage.
These are preventable failures.
By now, you should see that monitoring isn’t a single setting — it’s a layered protection system.
At the end of this section, it’s helpful to visually see all the available monitor types inside UptimeRobot.
This is your toolbox.
Monitor Types Explained
HTTP / Website Monitoring
HTTP / Website monitoring is the most common—and usually the best—starting point in UptimeRobot because it directly answers the question most teams care about first: “Is my website or endpoint reachable and responding correctly?” It works for everything from a simple marketing page to a complex web application, and even many API endpoints.
This monitor type is ideal when you want reliable alerts for:
- Landing pages (service pages, product pages, campaign pages)
- Core website URLs (homepage, blogs, contact page)
- Web apps (login screens, dashboards)
- Basic API endpoints (health checks, status routes)
In short: if it’s accessible over HTTP or HTTPS, this monitor is usually the right choice.
What HTTP Monitoring Actually Checks
When you create an HTTP monitor, UptimeRobot repeatedly sends a request to the URL you provide. Each check validates two primary things:
1) HTTP Response Status (Is it “Up”?)
Every HTTP response includes a status code that indicates what happened.
Common examples:
- 2xx: success (e.g., 200 OK)
- 3xx: redirect (e.g., 301 Moved Permanently, 302 Found)
- 4xx: client error (e.g., 404 Not Found, 401 Unauthorized)
- 5xx: server error (e.g., 500 Internal Server Error, 503 Service Unavailable)
UptimeRobot lets you decide which codes you consider “Up.” Most websites should treat 2xx and 3xx as “Up,” because redirects are still a valid working response for many real-world setups (like HTTP → HTTPS, www → non-www, etc.).
2) Response Time (Is it fast enough?)
UptimeRobot also tracks how long the server takes to respond. This is extremely valuable because many issues don’t show up as full downtime—sometimes the site is “up,” but painfully slow, which can impact:
- conversions
- user experience
- SEO signals
- customer trust
By enabling slow response alerts, you can get notified when performance degrades before it turns into full downtime.
When HTTP Monitoring Fails (And Why Alerts Trigger)
HTTP monitors typically trigger downtime alerts due to one of these real-world causes:
✅ Timeout (no response fast enough)
If the server doesn’t respond within the timeout window you set (commonly 15–30 seconds), UptimeRobot marks it as down. Timeouts often happen due to:
- overloaded servers
- database delays
- hosting issues
- network congestion
- DDoS/security events
✅ Wrong status code
If your monitor expects “Up” codes like 2xx/3xx, but the server returns:
- 500 (server error)
- 503 (service unavailable)
- 403 (blocked)
- 404 (missing)
then it will trigger an incident.
This is why status code configuration matters: it determines whether UptimeRobot treats an error page as downtime.
✅ Unreachable host
If DNS fails, the host is unreachable, or the SSL handshake fails (for HTTPS), UptimeRobot can’t complete the request and will trigger an alert.
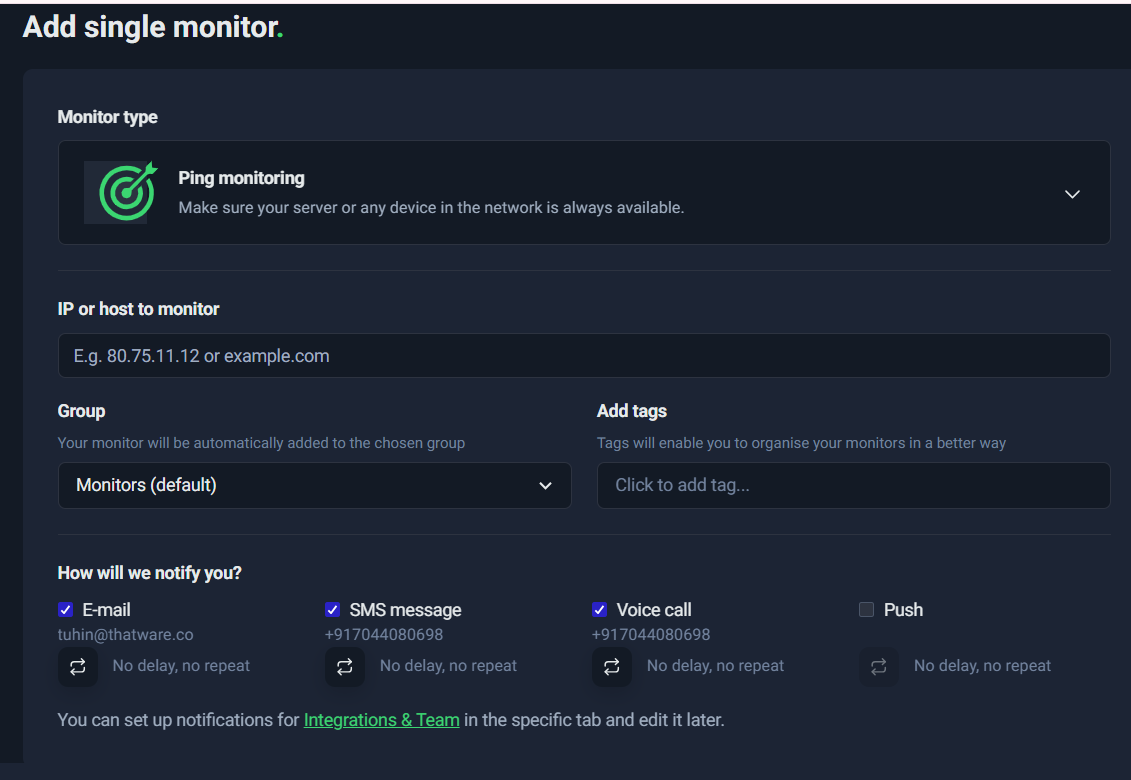
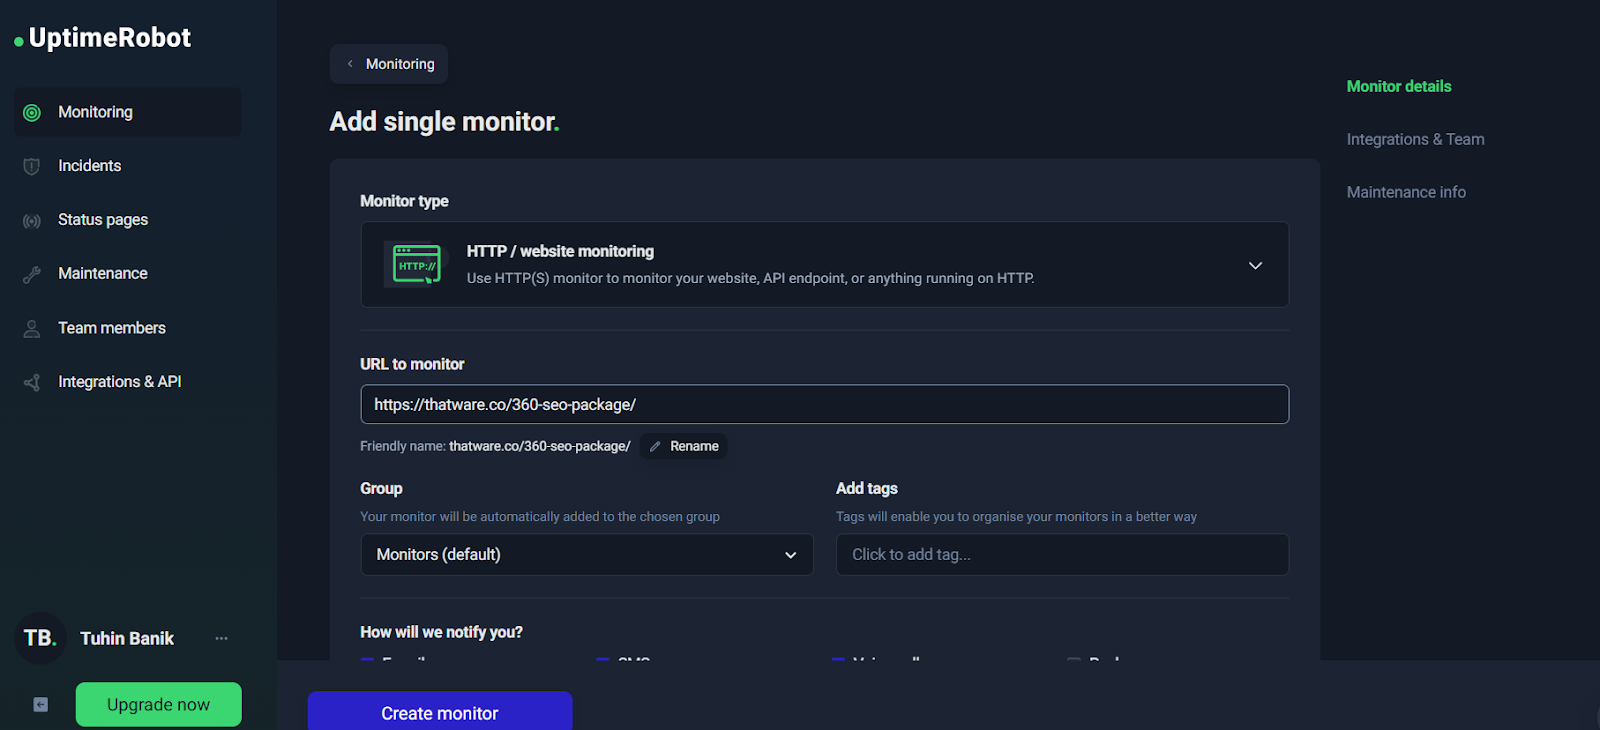
Step-by-Step: Creating an HTTP Monitor (Configuration Walkthrough)
At the start of your monitoring setup, UptimeRobot presents a simple “Add single monitor” interface.

➡️ Add single monitor with URL filled
From here, your most important configuration decisions are:
1) URL to monitor
Choose a URL that represents real user experience. For example:
- Homepage: https://example.com/
- Landing page: https://example.com/service/
- Contact page: https://example.com/contact-us/
- API health check: https://api.example.com/health
A best practice is to monitor at least 2–3 critical pages, not just the homepage.
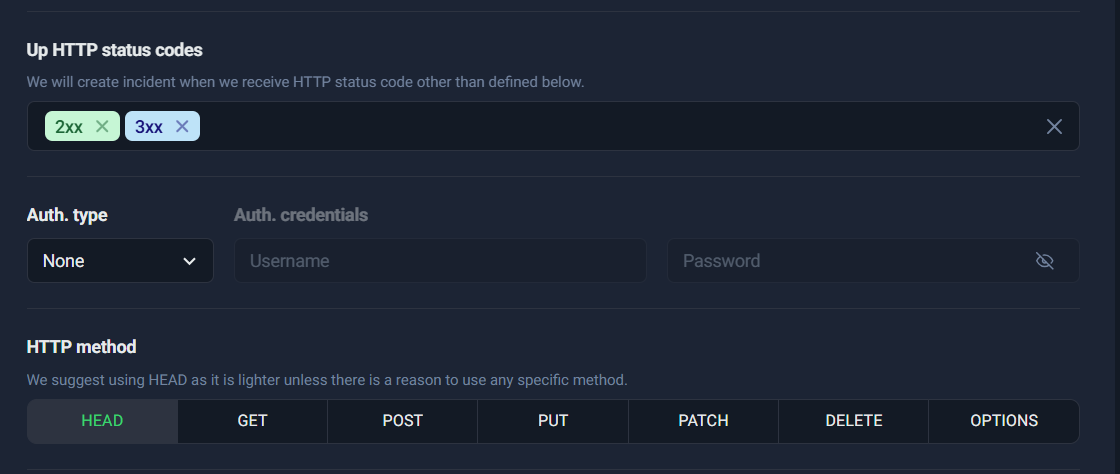
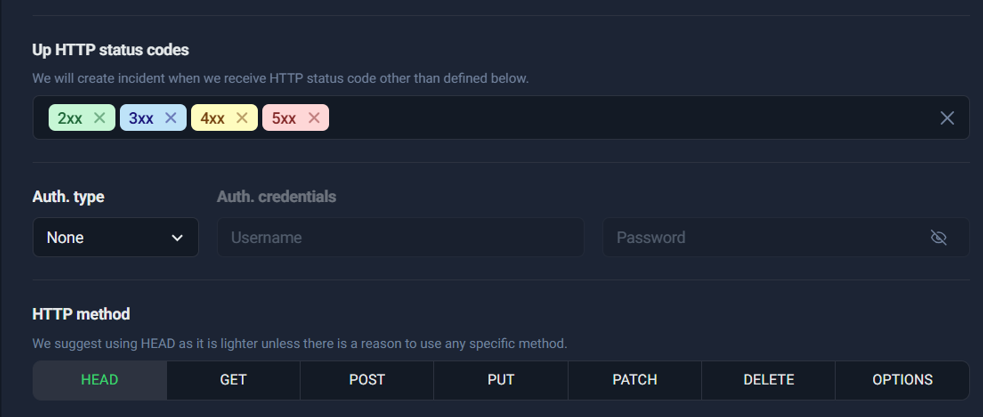
2) Up HTTP status codes
This is where you define what “Up” means.
For most websites:
- ✅ Keep 2xx
- ✅ Keep 3xx
- ❌ Do not treat 4xx/5xx as “Up” unless you have a very specific reason (rare)
Treating 4xx/5xx as “Up” can hide real failures. A site returning 500 is not healthy—even if the server technically responded.
3) Auth type (optional)
If the page is protected (basic auth), you can configure credentials. For public pages, keep auth as None.
4) HTTP method (HEAD/GET/POST/etc.)
This choice affects how UptimeRobot checks your URL. In most cases, you’ll use HEAD or GET.

➡️ HTTP status codes + method tabs
This screenshot is perfect to illustrate:
- status code selection (2xx/3xx)
- auth settings
- HTTP method tabs (HEAD, GET, POST, PUT, PATCH, DELETE, OPTIONS)
HEAD vs GET (and when to use each)
Choosing the right HTTP method is one of the easiest ways to reduce false alerts and improve monitoring accuracy.
HEAD — Lightweight and Fast (Best for Uptime Checks)
HEAD requests ask the server for headers only, not the full page body.
That makes HEAD:
- faster
- lighter on bandwidth
- less load on your server
✅ Use HEAD when:
- you only care about “is the page responding?”
- you don’t need to validate page content
- you want efficient frequent checks (like every 1 minute)
This is why UptimeRobot often recommends HEAD by default.
GET — Full Content Fetch (Best for Content/Keyword Verification)
GET requests fetch the full response content (HTML/JSON/etc.). It’s heavier than HEAD, but necessary in some cases.
✅ Use GET when:
- the server doesn’t support HEAD properly
- you want to monitor content-dependent behaviors
- you’re doing keyword/content validation (or pairing with keyword monitoring logic)
- your endpoint only works correctly when fully requested
Example: Some systems return different behavior for HEAD vs GET. If HEAD returns 403 but GET returns 200, choose GET.
POST / PUT / PATCH — Advanced / Special Cases
These methods are usually not needed for standard uptime monitoring. They are useful when:
- you’re monitoring a specific API workflow that requires a request body
- you have internal endpoints designed for monitoring checks
- your health checks require authentication or payloads
For most websites and marketing pages:
- stick to HEAD or GET

Practical Recommendation
If you want the simplest, most reliable configuration:
- For standard websites:
✅ HTTP monitor + HEAD + Up codes: 2xx/3xx
- For pages where content correctness matters (like “Contact Us” forms, checkout pages, or key landing pages):
✅ Consider GET (and/or add Keyword monitoring separately)
This approach gives you a strong base: uptime coverage + the option to expand into content validation.
Keyword Monitoring
Keyword monitoring exists for one big reason: a website can return “200 OK” and still be broken. Traditional uptime checks only confirm that a server responded. But in real life, many failures are “soft failures,” where the page loads something—just not the correct thing.
Think of situations like these:
- Your server is up, but the page is showing a maintenance message.
- A plugin/theme update causes your landing page to display an error banner.
- Your CDN or WAF returns an “Access Denied” page while still responding with 200.
- The page redirects to a generic fallback, or the content loads without the critical section that matters for conversions.
- Your checkout/contact form page loads, but the form block fails to render.
In each of these cases, basic HTTP monitoring might say “Up,” because the server responded successfully. But from a business point of view, the page is not functioning the way you need it to.
That’s exactly where Keyword Monitoring helps.
What Keyword Monitoring checks
With Keyword Monitoring, UptimeRobot checks the response body (the HTML or JSON returned by the page) to verify one of two things:
- Presence check: A specific keyword/text must exist on the page.
- Absence check: A specific keyword/text must not exist on the page (useful for detecting error messages or unwanted states).
So instead of only asking “Is the site up?”, you’re asking:
“Is the site up and showing the right content?”
Practical examples
Here are realistic keyword monitoring use-cases you can implement immediately:
1) Landing pages: Confirm the main conversion content is present
If you have a service page like /360-seo-package/, you can monitor for a unique phrase such as:
- “360 SEO”
- “ThatWare”
- “SEO Package”
If that phrase disappears due to a page builder issue, template crash, or incorrect redirect, you’ll get alerted even if the page returns 200.
2) Contact pages: Make sure the “Contact Us” section actually loads
For pages like /contact-us/, you can check for:
- “Contact Us”
- “Get in Touch”
- “Submit”
This is especially useful when your contact form is embedded via a plugin or script that sometimes breaks silently.
3) Error detection: Alert when the page contains error keywords
Sometimes the best “keyword” is an indicator of failure. For example, you can monitor for the absence of:
- “Error”
- “Something went wrong”
- “404”
- “Access denied”
- “Forbidden”
- “maintenance”
- “temporarily unavailable”
This helps detect those nasty moments when a page is technically reachable, but is effectively unusable.
Why Keyword Monitoring is ideal for funnels and high-value pages
Keyword Monitoring isn’t necessary for every page on your site. It’s most powerful when used on pages that directly impact leads and revenue, such as:
- Service landing pages (high intent)
- Pricing pages
- Contact forms
- Checkout pages (if applicable)
- Appointment booking pages
- Lead magnets and signup pages
These are the pages where “Up but broken” equals lost conversions.
A good practical approach is:
- Use HTTP monitoring for broad uptime coverage (homepage, major pages).
- Add Keyword monitoring only for the most important funnel pages where content correctness matters.
Ping Monitoring
Ping monitoring is one of the simplest and most foundational forms of uptime monitoring. It operates at the network level, checking whether a specific host (IP address or domain name) is reachable from the internet. In other words, it answers a basic but critical question:
“Is this server reachable right now?”
When you configure a Ping monitor in UptimeRobot, the system sends periodic ICMP echo requests (commonly known as “pings”) to the target host. If the host responds within the configured timeout window, it is marked as Up. If it fails to respond, it is marked as Down, and your notification workflow is triggered.
What Ping Monitoring Actually Checks
Ping monitoring verifies:
- Network-level connectivity
- DNS resolution (if you use a hostname instead of an IP)
- Server availability at the infrastructure layer
- Basic routing functionality
It does not check:
- Website content
- Application logic
- Database connectivity
- Service ports (like HTTP, SMTP, etc.)
It strictly confirms whether the server or device responds to network-level requests.
When Ping Monitoring Is Useful
Ping monitoring is especially valuable in the following scenarios:
1. Monitoring Server IP Addresses
If you manage a VPS, dedicated server, or cloud instance, ping monitoring ensures the machine itself is reachable.
Example:
- 192.124.249.168
- mailstore1.secureserver.net
2. Monitoring Email Infrastructure (Basic Layer)
If your domain’s MX record points to a mail server (such as mailstore1.secureserver.net), ping monitoring can confirm that the mail host is reachable at the network level.
This helps you detect:
- Hosting outages
- Data center routing issues
- Infrastructure downtime
3. Monitoring Routers, Gateways, or Network Devices
For internal infrastructure teams, ping monitoring can verify availability of:
- Routers
- Firewalls
- Load balancers
- On-prem servers
4. Quick Basic Availability Checks
Ping is lightweight and fast. It’s ideal when you want a minimal-overhead way to confirm whether a host is online.
Example: Setting Up a Ping Monitor
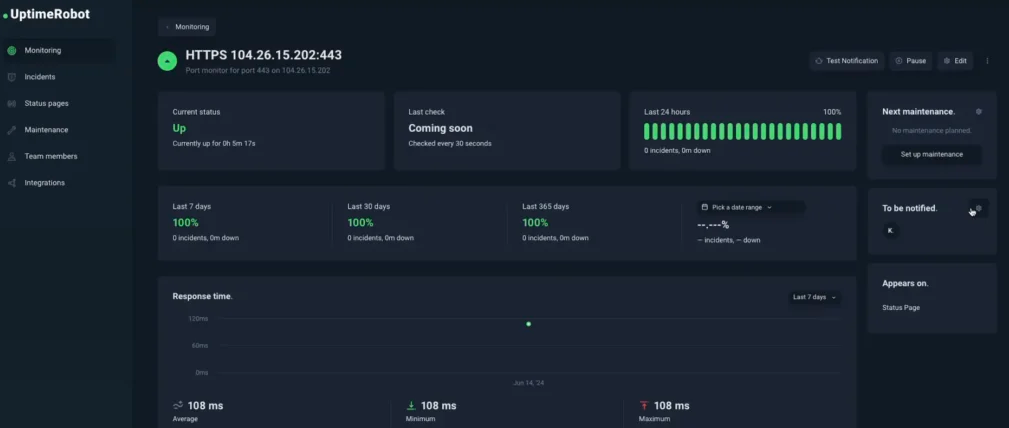
In the screenshot below, a Ping monitor is configured for:
Host: mailstore1.secureserver.net
This means UptimeRobot will periodically check whether that mail server is reachable.

This setup ensures that if the mail server becomes unreachable at the infrastructure level, you will receive an alert immediately.
Limitations of Ping Monitoring
While Ping monitoring is useful, it has important limitations.
1. Firewalls May Block ICMP
Some hosting providers block ICMP traffic for security reasons. In such cases:
- The server may be fully operational
- But ping will fail
- Resulting in false downtime alerts
If ping consistently fails but services are running, this may be the reason.
2. Ping Does NOT Confirm Services Are Running
A server can respond to ping but still have critical services down.
For example:
- Server responds to ping ✅
- But Apache/Nginx crashed ❌
- Website is inaccessible ❌
Or:
- Mail server responds to ping ✅
- But SMTP port 25 is closed ❌
- Emails fail ❌
Ping only confirms:
“The machine is alive.”
It does not confirm:
“The service you care about is working.”
Best Practice: Combine Ping with Port Monitoring
To improve reliability:
- Use Ping monitoring to verify host availability.
- Add Port monitoring (e.g., 443 for HTTPS, 25/587 for SMTP) to confirm service-level functionality.
This layered approach gives you:
- Infrastructure visibility (Ping)
- Service-level assurance (Port)
When to Use Ping vs HTTP Monitoring
Use Ping when:
- You are monitoring a raw server or network device.
- You want low-level availability checks.
- You are monitoring infrastructure components.
Use HTTP monitoring when:
- You want to confirm website or API availability.
- You care about status codes and response times.
In most production environments, Ping monitoring is a supporting monitor, not the only monitor.
Port Monitoring
One of the most common misconceptions in infrastructure monitoring is this:
“If the server is up, everything is fine.”
That’s not always true.
A server can respond to ping (meaning it’s reachable on the network), yet the actual service running on it may be completely broken. This is exactly where Port Monitoring becomes critical.
Why Port Monitoring Matters
Ping monitoring checks whether a server responds to ICMP requests. It tells you:
- The machine is reachable.
- The network path is working.
- The host is not completely offline.
But ping does not tell you:
- Whether the web server (Apache/Nginx) is running.
- Whether the database service is accepting connections.
- Whether SMTP is listening.
- Whether SSH is available for access.
This means you could have:
- A server that responds to ping ✔
- But port 443 (HTTPS) is closed ❌
- Or port 3306 (MySQL) is down ❌
- Or SMTP has crashed ❌
From a business perspective, that’s downtime — even though ping says everything is “up.”
Port monitoring solves this gap by checking whether a specific TCP port is open and accepting connections.
How Port Monitoring Works
When you configure a Port Monitor in UptimeRobot, it:
- Attempts to establish a TCP connection to the specified host.
- Checks if the defined port responds.
- Marks the monitor as “Up” if the port is reachable.
- Triggers an alert if the port is closed, filtered, or unreachable.
This gives you service-level validation instead of just server-level validation.
Common Port Monitoring Use Cases
Here are some practical examples:
🔐 Port 443 – HTTPS
- Ensures your secure website is actually serving traffic.
- Detects cases where Nginx/Apache crashes but the server stays online.
🔑 Port 22 – SSH
- Confirms you can remotely access your server.
- Critical for DevOps and emergency access.
📧 Port 25 or 587 – SMTP
- Ensures your email service is accepting outgoing mail.
- Especially important if you rely on email for:
- Lead notifications
- Transactional emails
- Password resets
🗄 Port 3306 – MySQL
- Confirms the database service is listening.
- Useful for backend-heavy applications.
Each of these ports represents a business function, not just a technical endpoint.
Port Monitoring + Ping Monitoring = Complete Coverage
Ping monitoring tells you:
“The server is alive.”
Port monitoring tells you:
“The service is alive.”
Used together, they give you layered protection:
| Scenario | Ping | Port | Result |
| Server offline | ❌ | ❌ | Full outage |
| Server up, service down | ✔ | ❌ | Service outage detected |
| Everything healthy | ✔ | ✔ | Fully operational |
This layered approach dramatically reduces blind spots.
When Should You Use Port Monitoring?
You should add port monitoring if:
- You manage your own VPS or dedicated server.
- You rely on SMTP or database services.
- You want deeper validation than HTTP alone.
- You need infrastructure-level visibility.
For managed hosting or SaaS-only setups, HTTP monitoring may be enough. But if you control the infrastructure, port monitoring is strongly recommended.
In short, Port Monitoring ensures you’re not just checking if the building lights are on — you’re checking whether the machines inside are actually running.
Cron Job / Heartbeat Monitoring (Reverse Monitoring That Catches Silent Failures)
Most uptime checks work like this: UptimeRobot pings your site, and if your site doesn’t respond, it alerts you. That’s perfect for websites and APIs—but it doesn’t solve a common “silent failure” problem:
- Your backup job stops running
- A data pipeline fails midway
- A scheduled CRM sync doesn’t execute
- A lead form processor stops pushing submissions to email/CRM
- A server is “up,” but a background worker is dead
In these cases, your website might look fine, but critical business workflows can be broken for hours (or days) without anyone noticing.
That’s exactly where Cron Job / Heartbeat Monitoring shines.
The Reverse-Checking Model (How Heartbeat Monitoring Works)
Heartbeat monitoring flips the usual approach:
- Instead of UptimeRobot checking your system…
- Your system checks in with UptimeRobot by hitting a special heartbeat URL.
Think of it like a “I’m alive” signal.
If your app/job/script fails to send the heartbeat within the expected time window, UptimeRobot assumes something is wrong and triggers an incident.
This model is ideal for anything that should run regularly in the background—especially tasks where “no output” is the failure.
Where Heartbeat Monitoring Is Perfect
Heartbeat monitoring is best for scheduled or repeatable workflows such as:
- Backups (database backups, file backups, snapshots)
- ETL / pipelines (data ingestion, exports, analytics jobs)
- Scheduled syncs (CRM sync, inventory sync, email marketing sync)
- Queue workers (background job processors)
- Lead form processors (submit → store → notify → push to CRM)
- Recurring reporting (weekly/monthly dashboards, invoice generation)
A simple way to decide:
If the right behavior is “this must run on time,” then heartbeat monitoring is the right monitor type.
Creating a Heartbeat Monitor

When you create a Heartbeat monitor, you’ll typically configure:
1) Monitor name (What do you want to monitor?)
Name it based on a business workflow, not a technical detail. Examples:
- “Lead Form Processor”
- “Daily DB Backup”
- “CRM Sync (Hourly)”
- “Blog-to-Newsletter Automation”
Good names make it immediately clear what broke when an alert happens.
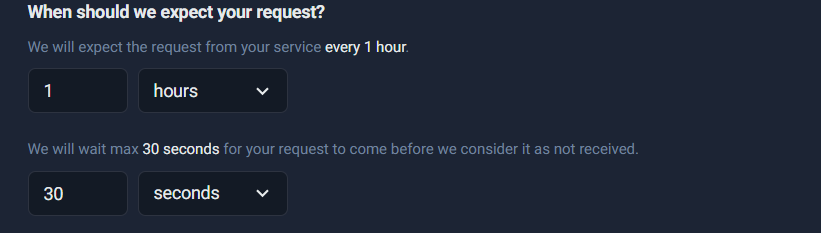
2) Expected interval (When should we expect your request?)
This tells UptimeRobot the rhythm of your job. Example:
- every 15 minutes
- every 1 hour
- every 24 hours
If UptimeRobot doesn’t receive a ping within that interval, it flags a potential failure.
3) Grace period / max wait (How long should we wait before considering it not received?)
This is the buffer around your expected interval. It exists because real systems have jitter:
- cron delays
- server load
- job queue backlog
- API rate limits
- occasional slow runs
Best Practices for Intervals and Grace Windows (Avoid False Alarms)
Heartbeat monitoring is powerful, but you need to set it realistically. Two rules make the difference between “high-signal alerts” and “noisy alerts”:
Best Practice #1: Don’t set overly strict grace windows
A grace window of 30 seconds can be too tight for many real jobs unless you’re absolutely sure execution is consistent to the second.
For example:
- A cron scheduled at :00 might sometimes run at :01 during load.
- A job might take longer occasionally due to backups, database locks, or network latency.
Practical recommendation
- If it’s a job that “must run hourly,” consider a grace period of 2–10 minutes depending on variability.
- If it’s a job that “must run daily,” consider a grace period of 15–60 minutes.
Use small grace windows only when:
- you control the runtime precisely
- the job is lightweight
- false positives are rare and tolerable
Best Practice #2: Choose interval based on business tolerance
Ask: How long can this be broken before it becomes a serious problem?
Examples:
- Lead form pipeline: if leads stop, you might want to know within 15–60 minutes
- Hourly CRM sync: interval 1 hour, grace 5–10 minutes
- Daily backup: interval 24 hours, grace 30–60 minutes
- Weekly report: interval 7 days, grace 2–12 hours
The main point:
Set your heartbeat interval to match the expected schedule, and your grace period to match real-world variability.
Implementation: How Your System “Pings” UptimeRobot
Once you create the Heartbeat monitor, UptimeRobot gives you a unique URL. Your job must call this URL when it completes successfully.

UptimeRobot generally accepts a simple HTTP request (GET or POST) to that URL. You can ping it via:
- a cron script (curl)
- server-side code (PHP/Node/Python)
- automation tools (Zapier, n8n, Make, etc.)
- inside your lead-processing logic
Key implementation tip:
Only ping after success.
If you ping at the start of a job, you can get false “healthy” signals even when the job fails later.
For a lead form flow, a good pattern is:
- form submitted
- validate input
- store lead in DB
- send email / push to CRM
- ping heartbeat URL (only if steps 3–4 succeed)
That way, the heartbeat represents “the workflow actually completed,” not “it merely started.”
Testing Your Heartbeat Monitor
After implementation, you should test at least once to confirm UptimeRobot receives your ping.
A simple initial test is opening the heartbeat URL once in a browser or triggering your script manually.
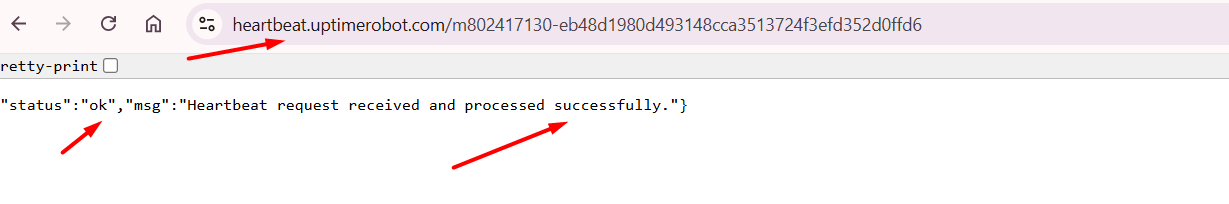
Use this screenshot as “proof-of-test” showing a response like:
- status: ok
- heartbeat request received successfully
Once you see that confirmation, you know:
- your heartbeat URL is correct
- the monitor is ready to detect missed runs
Why Heartbeat Monitoring Matters
Heartbeat monitoring is one of the most “business-protective” tools in UptimeRobot because it catches failures that normal uptime monitoring misses.
Your website can be 100% up… while:
- backups are failing
- leads aren’t reaching your inbox
- scheduled jobs aren’t running
- data pipelines are dead
A heartbeat turns those silent failures into immediate, actionable alerts.
If you’re monitoring anything that must run on a schedule, heartbeat monitoring is often the difference between “we found it days later” and “we fixed it within the hour.”
DNS Monitoring
DNS monitoring is one of the most underrated but critical layers of infrastructure monitoring. While most people focus on whether a website loads or whether a server responds, DNS (Domain Name System) is the foundation that makes that connection possible in the first place. If DNS fails or is misconfigured, your website, email, APIs, and subdomains can all become unreachable — even if your server itself is perfectly healthy.
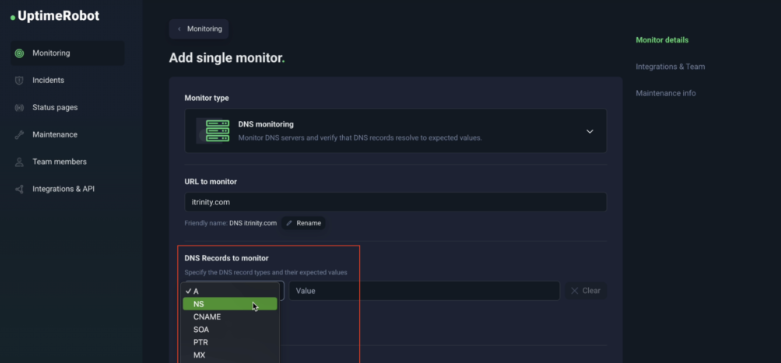
What DNS Monitoring Checks
DNS monitoring verifies that your domain’s DNS records are resolving correctly and consistently. This typically includes:
- A records (pointing your domain to the correct IP address)
- CNAME records (subdomain aliases)
- MX records (email routing servers)
- TXT records (SPF, DKIM, domain verification, etc.)
- NS records (nameserver configuration)
When DNS monitoring is enabled, UptimeRobot checks that your domain resolves to the expected values. If the record changes unexpectedly, fails to resolve, or points to an incorrect destination, you are alerted immediately.
👉
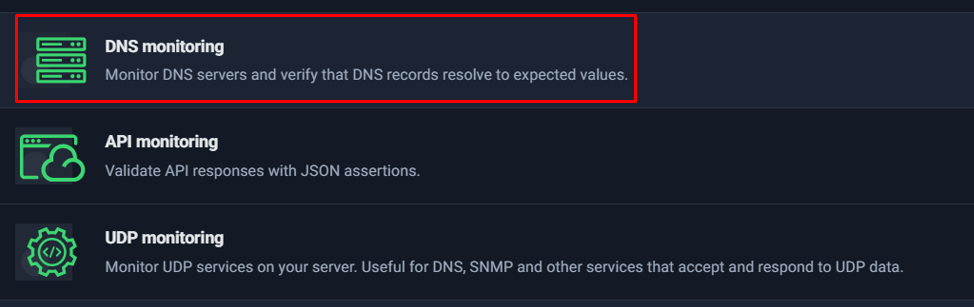
Selecting DNS monitoring from the monitor type list in UptimeRobot.
Why DNS Monitoring Matters
DNS misconfiguration is one of the fastest ways to create full-scale downtime.
Common real-world scenarios include:
- Changing hosting providers but forgetting to update A records
- Incorrect nameserver changes at the registrar
- Expired domain causing DNS to stop resolving
- Accidental record edits during maintenance
- Propagation issues after updates
- Malicious DNS hijacking or unauthorized changes
In these cases, your server may still be running perfectly, but users cannot reach it because the domain no longer resolves correctly. From the user’s perspective, your site is simply “down.”
This is especially critical for:
- Production websites
- E-commerce stores
- SaaS platforms
- Email infrastructure (MX records)
- Branded subdomains (e.g., app.yoursite.com)
Without DNS monitoring, you may not realize there is a problem until customers report it — which could be hours later.
When Should You Use DNS Monitoring?
DNS monitoring is highly recommended if:
- You manage multiple domains
- You rely heavily on email delivery
- You frequently update DNS records
- You operate in a high-availability environment
- You want early detection of unauthorized changes
It acts as a safeguard against silent failures that traditional HTTP monitoring alone cannot detect.
In a well-designed monitoring setup, DNS monitoring complements HTTP, Ping, and Port monitoring to create a complete visibility layer — from domain resolution all the way down to server and service health.
API Monitoring
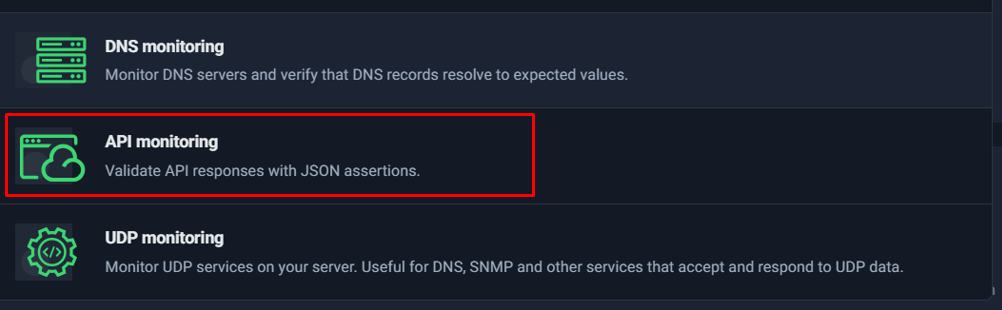
When monitoring modern websites and applications, checking whether a page returns HTTP 200 OK is no longer enough. Many systems today are API-driven—your frontend, mobile app, CRM sync, payment gateway, lead processing pipeline, or internal automation may all depend on API responses rather than traditional webpages.
This is where API Monitoring in UptimeRobot becomes significantly more powerful than standard HTTP monitoring.
Why API Monitoring Is Different from HTTP Monitoring
At first glance, HTTP and API monitoring may seem similar. Both send a request to an endpoint and evaluate the response. However, the difference lies in how deeply the response is validated.
Standard HTTP Monitoring
- Checks response status (e.g., 200, 301)
- Measures response time
- Can optionally check headers
- Does not deeply inspect JSON logic by default
This works well for websites.
But APIs are different.
The Hidden Problem: “200 OK” Can Still Mean Failure
An API can return:
{
“status”: “error”,
“message”: “Database connection failed”
}
And still respond with:
HTTP/1.1 200 OK
From a basic HTTP monitor perspective:
✔ Status code = 200
✔ Server responded
✔ System marked as UP
But in reality:
❌ The application logic failed
❌ Data is not processed
❌ Business functionality is broken
This is known as logical failure with technical success.
And this is exactly where API monitoring solves the problem.
What API Monitoring Adds
API monitoring allows you to:
- Validate JSON response bodies
- Apply assertions to specific fields
- Confirm expected values exist
- Detect logic failures even when HTTP status is 200
Instead of just checking “Did it respond?”, you check:
“Did it respond correctly?”
Example: Monitoring a Lead Processing API
Imagine you have an endpoint:
https://yourdomain.com/api/lead/submit
A correct response might be:
{
“status”: “success”,
“code”: 200,
“lead_id”: “83472”
}
With API monitoring, you can define assertions like:
- status == “success”
- code == 200
- lead_id exists
If the API returns:
{
“status”: “error”,
“code”: 500
}
Even if the HTTP response is 200:
🚨 UptimeRobot will trigger an alert.
This dramatically reduces false positives where:
- The server is alive
- But the business function is broken
Common Assertion Examples
Here are practical assertion patterns:
1. Check Success Status
status == “success”
2. Validate Numeric Code
code == 200
3. Confirm Boolean Flags
processed == true
4. Ensure Data Exists
data.user_id exists
5. Detect Error Conditions
status != “error”
These validations make API monitoring suitable for:
- Payment gateways
- CRM sync endpoints
- Subscription systems
- Webhooks
- Microservices communication
- SaaS health endpoints
- Automation pipelines
When Should You Use API Monitoring?
Use API monitoring instead of basic HTTP when:
- Your endpoint returns JSON
- Business logic matters more than page availability
- You rely on APIs for lead handling or transactions
- You want deeper validation than just uptime
- You need production-grade DevOps reliability
For example:
| Use Case | Recommended Monitor |
| Homepage availability | HTTP |
| Check “Contact Us” page content | Keyword |
| Lead submission backend | API |
| Payment confirmation endpoint | API |
| Server reachability | Ping |
| Cron job completion | Heartbeat |
Business Value of API Monitoring
API monitoring reduces:
- False “all good” scenarios
- Hidden logical failures
- Revenue-impacting blind spots
- Late detection of backend errors
It increases:
- Confidence in automation systems
- DevOps observability
- Lead pipeline reliability
- SLA compliance accuracy
In modern application stacks, APIs power everything. Monitoring only HTTP status codes is equivalent to checking if a car engine turns on—without verifying if it actually moves.
API monitoring ensures the system not only responds, but responds correctly.
Screenshot Placement
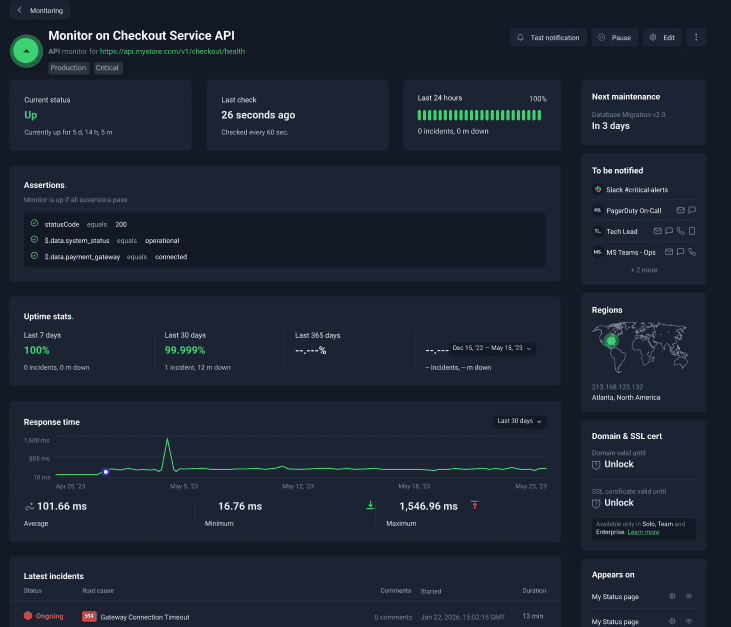
Figure: Selecting API Monitoring to validate JSON responses and assertions instead of only checking HTTP status codes.
If HTTP monitoring answers the question:
“Is the server alive?”
API monitoring answers:
“Is the business logic functioning correctly?”
For production systems, especially those involving payments, leads, or automation workflows, API monitoring is not optional—it’s essential.
UDP Monitoring
Most website owners will never need to think about UDP. However, in infrastructure-heavy environments, UDP monitoring becomes extremely important.
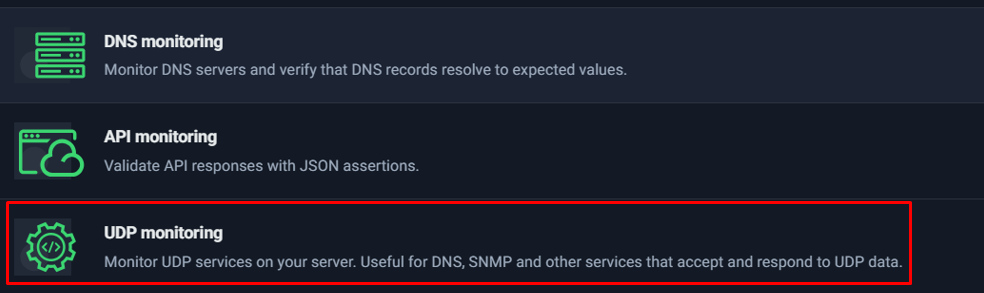
Unlike HTTP, Ping, or Port monitoring (which primarily use TCP or ICMP), UDP monitoring is designed to check services that communicate over the User Datagram Protocol (UDP). UDP is commonly used in systems where speed is prioritized over guaranteed delivery — such as DNS, SNMP, VoIP, streaming services, and certain internal monitoring tools.
What Is UDP Monitoring?
UDP monitoring in UptimeRobot allows you to verify that a UDP-based service:
- Is reachable
- Responds correctly to UDP packets
- Has not silently failed
Since UDP does not establish a formal connection like TCP, failures can be harder to detect without proper monitoring. A service might appear operational from a server perspective but may not be responding correctly to UDP requests.
When Should You Use UDP Monitoring?
UDP monitoring is especially useful for:
- DNS servers (port 53 over UDP)
- SNMP services used in network monitoring
- Custom UDP-based applications
- Internal infrastructure services
- Enterprise-grade systems relying on UDP communication
For example, if your DNS server stops responding to UDP queries, your website may become unreachable even if your web server is still running perfectly.
When You Don’t Need It
If you are running:
- A standard website
- A typical WordPress site
- A SaaS application hosted on shared or managed hosting
- Basic API services over HTTP/HTTPS
Then UDP monitoring is usually not required. HTTP monitoring alone will be sufficient.
Why It Matters in Advanced Setups
In larger infrastructures — especially those managing:
- Dedicated DNS servers
- Enterprise networking equipment
- Hybrid cloud environments
- Internal network appliances
UDP monitoring helps detect silent service failures that traditional HTTP or Ping checks may miss.

Step-by-Step: Create Your First HTTP Monitor
HTTP monitoring is the quickest way to start protecting a website, landing page, or API endpoint. In plain terms: you give UptimeRobot a URL, decide what “healthy” looks like (status codes, timeout, performance threshold), choose how you want to be alerted, and let it continuously check the endpoint for you.
This walkthrough follows the exact flow you’ll see in the UptimeRobot dashboard and uses the screenshots you shared (S1–S21). By the end of this section, you’ll have a working HTTP monitor with sensible defaults—and you’ll also know which settings matter most so you avoid silent failures and false alarms.
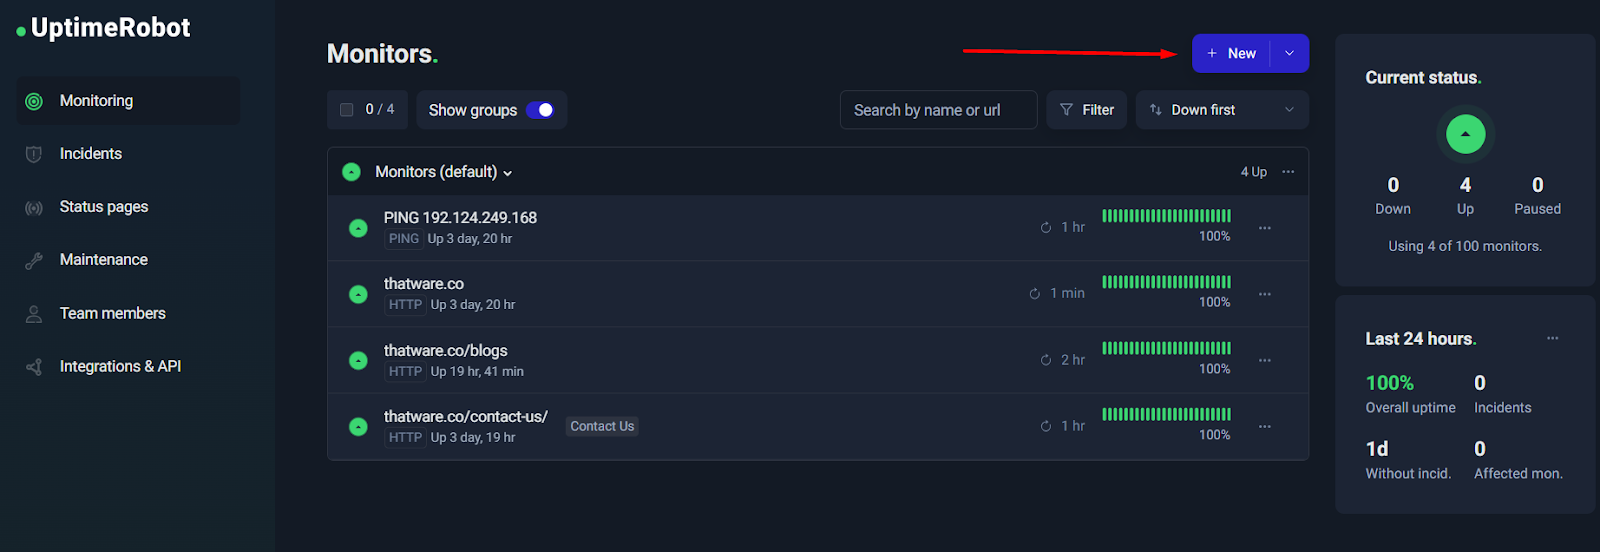
Step 1: Go to Monitoring → New
Open the UptimeRobot dashboard and head to the Monitoring section. On the top-right corner, you’ll see a New button (sometimes shown with a “+” icon). This is your entry point for adding a new monitor.
Why this matters: UptimeRobot supports multiple monitor types (HTTP, Keyword, Ping, Port, Heartbeat, etc.). Starting from New ensures you’re creating the right type and not editing an existing one.

Tip: If you’re managing multiple websites or clients, get into the habit of creating monitors from the dashboard so you can immediately confirm they appear in the correct group and show the correct interval once created.
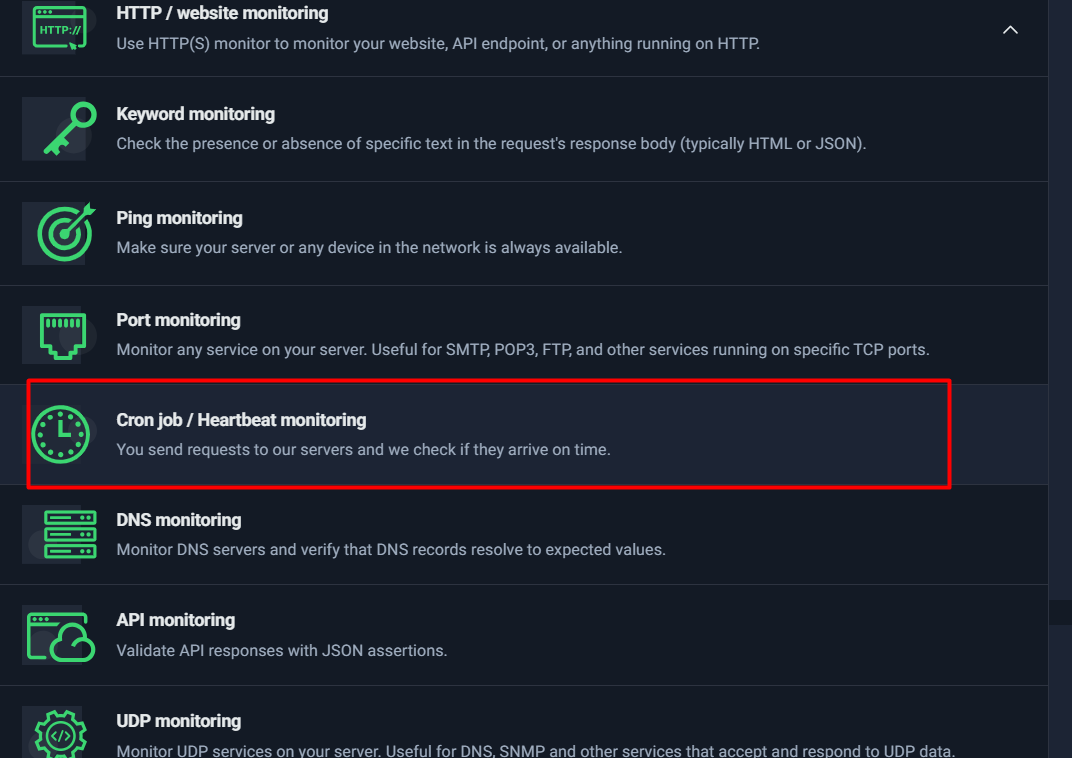
Step 2: Choose “HTTP / Website monitoring”
After clicking New, you’ll be asked to select a monitor type. Choose HTTP / website monitoring. This is the default and best option for:
- Website homepages and landing pages
- Service pages (e.g., SEO package pages)
- Public API endpoints (health checks, status endpoints)
- Any URL that should return a valid HTTP response
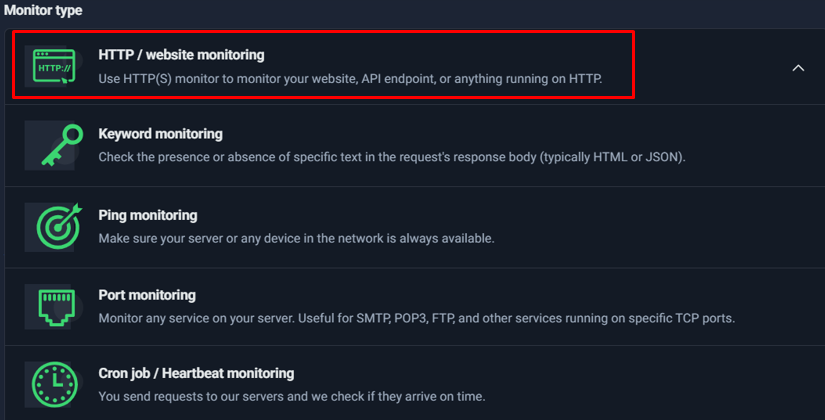
Why HTTP monitoring is the best starting point
HTTP monitoring gives you two major benefits immediately:
- Availability checks (Is the endpoint reachable and responding properly?)
- Response time tracking (Is it “up” but slow?)
This is the foundation. Once you have HTTP monitors in place, you can add deeper checks (Keyword monitoring, API assertions, Heartbeat workflows) without losing your baseline visibility.
Step 3: Enter the URL and name it properly
Now you’ll enter the URL to monitor. This should be the exact page or endpoint you want to track. In your case, you used a specific landing page URL (great approach).
At this step, also focus on:
- Friendly name: Use a clear label that will make sense during an incident.
Examples:- “ThatWare – Homepage”
- “ThatWare – 360 SEO Landing Page”
- “Contact Page – Lead Funnel”
- Group: Use groups to keep monitors organized (e.g., “Monitors (default)”, “Client Sites”, “Critical Pages”).
- Tags: Tags are a powerful way to filter and apply bulk actions later. Useful tags:
- critical
- seo
- lead-funnel
- api
Practical naming rule:
When an alert hits your phone, you should understand what broke in one glance—without opening the dashboard.
Step 4: Set status code rules (IMPORTANT)
This is one of the most important (and most misunderstood) settings.
UptimeRobot decides whether a monitor is “Up” based partly on which HTTP status codes you consider acceptable. For normal website monitoring, the safest configuration is:
✅ Allow: 2xx and 3xx
❌ Do not allow: 4xx and 5xx (in most cases)
Why 2xx + 3xx?
- 2xx means success (200 OK, etc.)
- 3xx means redirect (301, 302)—often normal (www to non-www, http to https, etc.)
Why you usually should NOT allow 4xx/5xx
- 4xx usually means client-side error like “Not Found” (404) or “Forbidden” (403). If your primary page suddenly becomes 404, that’s a real problem.
- 5xx means server-side errors (500, 502, 503). These are classic downtime signals.
If you allow 4xx and 5xx, your monitor can incorrectly stay “Up” even when your site is broken. That defeats the entire purpose of uptime monitoring.
S3 (Good configuration: 2xx + 3xx)
S15 (Bad configuration: includes 4xx + 5xx — show this as a “common mistake” callout)
Common mistake callout (use in your blog formatting):
If you treat 4xx/5xx as “Up”, you may never get alerted during real outages. Always double-check this before saving your monitor.
When might you allow 4xx intentionally?
Only in very specific cases—for example, if you’re monitoring an endpoint that is expected to return a specific 401/403 due to authentication rules. For normal public pages and production funnels, avoid it.
Step 5: Choose method HEAD vs GET
UptimeRobot typically recommends HEAD because it’s lighter. A HEAD request checks the response headers without downloading the full page body.
- Use HEAD when:
- You only care about uptime (server responds correctly)
- You want minimal load on your server
- Switch to GET when:
- You need to verify page content (especially for Keyword monitoring workflows)
- The server doesn’t handle HEAD correctly
- You suspect caching/CDN behavior differs between HEAD and GET
Best practice:
Start with HEAD for uptime. If you see inconsistent results or you’re monitoring content behavior, use GET.
Step 6: Timeout configuration
Timeout determines how long UptimeRobot waits before marking the monitor as down due to no response.
A typical, practical timeout:
- 15–30 seconds for most sites
Why too low is dangerous
If you set the timeout too low (like 1–5 seconds), you’ll get “false downtime” during temporary slowness or minor network hiccups—especially if your site has occasional spikes.

Good default: 30 seconds is a safe starting point for most production websites. You can tighten later once you understand your normal performance.
Step 7: Slow response time alert
This is where you monitor “it’s up, but it’s too slow.”
Slow pages can hurt:
- conversions (people leave)
- SEO (performance impacts user experience signals)
- user trust (“site feels broken”)
Set a realistic threshold to avoid alert fatigue:
- 2000–3000ms (2–3 seconds) for most sites
- 4000–5000ms (4–5 seconds) for heavier pages or content-rich websites

How to choose the right threshold
- If your site normally loads in 1–2 seconds, set threshold around 3000ms so you get alerted only during genuine degradation.
- If your site sometimes spikes, start at 5000ms, watch the response-time graph for a week, then tighten the threshold gradually.
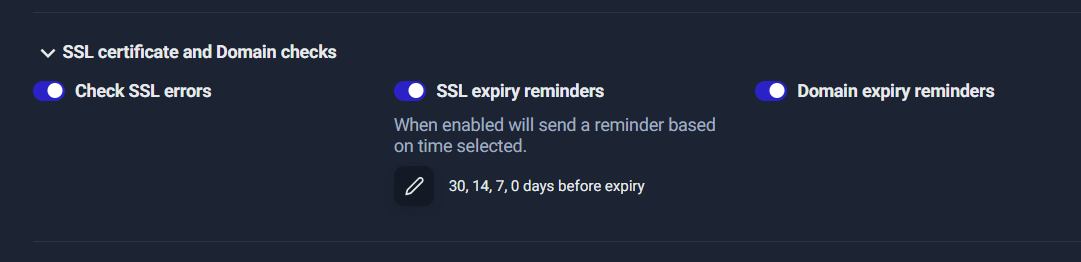
Step 8: SSL & Domain expiry checks (business safety)
Many “mystery outages” aren’t server issues at all—they’re certificate or domain renewal issues.
Enable these to prevent sudden disasters:
- ✅ Check SSL errors
- ✅ SSL expiry reminders (set reminders like 30/14/7/0 days)
- ✅ Domain expiry reminders
Why this is critical
A website can be perfectly hosted and still fail if:
- SSL certificate expires
- domain registration expires
- SSL errors appear due to misconfiguration
These failures are preventable—and this is where UptimeRobot is especially valuable for non-technical teams.
Step 9: Monitor interval & region
This controls how often UptimeRobot checks your URL.
Typical intervals:
- 1 minute for critical pages (homepage, lead funnels, checkout, core services)
- 5 minutes for normal pages and secondary services
- longer intervals for low priority endpoints
Region selection:
- Default (auto-select) is fine for most use cases.
- Choose a specific region only if your users are concentrated in one geography or you’re troubleshooting region-specific issues.
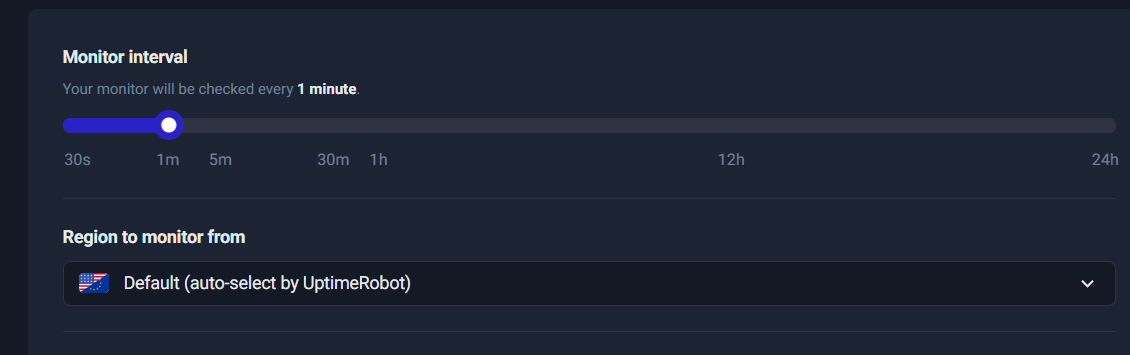
Operational tip:
If you’re running campaigns or lead generation, your landing pages are “critical.” Use 1-minute checks during active campaign windows.
Step 10: Notifications
This is where you decide how you’ll be alerted when something goes down (or gets slow).
A practical notification strategy:
- ✅ Email + Push for most alerts (fast, low-cost, low-noise)
- ⚠️ SMS/Voice only for truly critical monitors (server down, main site down)
Why limit SMS/Voice:
- They can be expensive (credits)
- They can create alert fatigue if too many monitors are configured as “critical”
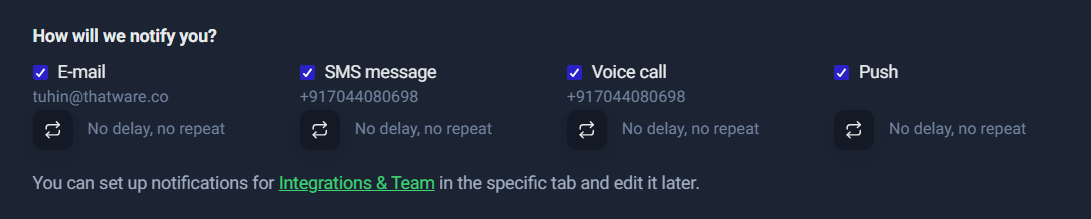
Best practice:
Start with Email + Push for all. Then escalate only the top 1–3 monitors (homepage, lead form endpoint, checkout) to SMS/Voice.
Step 11: Create monitor
Once everything is configured:
- Click Create monitor
- Confirm it appears on the dashboard
- Use Test Notification (if available) to ensure the alert routes work
- Watch the first few checks to confirm the status codes and method behave as expected

Quick verification checklist after creation
- The monitor shows as Up
- Interval is correct (1m, 5m, etc.)
- Status codes are correct (2xx + 3xx for normal pages)
- Slow response alert threshold matches your intent
- Notifications go to the right channels
Wrap-up: What you gain from a properly configured HTTP monitor
Once your first HTTP monitor is live, you immediately get:
- uptime history for that URL
- response time tracking (performance baseline)
- incident alerts when it fails
- early warnings for SSL/domain expiry issues
- a monitoring foundation you can expand into Keyword checks, API validations, and Heartbeat workflows
Step-by-Step: Monitor a Lead Form with Heartbeat
If your business depends on incoming leads, “website uptime” alone isn’t enough. Your site can be fully online while the lead form pipeline quietly fails—no submissions reaching your inbox, CRM, or database. That’s exactly where Heartbeat (Cron job) monitoring shines.
Unlike HTTP monitoring (where UptimeRobot checks your site), Heartbeat monitoring works the other way around:
- Your system pings UptimeRobot
- UptimeRobot confirms the ping arrives on time
- If the ping does not arrive as expected, UptimeRobot creates an incident and alerts you
This section walks you through setting up a Heartbeat monitor specifically for a Lead Form workflow—similar to what you configured.
Create the Heartbeat Monitor
Start by creating a new monitor and selecting the correct monitor type.
What to do:
- Go to Monitoring
- Click New
- In Monitor type, select:
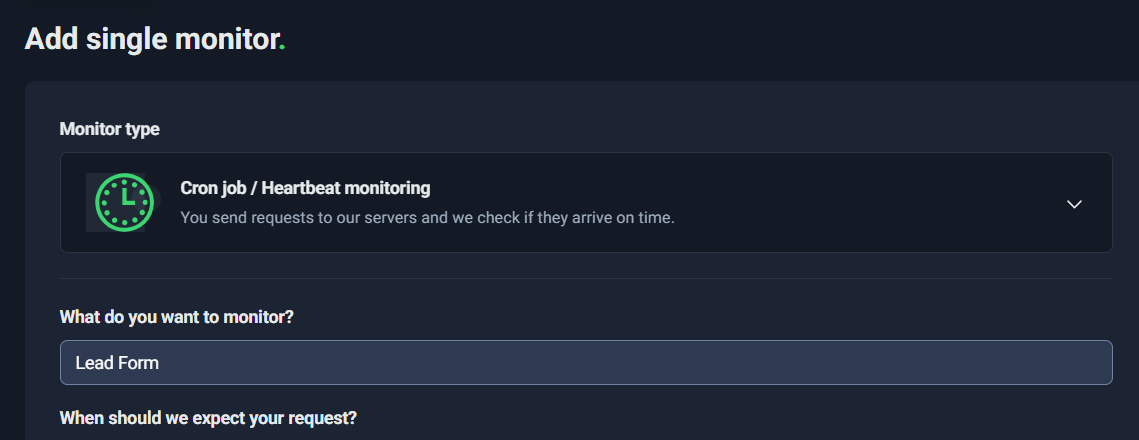
- Cron job / Heartbeat monitoring
- In “What do you want to monitor?”, name it something meaningful like:
- Lead Form
- Lead Pipeline
- Lead Delivery to CRM
The name matters because when an incident happens, your alerts will use this label. “Lead Form” is clear and instantly actionable.
Configure Expected Interval + Grace Window
This step defines the rules for when UptimeRobot should expect your system to check in.
You’ll see a configuration block like:
- We will expect the request from your service every 1 hour
- We will wait max 30 seconds for your request to come before we consider it as not received
What “expect every 1 hour” really means
This means: UptimeRobot starts a timer and expects at least one heartbeat ping within each 1-hour window.
- If your system pings every hour (or more frequently), everything stays “Up”
- If a ping doesn’t arrive in time, UptimeRobot flags it as an incident
This is ideal for workflows that run on a schedule, such as:
- sending lead notifications every hour
- syncing leads to a CRM every hour
- processing queued form submissions every hour
What the “grace window” / “wait max” means
The grace window is the extra “buffer” time UptimeRobot allows after the expected time passes.
If your expected interval is 1 hour and your grace is 30 seconds:
- UptimeRobot expects the ping by the deadline
- it will wait an extra 30 seconds
- then it triggers an alert if nothing arrives
Best practice: choose a realistic grace window
A 30-second grace can be too strict for many real-world systems. Jobs can slip because of:
- server CPU spikes
- queue backlog
- network hiccups
- a deployment restarting services
- temporary DNS resolution delays
A safer starting point:
- Grace window: 2–5 minutes
This reduces false alarms while still detecting real failures quickly.
Where to insert screenshot:

Copy the Heartbeat URL
Once the Heartbeat monitor is created, UptimeRobot gives you a unique URL like:
https://heartbeat.uptimerobot.com/<unique-id>
This is the only thing your system needs to send as a “check-in” signal.
Think of it as:
✅ “Lead pipeline ran successfully.”
You’ll usually see it under something like “URL to ping us”, often with a Copy to clipboard button.

Implement It in Real Life
This is the most important part: Heartbeat monitoring only works if a real system pings the URL.
If you only open the URL manually in a browser, the monitor will look fine during testing—but it won’t protect your lead pipeline long-term.
Here are the best real-life implementation patterns.
Option A: Ping after successful form processing
Use this when you control the backend or the integration workflow.
Logic:
- Only ping UptimeRobot after the lead is:
- validated
- stored (DB/Sheets/CRM)
- and notification email/CRM push succeeded
If the process fails, no ping is sent → you get alerted.
Option B: Ping at the end of a scheduled cron job
Use this when leads are queued and processed in batches.
For example:
- Every 15 minutes or 1 hour, a cron job runs:
- fetch new submissions
- push to CRM
- send notifications
- clean up queue
- After it finishes successfully → send heartbeat ping
Option C: Only ping on success (recommended)
This is critical.
If you ping even when the job fails, UptimeRobot will think everything is healthy.
Heartbeat should represent:
✅ “The lead pipeline is actually working.”
Minimal code examples
Linux / Cron (curl):
curl -fsS https://heartbeat.uptimerobot.com/<your-id> > /dev/null
PHP (after successful processing):
@file_get_contents(“https://heartbeat.uptimerobot.com/<your-id>”);
Node.js (fetch):
await fetch(“https://heartbeat.uptimerobot.com/<your-id>”);
Python (requests):
import requests
requests.get(“https://heartbeat.uptimerobot.com/<your-id>”, timeout=10)
Tip: In production, log failures to ping UptimeRobot, but don’t block your lead pipeline if the heartbeat call fails.
Test It
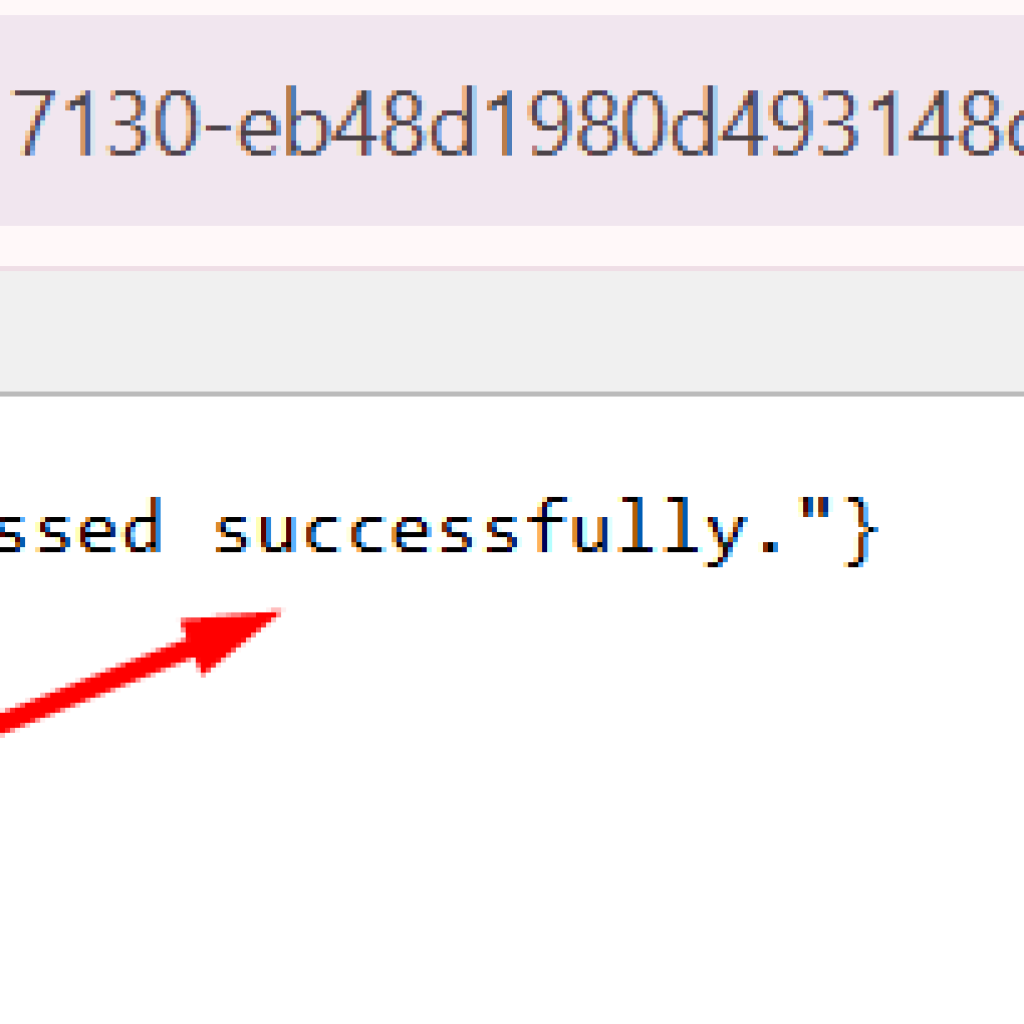
During testing, it’s okay to paste the heartbeat URL in a browser. When it works, you’ll see a confirmation response like:
- status: “ok”
- message similar to: “Heartbeat request received and processed successfully.”
This confirms:
- the URL is valid
- UptimeRobot received your ping
- the monitor is wired correctly
Important note: Browser testing is for verification only.
The real protection comes from automated pings from your pipeline.
Set the Interval Smartly
This is where many people get tripped up.
Your heartbeat interval must match how often your system actually runs.
If you set:
- expected interval = 2 hours
but your lead processing runs: - every 15 minutes
then you’ll discover failures late.
If you set:
- expected interval = 15 minutes
but your job sometimes runs late due to load
you might get false alerts unless your grace window is realistic.
Choose interval based on business tolerance
Ask: “How quickly do I need to know lead capture is broken?”
Common choices:
- 15 minutes: high urgency, sales teams active, high lead volume
- 30 minutes: good balance for most teams
- 60 minutes: acceptable for lower volume or off-peak workflows
- 2 hours: only if delays are tolerable (often too slow for lead capture)
If leads are important, avoid long intervals. Losing 2 hours of leads can be expensive.

Quick Checklist: Heartbeat Monitoring for Lead Forms
- ✅ Monitor type: Cron job / Heartbeat
- ✅ Name: “Lead Form” or “Lead Pipeline”
- ✅ Expected interval matches your processing schedule
- ✅ Grace window set realistically (start 2–5 minutes)
- ✅ Heartbeat URL is called automatically (not manually)
- ✅ Ping happens only after success
- ✅ Test once in browser, then test via real script/job
Step-by-Step: Monitor Email Infrastructure via MX + Ping/Port
Email is often the “silent revenue pipeline” behind a business—leads, contact-form notifications, invoices, password resets, onboarding emails, outreach campaigns. The problem is that email failures don’t always show up as obvious website downtime. Your site can be 100% up, while emails quietly stop flowing because the mail server (or the SMTP service) is unreachable.
This section shows a practical, layered way to monitor email infrastructure using:
- MX record lookup (to identify the real mail servers behind your domain)
- Ping monitoring (to check basic reachability)
- Port monitoring (to confirm the actual email service is available)
Find the mail server using an MX lookup
Before you monitor anything, you need to identify which mail servers actually handle email for your domain. That information is stored in your domain’s MX records (Mail Exchange records). MX records tell the world: “When someone sends email to @yourdomain.com, deliver it to these servers.”
A fast, visual way to confirm MX records globally is to use a DNS propagation checker like whatsmydns.net.
What to do
- Open whatsmydns.net.
- Enter your domain (example shown: thatware.co).
- Choose record type MX from the dropdown.
- Click Search.
You’ll see results from multiple locations (countries/ISPs). This matters because DNS updates and issues can appear in one region before another.
What you’re looking for
- One or more MX hosts like:
- mailstore1.secureserver.net
- smtp.secureserver.net
- MX entries usually have priority numbers (like 0, 10, 20). Lower number generally means higher priority for delivery.
In your example, the MX lookup confirms the mail service provider (SecureServer / GoDaddy-style infrastructure) and shows the mail endpoints your domain relies on.
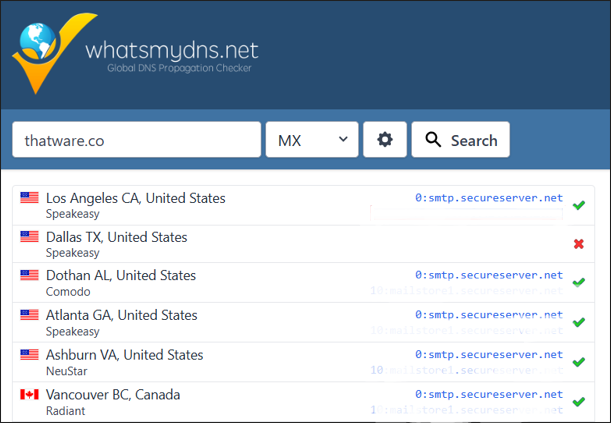
MX lookup confirms the mail servers used by the domain (e.g., mailstore1.secureserver.net and smtp.secureserver.net).
Why this step matters
If you skip MX discovery, you may accidentally monitor the wrong thing (like your web hosting server) while your email is handled elsewhere. MX lookup ensures your monitoring targets the exact infrastructure that controls email delivery for your domain.
Create a Ping monitor for the MX host
Now that you know your MX host(s), the first monitoring layer is Ping monitoring.
Ping monitoring checks whether a host is reachable over the network. It’s not “email-aware,” but it’s still valuable because it can catch:
- provider-level outages
- routing problems
- DNS issues causing the hostname to fail
- broad network unreachability
Step-by-step: Add a Ping monitor
- In UptimeRobot, click New → Add single monitor.
- Select Ping monitoring.
- In IP or host to monitor, paste your MX hostname, for example:
- mailstore1.secureserver.net

Ping monitoring setup screen—add a host/IP and choose notifications.
- Choose a Group (optional but recommended), such as:
- “Email Monitoring”
- “Infrastructure”
- or your default monitor group
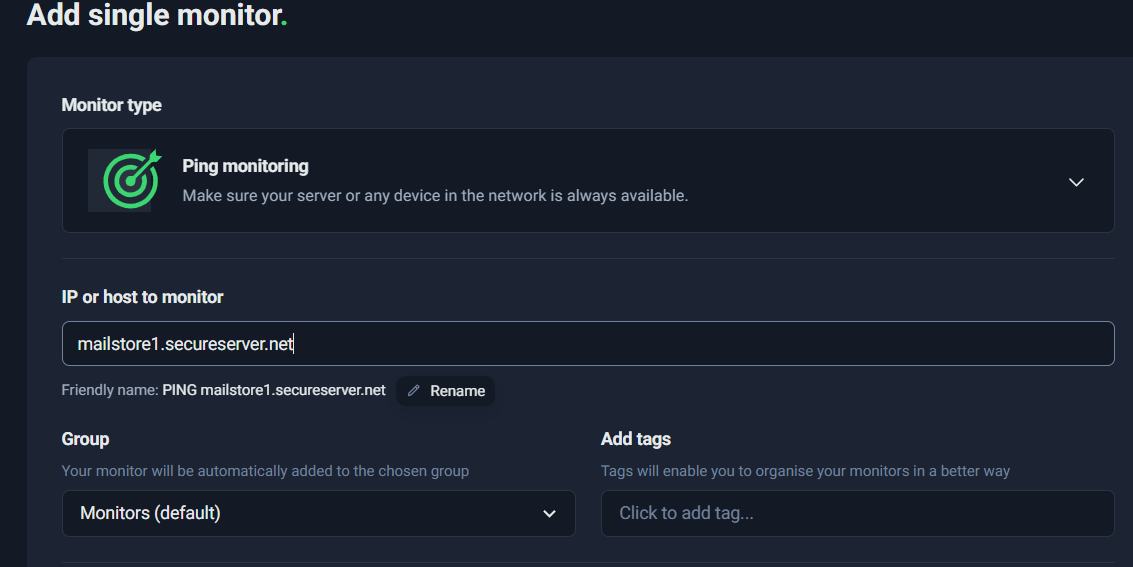
Creating a Ping monitor for the MX host to verify basic reachability.
- Add tags (optional but helpful for scaling), e.g.:
- mx
- critical
- In How will we notify you?, select alert channels (email is the usual baseline; SMS/voice for critical escalation).
What Ping will (and won’t) tell you
Ping monitoring answers a simple question:
“Can I reach this host on the network?”
That’s useful, but it’s only Layer 1 of email monitoring. The host might respond to ping while the email service itself is broken—or the host might block ping entirely while email still works. That’s why we add Port monitoring next.
Add Port monitoring for SMTP
If Ping is “is the server reachable,” then Port monitoring is “is the service actually available.”
Email sending relies on SMTP, and SMTP runs on specific network ports. The common ones are:
- 25: traditional SMTP (server-to-server delivery)
- 587: SMTP submission (often used by apps, email clients, and authenticated sending)
- (Sometimes 465 for SMTPS, depending on provider—optional)
Why Ping isn’t enough
Here’s what can happen in the real world:
- The mail server host is up and reachable (Ping OK)
- But SMTP is down (port closed, service crashed, provider incident)
- Your website forms stop sending emails, alerts don’t arrive, password resets fail
- You only find out hours later
Port monitoring catches these “service down” cases because it checks whether the SMTP port is open and responding.
Step-by-step: Add a Port monitor for SMTP
- Click New → Add single monitor.
- Select Port monitoring.
- In IP or host, enter the SMTP host you discovered via MX lookup (often smtp.secureserver.net).
- Set the Port:
- Start with 587 (common for authenticated sending / submission)
- Optionally add a second monitor for 25 (more delivery-focused)
- Set notification channels (email; optionally SMS/voice for critical escalation).
- Save the monitor.
Select Port monitoring to validate that SMTP is reachable (recommended alongside Ping).
Practical recommendations
- If you’re monitoring email sending from applications (forms, CRMs, transactional mail), 587 is often the most relevant.
- If you’re monitoring general email delivery, 25 may matter—but some networks block or rate-limit it.
- If Port monitoring triggers alerts frequently while email is still functioning, it may be due to firewall rules, rate limiting, or regional checks. In that case, tune your interval/alerts or choose only the port that matches your actual sending flow.
Putting it together: A simple email monitoring stack
A clean, reliable setup looks like this:
- MX Lookup → identifies the right targets
- Ping monitor on mailstore1.secureserver.net → checks network reachability
- Port monitor on smtp.secureserver.net:587 (and optionally :25) → checks actual SMTP availability
This layered approach gives you much higher confidence than monitoring your website alone—because email failures often happen independently of web uptime.
Understanding Response Time Graphs & Performance Alerts
Uptime monitoring tells you a simple truth: is the site reachable or not? But in real life, “up” doesn’t always mean “good.” A page can be technically available while being painfully slow for users. That’s why response time monitoring is one of the most useful parts of UptimeRobot—especially if you care about lead generation, user experience, and SEO.
Response Time vs Uptime: What’s the Difference?
Think of uptime as a binary signal:
- ✅ Up = the server responds successfully (within your defined rules)
- ❌ Down = the server fails to respond, times out, or returns an “unacceptable” status
Response time, on the other hand, is a performance measurement:
- How long it takes from the moment UptimeRobot sends a request
to the moment it receives a valid response.
So you can have scenarios like:
- Up but slow: The page returns 200 OK, but takes 4–6 seconds.
- Up but inconsistent: Fast most of the time, but spikes frequently.
- Down: The server stops responding or exceeds your timeout setting.
This is why response time alerts are a separate layer: they help you catch performance degradation before it becomes full downtime or lost leads.
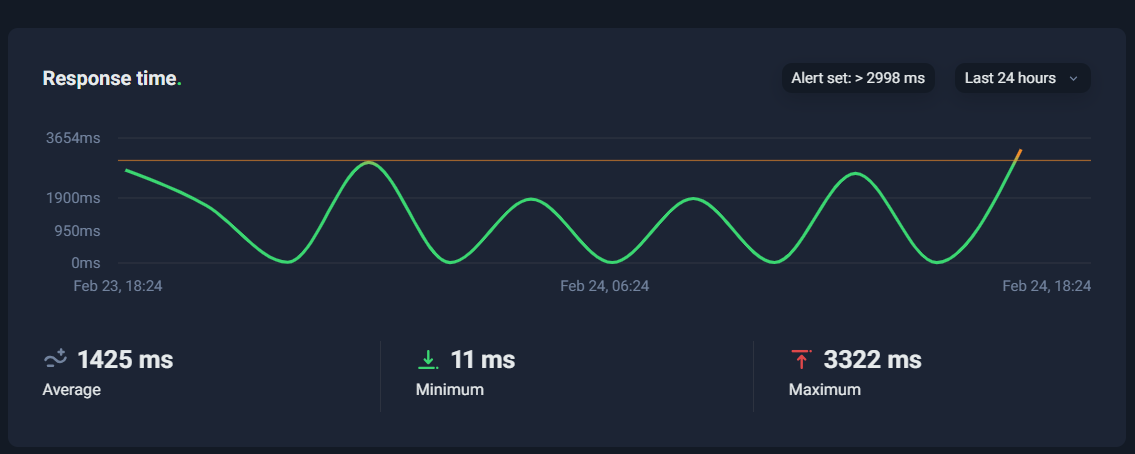
Reading the Response Time Graph
In S14, you’re looking at a response-time timeline—typically over the last 24 hours (or another range you select). The line goes up and down depending on how fast the monitored page responds.
There are three numbers that matter most:
1) Average Response Time
This is the “typical” performance over the selected timeframe.
If your average is around 1,000–2,000 ms, that’s usually decent for many real-world websites (especially content-heavy pages). If it’s consistently above 3,000 ms, that’s a signal to optimize.
But average alone can be misleading.
2) Minimum Response Time
Minimum shows the best-case performance—what’s possible when everything is perfect (warm cache, low traffic, no heavy background activity).
Very low minimum (like tens of milliseconds) often suggests that sometimes your system is extremely fast, meaning the infrastructure can perform well under certain conditions.
That’s good news, because it implies spikes may be caused by variability—not a permanent limitation.
3) Maximum Response Time
Maximum is the worst-case observed response time.
This is often the most revealing metric because it points to periods when something went wrong (load spikes, slow database queries, cache misses, heavy plugin execution, etc.).
If your max is jumping toward 3 seconds or more, it’s a warning sign—especially if it happens frequently.
What Spikes Mean
Response-time spikes are like “fever symptoms.” Your site isn’t down yet, but something is pushing it closer to the edge.
Here are the most common reasons a response-time chart shows periodic spikes (for example, touching ~3 seconds):
Traffic or CPU Load Spikes
If your hosting has limited CPU/RAM, sudden bursts of traffic—or even background tasks—can slow everything down.
Typical signs:
- spikes occur during business hours
- spikes correlate with campaign traffic, email blasts, or peak visitors
Cache Misses (Cold Cache Events)
A cached page is served quickly. A cache miss forces the server to generate the page dynamically, which is slower.
Typical signs:
- spikes happen after deployments, cache clears, or at set intervals
- graph pattern looks like periodic peaks and drops
Database Bottlenecks
Slow database queries are one of the biggest causes of “up but slow.”
Typical signs:
- spikes occur during cron jobs, imports, backups, heavy admin tasks
- max increases gradually over time as the database grows or indexes degrade
Heavy Plugins / Scripts / Third-Party Dependencies
In many CMS setups (especially WordPress), a single heavy plugin or external script can add seconds.
Typical signs:
- spikes coincide with new plugin installs, theme changes, or new tracking scripts
- the site is “up,” but user experience degrades
Hosting Limits / Throttling
On shared or limited hosting, you can get throttled when hitting resource caps.
Typical signs:
- performance is fine until some threshold, then spikes sharply
- repeated spikes at similar times daily/weekly
Performance Alerts: How to Use Them Without Creating Noise
UptimeRobot allows you to enable a Slow Response Time Alert, which triggers when the response exceeds your threshold (e.g., 3000ms or 5000ms).
The key is to set a threshold that reflects real business impact:
- If your page is normally 700–1500ms, a 3000ms alert makes sense.
- If your page is heavy and typically 2000–3500ms, a 5000ms alert is safer to avoid false alarms.
A smart approach is:
- Observe the average and max for a day or two
- Set the alert threshold slightly above typical peaks
- Tighten it gradually once you’ve optimized performance
Mini Checklist: What to Check When Response Time Spikes
Use this quick checklist whenever you see spikes in S14:
✅ Caching
- Is page caching enabled?
- Are caches being cleared too frequently?
- Are important pages excluded from caching by mistake?
✅ CDN
- Is a CDN enabled for static assets?
- Are images, CSS, and JS served via CDN?
- Are there geo-related latency issues?
✅ Database
- Are there slow queries?
- Are tables bloated or missing indexes?
- Are background tasks running heavy DB operations?
✅ Hosting Limits
- Are CPU/RAM limits being hit?
- Are you on a plan that throttles resources?
- Do you need better scaling (upgrade plan, dedicated resources, autoscaling)?
✅ Heavy Plugins / Scripts
- Any new plugins added recently?
- Any third-party scripts (chat widgets, analytics, heatmaps) causing delays?
- Is the site running unnecessary tracking on critical landing pages?
The Big Picture
Uptime tells you when your site is unavailable. Response time tells you when your site is becoming unusable—which often happens before downtime.
If you’re monitoring lead-gen pages, contact forms, or SEO landing pages, response-time graphs are not “nice-to-have.” They’re an early warning system. Use them to catch performance decay, investigate spikes, and improve the user experience before it costs you conversions.

Managing Many Monitors: Groups, Tags, Bulk Actions
Once you move beyond a handful of checks, monitoring can quickly turn into a messy list of “random URLs and servers.” That’s where organization becomes the difference between useful monitoring and noise. UptimeRobot gives you three simple building blocks to keep everything clean and scalable: Groups, Tags, and Bulk Actions. Used together, they let you manage dozens (or hundreds) of monitors without wasting time clicking into each one.
Why organization matters
When something goes wrong, your priority is speed: What’s down? How serious is it? Who needs to know? If monitors are not organized, you’ll spend precious minutes searching, guessing, or opening items one-by-one. Good structure helps you:
- Find the right monitors instantly (e.g., “all lead-related monitors”)
- Apply changes in seconds (e.g., update notifications for 30 monitors at once)
- Avoid alert fatigue by separating critical systems from low-priority checks
- Build a clean status page and show only the monitors that matter
The goal is simple: make your monitoring dashboard behave like a well-labeled control room, not a cluttered inbox.
Grouping strategy: how to arrange monitors so they make sense
A Group is the highest-level way to organize monitors. Think of it like a folder. You can use groups in multiple ways depending on your needs, and the best setups usually combine these three “dimensions”:
1) Group by client
If you manage monitoring for multiple client websites (or multiple brands), grouping by client keeps everything separated and easy to report on.
Example groups:
- Client A – Website Monitoring
- Client B – API Monitoring
- Client C – Email & Infra
This prevents cross-client confusion and allows you to apply client-specific notifications or status pages easily.
2) Group by environment (Prod vs Staging)
If your team maintains staging or QA environments, separating them is crucial.
Example groups:
- Production
- Staging
- Development / Internal
This avoids unnecessary panic. A staging outage shouldn’t trigger the same response as production downtime.
3) Group by function (Website / Email / API / Jobs)
For teams focused on infrastructure and reliability, grouping by function makes triage faster.
Example groups:
- Website (HTTP + Keyword monitors)
- Email (MX ping + SMTP port checks)
- API (endpoint uptime + API assertions)
- Jobs (Heartbeat/Cron monitors)
This is especially helpful when an incident occurs, because it immediately tells you which part of the system is impacted.
Tags: faster filtering and smarter labeling
While groups help structure your dashboard, tags add flexible labels that cut across groups. They’re perfect for identifying monitors by purpose, priority, or team ownership. A clean tag system makes searching and bulk operations painless.
Recommended tags (based on real operational needs):
- SEO — monitors tied to SEO-critical pages (service pages, blogs, landing pages)
- Lead — contact forms, lead pipelines, CRM sync, and heartbeat monitors for lead processing
- Email — MX host pings, SMTP port monitors, transactional email endpoints
- Critical — anything that must page someone immediately (home page, checkout, payment API, main lead funnel)
Once tags are in place, filtering becomes quick and reliable. For example:
- Want all lead-related monitoring? Filter by Lead
- Want to see only what’s critical? Filter by Critical
- Want SEO visibility? Filter by SEO
Tags also help you avoid over-alerting: you can route Critical monitors differently than SEO monitors, even if they live in the same group.
Bulk actions: manage many monitors in seconds (instead of hours)
This is where UptimeRobot becomes extremely efficient at scale. Instead of opening monitors one by one, you can select multiple monitors and apply actions to all of them using Bulk actions.
Screenshot placement: Insert S12 here (Bulk actions menu open), because it visually shows the exact options available.
With Bulk actions, you can do the three most important maintenance tasks instantly:
1) Update notification rules across many monitors
As your team grows, your alert routing evolves. Maybe:
- A new team member needs notifications
- You want to remove SMS from low-priority monitors
- You want only the DevOps team to receive critical downtime alerts
Instead of changing each monitor separately, select the relevant monitors (e.g., everything tagged Critical) and update notifications in one shot.
This reduces mistakes and ensures consistency across your monitoring setup.
2) Move monitors into the right group
Dashboards evolve. Sometimes monitors are created quickly, dumped into “default,” and never organized. Bulk actions let you clean up instantly:
- Select monitors that belong to “Email”
- Bulk action → “Move to Group”
- Choose “Email & Infrastructure”
Now your dashboard reflects reality, and the next incident becomes easier to understand.
3) Add monitors to a status page quickly
Status pages are most useful when they show only what’s meaningful. Bulk actions let you:
- Select all customer-facing monitors (homepage, product pages, API health)
- Bulk action → “Add to status page”
- Choose the right status page
This is faster than adding monitors one at a time and helps you keep status pages consistent and up to date.
A simple “best practice” setup you can copy
If you want a clean structure that works for most businesses, start with:
Groups
- Production – Website
- Production – API
- Production – Email
- Production – Jobs (Heartbeat)
- Staging (optional)
Tags
- SEO, Lead, Email, Critical
Then use Bulk actions weekly (or whenever changes happen) to keep everything aligned: group placement, tags, notification routing, and status page configuration.
When you implement Groups + Tags + Bulk actions properly, UptimeRobot stops feeling like “just a list of monitors” and starts working like a scalable monitoring system. You’ll spend less time managing settings and more time actually preventing downtime from becoming a business problem.
Teams & Access Control: Invite Team Members, Assign Roles & Enable 2FA
As your monitoring setup grows beyond a single website or server, managing access becomes just as important as configuring the monitors themselves. UptimeRobot is not just a personal alert tool — it’s built to support teams. That means you can invite members, assign roles, control permissions, and enforce security best practices like two-factor authentication (2FA).
This section explains how to structure access properly so your monitoring remains secure, organized, and scalable.
👥 Inviting Team Members
To manage team access:
- Navigate to Team members in the left sidebar.
- Click the “Invite team member” button (top-right).
- Enter the email address.
- Assign the appropriate role.
- Send the invitation.
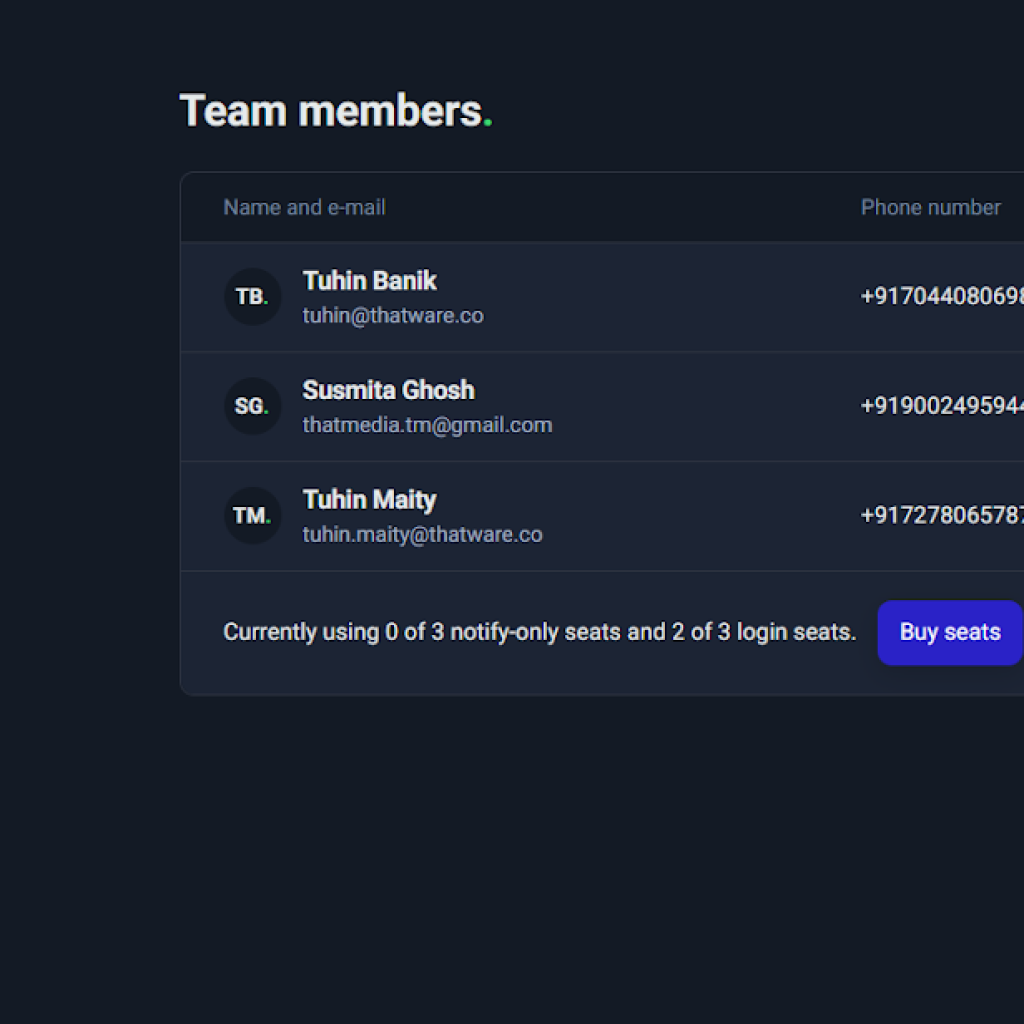
This interface shows:
- Name and email
- Phone number (if configured)
- Role (Admin / Read with login / Notify-only)
- 2FA status
- Account status (Active / Pending)
This central view allows you to manage access across all monitors in one place.
🔐 Who Should Have Login Access vs Notify-Only Access?
A common mistake in monitoring systems is giving everyone full login access. Instead, access should be role-based and aligned with responsibility.
1️⃣ Admin Access
Admins can:
- Create, edit, and delete monitors
- Change alert rules
- Modify intervals and timeouts
- Invite/remove team members
- Manage billing and integrations
Who should be Admin?
- Founder / business owner
- DevOps lead
- Senior technical decision-makers
Avoid assigning Admin to too many people. Every admin increases the risk of accidental changes or security exposure.
2️⃣ Read with Login
This role allows:
- Viewing monitors
- Checking uptime reports
- Viewing incidents
- Reviewing performance graphs
But they cannot:
- Change configuration
- Modify alert logic
- Delete monitors
Best for:
- SEO team
- Marketing team
- Account managers
- Technical analysts
This role provides visibility without risk.
3️⃣ Notify-Only Access
Notify-only members:
- Do not log into the dashboard
- Only receive alerts (email, SMS, push, etc.)
Best for:
- Leadership team
- Clients (if providing uptime alerts)
- Support managers
- Non-technical stakeholders
This keeps them informed without overwhelming them with technical controls.
🛡 Why 2FA (Two-Factor Authentication) Is Critical
Monitoring systems protect your uptime visibility. If compromised, someone could:
- Disable monitors
- Silence alerts
- Change notification rules
- Remove team members
That means your website could go down — and you’d never know.
Two-factor authentication adds a second security layer beyond passwords.
When enabled:
- Users must confirm login using an authenticator app or verification method.
- Even if a password is leaked, access remains protected.
Best practice:
- Require 2FA for all Admin accounts.
- Strongly encourage 2FA for Read-with-login accounts.
- Review 2FA status periodically (visible in the Team Members page).
In Screenshot S13, you can see the 2FA status column, which clearly indicates whether it’s enabled.
If 2FA shows “Not enabled,” treat that as a security gap.
⚠ Setting Admin Roles Carefully
Admin access should be:
- Limited
- Intentional
- Reviewed regularly
Here’s a recommended structure:
| Role Type | Who Gets It | Why |
| Admin | DevOps Lead + 1 Backup | Configuration control |
| Read with Login | SEO / Marketing / Ops | Visibility without risk |
| Notify-only | Leadership / Clients | Alert awareness |
Avoid:
- Making everyone an Admin “just in case.”
- Sharing a single Admin account across multiple people.
- Ignoring 2FA on privileged accounts.
🧠 Pro Tip: Access Planning Before Scaling
If you manage multiple environments (e.g., production, staging, client sites), define access rules early:
- Production monitors → Strict admin control
- Client monitors → Client notify-only access
- Internal testing monitors → Limited visibility
This prevents confusion, misconfiguration, and alert chaos later.
Keep In Mind
Monitoring is only useful if:
- Alerts are trusted
- Configuration is controlled
- Access is secure
By:
- Assigning the right roles
- Limiting Admin privileges
- Enforcing 2FA
- Using notify-only intelligently
You turn UptimeRobot from a simple alert tool into a structured, enterprise-ready monitoring system.
And as your infrastructure grows, this access control layer becomes just as critical as the monitors themselves.
Notifications Strategy That Prevents Alert Fatigue
If you’ve ever set up monitoring and then turned it off a week later, there’s a good chance the problem wasn’t the tool—it was the noise. Too many alerts, too little context, and the same “down” message hitting everyone at the same time eventually leads to alert blindness.
A smart UptimeRobot setup isn’t just about detecting downtime. It’s about making sure the right people get the right alert, at the right urgency level, without spamming your entire organization.

Figure : Choosing notification channels in UptimeRobot (Email, SMS, Voice call, Push).
1) Build a Severity Model First (So Alerts Mean Something)
Before you toggle every channel on, define severity levels. Keep it simple and operational:
P1 — Critical (Immediate Business Impact)
Use when:
- The main website is down
- Checkout/payment flow is down
- Core API is down (production)
- Email delivery system appears down (e.g., SMTP service unavailable)
- Your lead pipeline is broken (e.g., heartbeat monitor missed)
Impact:
- Immediate revenue loss, lead loss, or major reputation risk
P2 — High (Degradation / Partial Outage)
Use when:
- A critical page is up but slow beyond threshold
- A non-core endpoint fails
- Certain regions fail while others are fine
- A key landing page returns incorrect content (keyword monitor fail)
Impact:
- Users can still access the service, but experience is degraded and may affect conversions.
P3 — Informational (Low Risk / Maintenance Signal)
Use when:
- Short-lived, non-critical downtime
- Minor pages fail
- Non-production systems
- Reminders like SSL expiry or domain expiry (important, but not a “wake up at night” issue)
Impact:
- No immediate business loss, but still worth tracking.
2) Map Severity to Notification Channels
Now map those severities to channels so you don’t “over-notify” by default.
✅ P1: Voice/SMS + Email + Push
Who gets it: DevOps/on-call + primary owner
Why: If something is genuinely critical, you want at least one “can’t ignore” channel.
Best practice:
- Use Voice/SMS only for true emergencies
- Keep the list small (usually 1–3 on-call people)
When P1 is correct, it’s better to “over-alert” slightly than miss it. But only for P1.
✅ P2: Email + Push
Who gets it: Owners + relevant support team
Why: Push is quick visibility, email is searchable and easier for follow-up.
This is the ideal level for:
- Slow response warnings (performance incidents)
- Keyword monitor failures
- Regional routing issues
The key is: P2 should not wake people up, but it should be visible enough to act quickly during working hours.
✅ P3: Email only
Who gets it: Reporting recipients, leadership (optional), and the system owner
Why: Email is best for low urgency and audit trails.
Use P3 for:
- SSL/domain reminders
- Non-critical pages
- Minor incidents that don’t require immediate action
This prevents your Push notifications from becoming a “constant buzz” that everyone ignores.
3) Delay & Repeat Strategies
Even good monitoring can generate noise if alerts fire the moment a single check fails. Real systems can have:
- short network blips
- temporary DNS hiccups
- brief server warm-ups
- CDN edge inconsistencies
So use delays/repeats only when they improve signal quality.
A) Delay: “Confirm it’s real” before alerting
A delay is useful when:
- occasional 30–60 second blips happen
- you don’t want an alert unless downtime persists
Typical approach:
- No delay for P1 (if truly critical)
- Small delay for P2 (e.g., 1–3 minutes) so transient issues don’t wake anyone
- Optional delay for P3
The goal: reduce false positives while still catching real incidents early.
B) Repeat: “Escalate if unresolved”
Repeats are good only when:
- you need escalation if downtime continues
- you have a real on-call workflow
Example pattern:
- First alert goes to the primary owner
- If still down after X minutes, notify a wider group (or call)
Avoid repeats for P2/P3 unless you have clear escalation rules. Otherwise, repeats become spam.
4) Team Routing: Right Alert to the Right People
One of the biggest reasons alert fatigue happens is that everyone receives everything.
Instead, route by responsibility:
DevOps / Engineering
Give them:
- P1 uptime failures (site down, API down)
- infrastructure monitors (ping/port)
- heartbeat failures for critical jobs
Why:
They’re the fastest team to diagnose and resolve availability issues.
SEO / Marketing
Give them:
- P2 performance alerts (slow pages)
- keyword monitoring failures on landing pages
- uptime notifications for campaign landing pages (only if business-critical)
Why:
SEO and marketing teams care deeply about:
- page availability
- page speed spikes
- “soft failures” where a page loads but is wrong
Leadership / Stakeholders
Give them:
- P3 email reports or summaries (optional)
- P1 only for major incidents if necessary (very limited)
Why:
They usually don’t need real-time noise. They need visibility and accountability.
5) Practical Setup Example
Use your monitors like this:
- Homepage / Main site → P1 → Email + Push + (SMS/Voice to on-call)
- Key landing pages → P2 → Email + Push (SEO + marketing owners)
- Blog pages / non-critical pages → P3 → Email only
- SSL/domain reminders → P3 → Email only
- Lead pipeline heartbeat → P1 or P2 (depends on lead volume and business impact)
Then validate your setup by asking one question:
“If this alert triggers at 2 AM, would I be glad it woke me up?”
If the answer is “no,” it’s probably not P1.
Quick Rule of Thumb
- P1 wakes people up
- P2 informs the owners quickly
- P3 documents and reminds
That’s how you get maximum reliability without training your team to ignore alerts.
Status Pages
While uptime monitoring is critical for internal awareness, status pages take your monitoring strategy one step further — they turn internal reliability into external trust.
A status page is a public (or private) dashboard that displays the real-time health of your services. Instead of customers emailing you to ask, “Is the website down?”, they can see the answer instantly.
For agencies, SaaS companies, ecommerce brands, and enterprise teams, this is not just a convenience — it’s a credibility layer.
Why Status Pages Matter: Trust + Transparency
When systems fail, silence damages trust more than downtime itself.
A status page:
- Shows current system health (Up / Down / Degraded)
- Displays historical uptime percentages
- Communicates incidents transparently
- Reduces support tickets during outages
- Builds long-term brand credibility
For example:
- If your checkout system goes down, customers can see the incident acknowledged.
- If maintenance is scheduled, users can view the timeline.
- If your uptime is consistently 99.99%, it becomes a selling point.
This is especially powerful for:
- SaaS platforms
- SEO agencies handling client sites
- Hosting companies
- Businesses processing online payments
- Any brand collecting leads online
Instead of reactive communication, you create proactive transparency.
Public vs Private Status Pages
UptimeRobot allows you to create either:
1. Public Status Pages
Visible to anyone with the link.
Best for:
- SaaS products
- Public APIs
- Ecommerce platforms
- Client-facing reliability reporting
Benefits:
- Strengthens user trust
- Demonstrates operational maturity
- Reduces inbound “is it down?” support queries
2. Private Status Pages
Restricted to internal teams or select stakeholders.
Best for:
- Internal infrastructure monitoring
- Agency-client reporting
- Executive dashboards
- DevOps environments
Benefits:
- Controlled visibility
- No public exposure of internal outages
- Useful for client reporting without exposing sensitive systems
Choosing between public and private depends on your brand strategy and audience expectations.
How to Add Monitors to a Status Page
There are two primary ways to add monitors:
Method 1: Via Bulk Actions (Recommended for Multiple Monitors)
If you already have multiple monitors created:
- Go to your Monitoring dashboard.
- Select one or more monitors using the checkbox.
- Click Bulk Actions.
- Choose “Add to status page.”
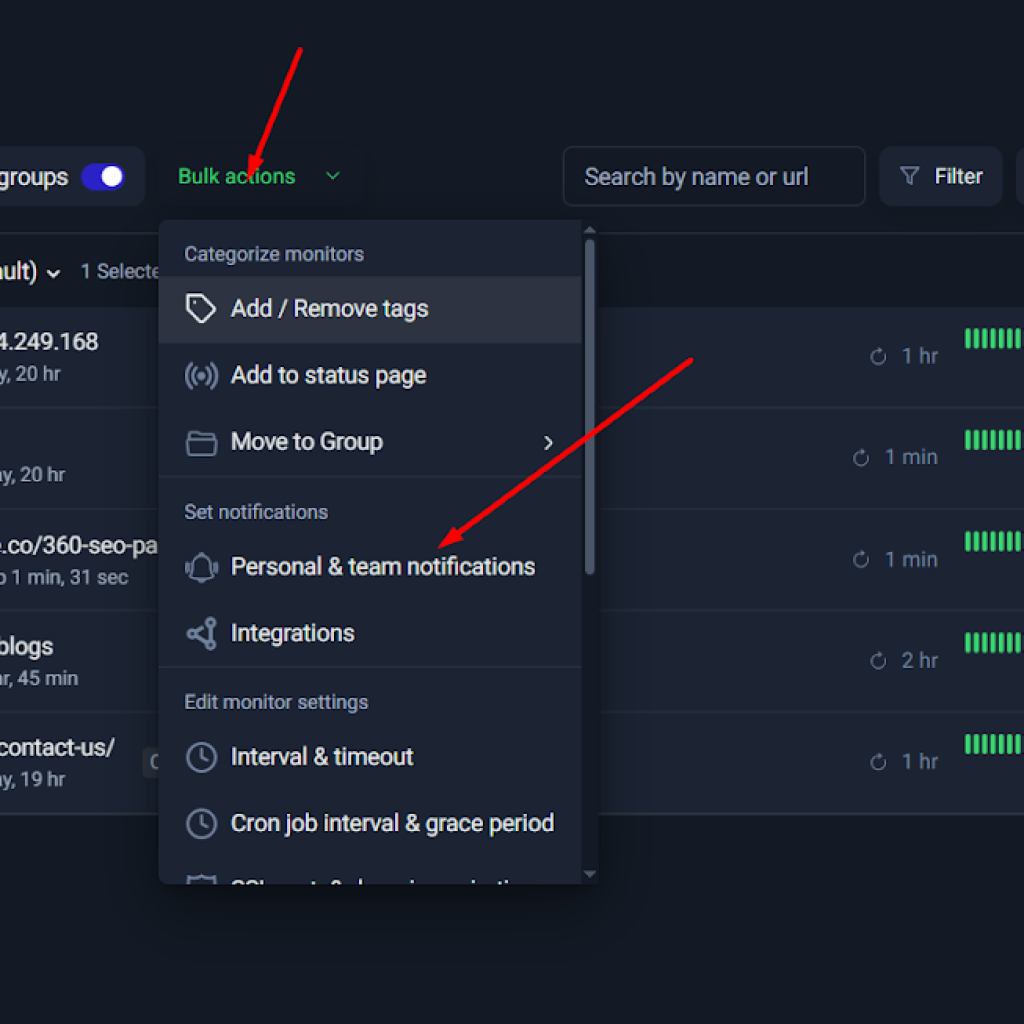
This is the fastest method when organizing multiple services into a single status page.
Method 2: Via the Status Pages Menu
You can also:
- Navigate to the Status Pages section in the left sidebar.
- Create a new status page.
- Select which monitors should be displayed.
- Customize layout and visibility settings.
- Publish.
This method is ideal when setting up your status page for the first time.
Best Practice: What Should You Show?
Not every monitor needs to be public.
Recommended structure:
Public Status Page
- Main website
- API endpoint
- Checkout system
- Email system (if critical to users)
Private/Internal Status Page
- Server ping monitors
- Port monitors
- Cron job heartbeats
- Backup systems
- Internal automation pipelines
Keep public pages clean and relevant. Too much technical detail can confuse non-technical users.
Strategic Advantage: Reliability as a Brand Asset
Many businesses treat uptime as a backend technical concern. High-performing companies treat uptime as a marketing asset.
When you consistently show:
- 99.9%+ uptime
- Transparent incident reporting
- Fast resolution timelines
You are not just monitoring your systems — you are strengthening customer confidence.
Final Recommendation
Even if you are just starting with uptime monitoring:
- Create at least one status page.
- Add your core production monitors.
- Keep it updated.
- Use it during incidents.
It transforms monitoring from a defensive tool into a proactive trust-building mechanism. If your infrastructure matters to your users, a status page is not optional — it’s strategic.
Common Mistakes & Fixes
Even though UptimeRobot is simple to start with, a few small configuration mistakes can quietly make your monitoring unreliable—either by hiding real downtime or by creating noisy, false alerts. Below are four common issues we’ve seen (and demonstrated in the screenshots you shared), along with the best-practice fixes to make your monitoring trustworthy.
Mistake 1: Treating 4xx and 5xx as “Up”
What happens:
In UptimeRobot’s HTTP monitor settings, you can choose which HTTP status code families count as “Up.” This is useful when your site legitimately returns redirects (3xx) or when a certain endpoint might respond differently.
But a major pitfall is enabling 4xx and 5xx as “Up.”
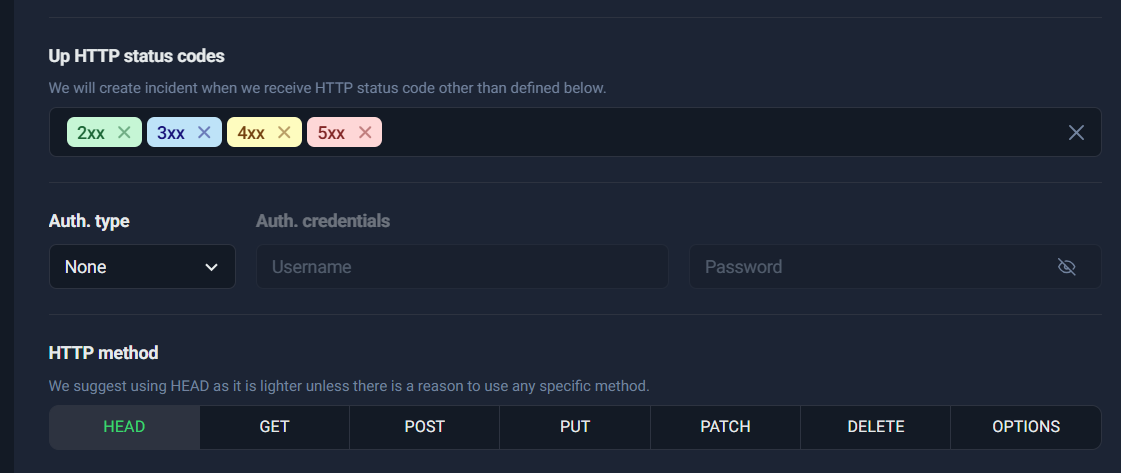
- 4xx errors generally mean the request failed due to a client-side issue (e.g., 404 Not Found, 403 Forbidden).
- 5xx errors usually mean the server is broken or unavailable (e.g., 500 Internal Server Error, 502 Bad Gateway, 503 Service Unavailable).
If you allow 4xx/5xx as “Up,” your monitor may keep showing green even when:
- A critical landing page is returning 404
- Your site is failing with 500
- Your server is overloaded and responding 503
- A reverse proxy is throwing 502
That’s not monitoring—it’s a “don’t tell me bad news” setting.
Why it’s dangerous:
This mistake creates false confidence. Your dashboard shows “Up,” your uptime percentage looks perfect, and you never get alerts—while users are experiencing broken pages or complete outages. This is especially risky for:
- SEO landing pages (404/500 can hurt indexing and conversions)
- Checkout/contact pages (lost leads)
- APIs (downstream systems break silently)
What to do instead (Best practice):

For most websites and endpoints, treat only these as “Up”:
✅ 2xx (Success)
✅ 3xx (Redirects—useful when your site redirects HTTP→HTTPS or old URL→new URL)
And treat these as “Down”:
❌ 4xx (Client errors)
❌ 5xx (Server errors)
This “bad → good” pairing makes the lesson stick.
Mistake 2: Too aggressive slow-response thresholds (1 second for everything)
What happens:
UptimeRobot allows you to enable a Slow response time alert, which triggers a notification when response time crosses a threshold. This is extremely valuable because users often suffer from “slow” long before a site is technically “down.”
But setting the threshold too low—especially 1000ms (1 second) for every monitor—often creates alert noise.
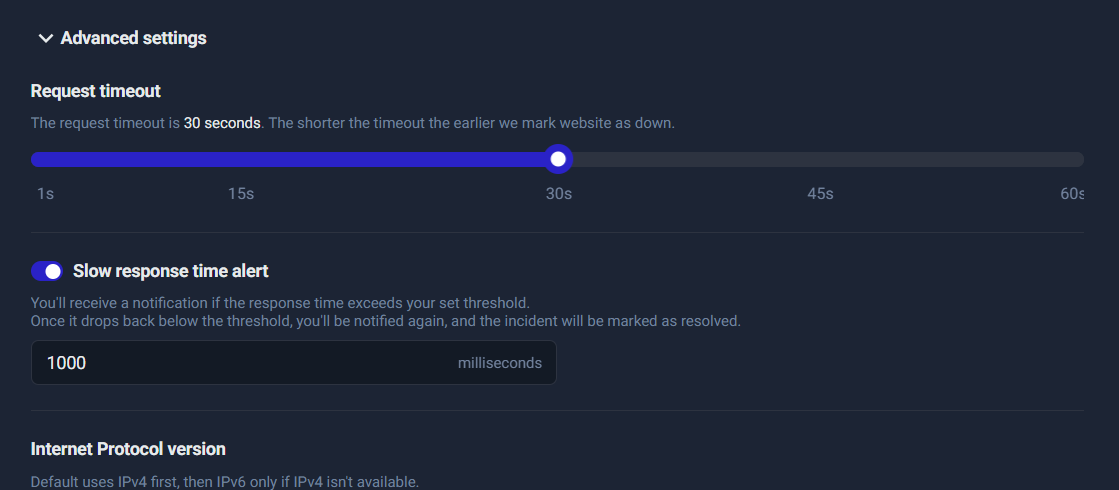
Why it causes false alerts:
A 1-second threshold can be unrealistic depending on:
- Page size and number of requests (images, scripts, fonts)
- Server location and global routing
- Cache misses
- Peak traffic
- Third-party scripts (analytics, ads, chat widgets)
- Heavy WordPress plugins / dynamic queries
So a normal temporary spike (e.g., 1.2s, 1.5s) can trigger alerts repeatedly—even though users may not even notice.
What to do instead (Best practice):
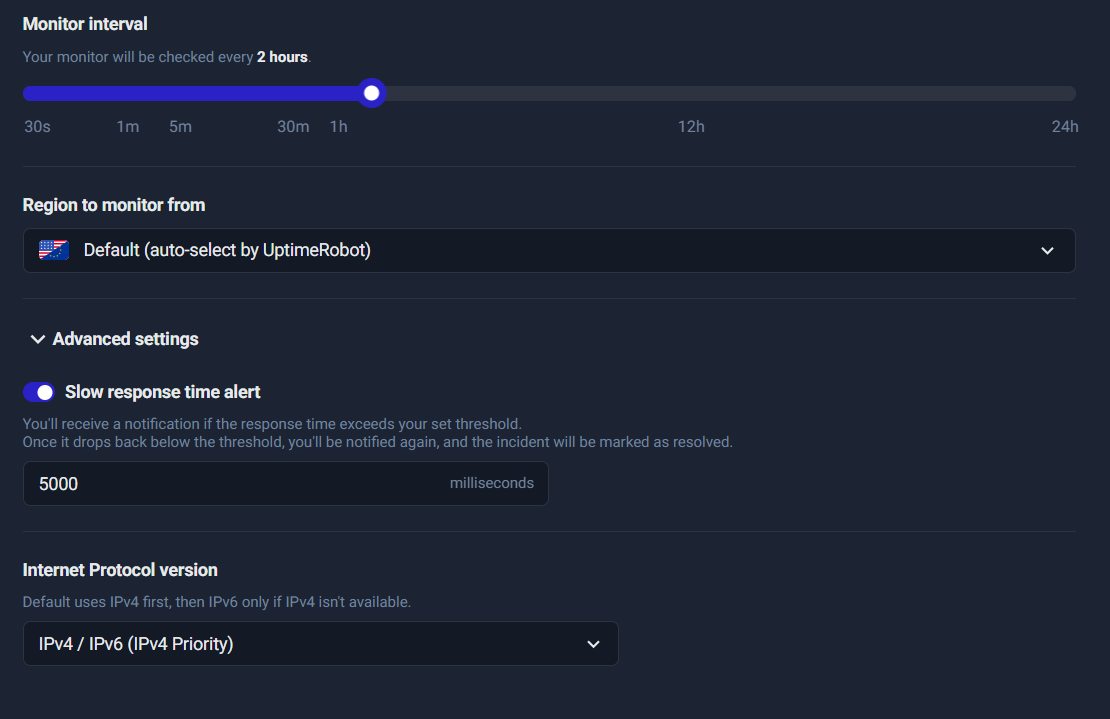
Choose your threshold based on what you’re monitoring:
- Lightweight endpoints (health checks, simple pages): 1500–2500ms
- Normal business websites: 2000–3000ms
- Heavy pages (large landing pages, complex CMS pages): 3000–5000ms
- If your goal is “only alert on real performance pain”: 4000–5000ms is a solid starting point
A great approach is to:
- Watch your response-time graph for 24–72 hours
- Set the threshold slightly above your normal peak (to avoid noise)
- Tighten it later if needed
Mistake 3: Using Heartbeat monitoring without an automated sender
What happens:
Heartbeat (Cron Job) monitoring is different from HTTP monitoring.
- In HTTP monitoring, UptimeRobot pings your site.
- In Heartbeat monitoring, your system pings UptimeRobot.
That second model is where people slip.
A common scenario is:
- Someone creates a Heartbeat monitor (for “Lead Form”, backups, pipeline, etc.)
- They copy the URL
- They test it once in a browser (it says “ok”)
- Then they forget to implement it inside the actual workflow
After some time, UptimeRobot marks it as “not received,” and alerts fire—or worse, the user disables alerts, and then real failures go unnoticed later.
Why this breaks monitoring:
Heartbeat monitors are only reliable when the heartbeat URL is called by:
- a scheduled cron job
- a background worker
- the application backend after successful processing
- an automation workflow (like a pipeline or integration script)
Manually pasting the URL in a browser proves only one thing: the URL works.
It does not prove the job is running.
What to do instead (Best practice):
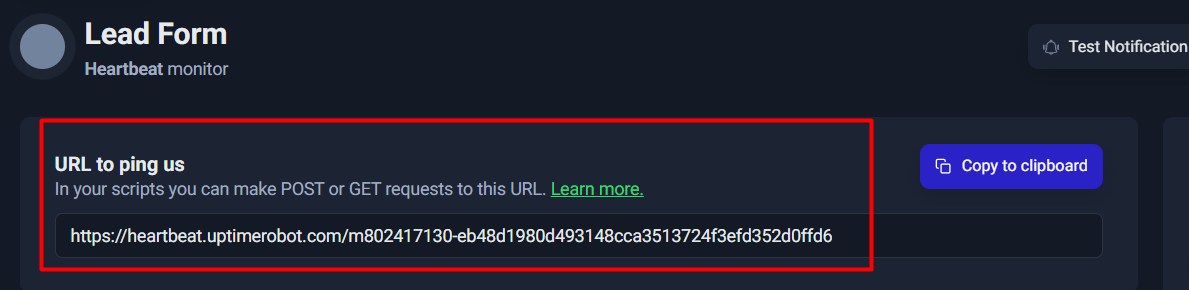
This URL must be called automatically by your system.
Implement the Heartbeat ping inside the real success path.
Examples:
- After your lead form successfully stores the lead + sends an email → ping heartbeat
- After your hourly cron finishes processing queue items → ping heartbeat
- After backup completes successfully → ping heartbeat
Important:
Only ping on success, so a failure results in a missing heartbeat (and thus an alert). That’s exactly what you want.
Mistake 4: Only using Ping monitoring for services
What happens:
Ping monitoring is useful, but it’s often misunderstood.
Ping answers only one question:
“Is this host reachable at a network level?”
It does not answer:
- Is the service running?
- Is the port open?
- Is the application healthy?
- Is SMTP accepting connections?
- Is the database listening?
A server can respond to ping while critical services are down.
Why it’s dangerous:
If you monitor only via Ping, you might see “Up” even when:
- SMTP service is down → emails fail
- Database port is blocked → website errors
- Web server is down but host still responds
- Firewall rules changed
- A service crashed but the OS is still alive
What to do instead (Best practice): Combine Ping + Port monitoring

Use a two-layer approach:
- Ping monitor: basic host reachability
- Port monitor: confirms the service is actually listening on the port that matters
Examples:
- Email systems:
- Ping the host (reachability)
- Port monitor 25 or 587 for SMTP availability
- Web systems:
- Port monitor 443 confirms HTTPS service health
- Databases:
- Port monitor 3306 (MySQL) / 5432 (PostgreSQL) where appropriate (often internal only)
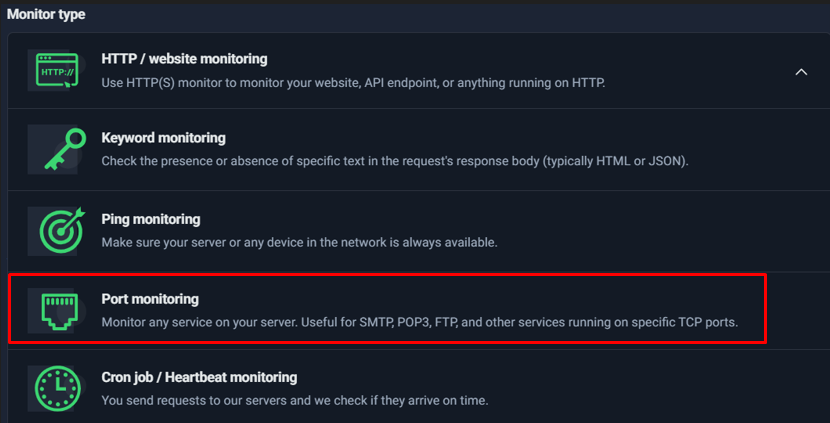
Ping is good—but it’s not enough for service-level assurance.
Quick Recap: The Reliable Monitoring Rule of Thumb
If you want monitoring you can trust:
- ✅ Treat only 2xx + 3xx as “Up” for websites
- ✅ Set response-time alerts realistically (start around 2000–5000ms)
- ✅ Use Heartbeat only when you have a real automated job pinging it
- ✅ Pair Ping with Port monitoring when you care about actual services (SMTP/DB/HTTPS)
Recommended “Ready-to-Copy” Monitoring Blueprint
If you want a monitoring setup that’s simple, scalable, and actually useful, this blueprint gives you a ready-made structure you can copy for almost any business website—whether you’re running a service business, SaaS, agency, ecommerce store, or a lead-gen site. The goal is to cover not just “is the site online?” but also the things that really matter: key pages, critical content, email reliability, lead flow health, and expiry risks (SSL + domain).

1) Core Website Monitoring (Critical)
This is the foundation. These monitors answer one question:
Can users reach the pages that generate revenue/leads?
Create HTTP monitors for:
- Homepage (brand entry point)
- Contact page (high intent users)
- Key landing/service pages (the pages you rank and sell from)
Recommended settings
- Interval:1–5 minutes
- Use 1 minute for the most critical pages (homepage + contact + best landing page).
- Use 5 minutes for secondary service pages to avoid noise.
- Up status codes:2xx and 3xx
- 2xx means success (page loaded)
- 3xx means redirects (still reachable, still usable)
- Avoid treating 4xx/5xx as “UP” because those usually indicate broken pages or server errors.
- Timeout:30 seconds
- This is a practical default. It prevents false alarms from temporary slowness, while still catching real outages.
Why this matters:
If your homepage is up but the contact page is down, you’re losing leads. If landing pages go down, paid campaigns and SEO traffic bleed money silently. This set gives you coverage where it counts.
2) Content Correctness Monitoring (Keyword Checks)
HTTP monitors can say “page is up” even when it’s functionally broken—like a blank page, maintenance message, wrong content, or an error message showing with a 200 response. Keyword monitoring closes that gap by checking whether the expected content is present.
Add Keyword monitors for:
- Contact page contains “Contact” (or a unique phrase like “Get in touch”)
- Checkout contains “Pay” (or a unique checkout identifier, for ecommerce/SaaS)
- Lead/service page contains your main service keyword (e.g., “SEO Package”, “Request a Quote”, etc.)
Best practice for keyword selection
- Use a phrase that is stable and unlikely to change during redesigns.
- Avoid tiny words that could appear in error pages too (“OK”, “Welcome”).
- If possible, pick something unique like a section heading or CTA text.
Why this matters:
This catches “soft downtime”—your server responds, but users see the wrong experience.
3) Email Monitoring (MX + SMTP)
For most businesses, email is a mission-critical channel: leads, quotes, confirmations, password resets, billing, and support depend on it. Email failures often go unnoticed longer than website downtime.
Set up:
- Ping monitoring of MX host (ensures the mail host is reachable)
- Port monitoring for SMTP (ensures the mail service is actually listening)
How to think about it
- Ping MX = “Can we reach the mail server at all?”
- Port SMTP = “Is the email service responding on the mail port?”
Why this matters:
If website leads are flowing but confirmation emails and notifications fail, your pipeline breaks silently. This setup gives you early warnings for email delivery infrastructure issues.
4) Lead Pipeline Monitoring (Heartbeat)
This is the most underrated monitor type for businesses that rely on inbound leads. HTTP monitoring tells you the form page is reachable—but it doesn’t guarantee that leads are actually being processed successfully.
Heartbeat monitoring solves that by requiring a “success ping” from your backend logic.
Use Heartbeat monitoring for:
- Lead processing scripts (cron jobs)
- Backend lead handlers (form → database → email/CRM)
Recommended approach
- Trigger the Heartbeat ping only after successful processing, such as:
- Lead stored in database
- Email sent / notification fired
- CRM entry created successfully
Why this matters:
Your contact page can be “up,” but if form submissions fail due to mail configuration, spam filters, broken API keys, or server errors—your business still loses money. Heartbeats give you a real “pipeline health” signal.
5) Security & Expiry Monitoring (SSL + Domain)
Two of the most expensive, avoidable disasters:
- SSL certificates expiring
- Domains expiring
Both can take down your site or break trust instantly.
Enable:
- SSL error checks
- SSL expiry reminders (use reminders like 30/14/7/0 days)
- Domain expiry reminders
Why this matters:
These are not “if” problems—they’re “when” problems unless monitored. Expiry monitoring is cheap protection against downtime that doesn’t look like a server issue.
What this blueprint gives you
With this setup, you get:
- Immediate downtime alerts for business-critical pages
- Soft-downtime detection via keyword checks
- Email infrastructure visibility beyond just the website
- Real lead pipeline monitoring (not just “form page loads”)
- Protection against expiry-related outages
- A structure you can expand with groups/tags as you add more monitors
Conclusion + Next Steps
Monitoring is no longer optional — it’s foundational to protecting your website, your leads, your infrastructure, and ultimately your revenue. Throughout this guide, you’ve seen how UptimeRobot goes far beyond simply checking whether a website loads. It allows you to monitor HTTP availability, validate content with keyword checks, track server reachability with ping and port monitoring, safeguard business workflows using heartbeat monitors, and prevent silent disasters with SSL and domain expiry reminders.
When configured correctly, this creates a layered protection system:
- Website uptime is verified
- Critical pages are validated
- Email and infrastructure remain reachable
- Background processes are confirmed to run on time
- Certificates and domains don’t expire unexpectedly
- Response time issues are caught before they impact users
The key is not to overcomplicate your setup at the beginning. Start simple and build intelligently.
Here’s a practical next-step plan:
- Start with 1–3 critical monitors.
Add HTTP monitors for your homepage and one or two revenue-driving pages. Use 2xx and 3xx status codes, set a reasonable timeout, and enable SSL checks.
- Add a heartbeat monitor for business workflows.
If you rely on lead forms, backups, cron jobs, or data syncs, configure a heartbeat monitor and connect it to your system. This ensures you’re alerted when business logic fails — not just when servers go down.
- Enable SSL and domain expiry reminders.
These take seconds to configure but can prevent costly outages and brand damage.
- Tune your notifications.
Avoid alert fatigue. Use email and push for most monitors, and reserve SMS or voice alerts for critical infrastructure failures. Adjust response-time thresholds to avoid false alarms while still catching performance degradation.
Monitoring works best when it’s proactive, layered, and intentional.
Now it’s your move.
- Set up your first 3 monitors today.
- Create a lead pipeline heartbeat in 10 minutes.
- Tune response-time alerts to avoid false alarms.
Your future self — and your business — will thank you.
