SUPERCHARGE YOUR ONLINE VISIBILITY! CONTACT US AND LET’S ACHIEVE EXCELLENCE TOGETHER!
The primary purpose of this project is to understand how different factors related to a website, like backlinks, page load time, and content length, affect the website’s traffic (the number of visitors). You want to see if these factors predict the number of people who will visit the site.

In simple terms, the project aims to:
· Use data from the website (about backlinks, how fast the pages load, and how long the content is).
· Analyze how these factors impact how many people visit the website.
· Predict traffic using the relationships between these factors.
We are using a method called linear regression. This statistical technique helps you see how much one thing (like backlinks) affects another (like traffic). By feeding the website data into this model, we can see if improving certain aspects, like getting more backlinks or improving page speed, can lead to more visitors.
Understanding Linear Regression in Simple Terms:
- Linear regression is a basic statistical method to understand the relationship between two or more variables. It predicts one variable (the outcome, called the dependent variable) based on the value of another variable (the independent variable). Imagine you want to predict your SEO performance (like how many visitors a webpage gets) based on another factor, like how much money you spend on ads. Linear regression helps you find a straight-line relationship between these two things. It tries to figure out how much the dependent variable (SEO performance) changes when the independent variable (ad spend) changes.
Use Cases of Linear Regression:
· SEO Metrics and Performance Prediction: In your case, linear regression can help predict how different factors, such as keyword rankings, backlinks, or website traffic, affect your SEO performance.
· Sales Prediction: Businesses often use linear regression to forecast future sales based on historical data like advertising spend, seasonality, or product price changes.
· Real Estate Pricing: It can be used to predict the price of houses based on location, square footage, and number of bedrooms.
· Health: Predicting outcomes like weight loss based on diet and exercise levels.
Real-Life Implementation:
Regarding SEO, you want to predict how many visitors a webpage will get. The independent variables might be:
· Number of backlinks (how many other websites link to your webpage)
· Keywords used
· Time spent on page by visitors The dependent variable would be the number of visitors to your webpage. Using a linear regression model, you can determine how changes in the backlinks, keywords, and other factors affect the number of visitors.
What Input Does a Linear Regression Model Need?
The model doesn’t need URLs of webpages but numerical data. Here’s what it requires:
· Independent variables: These factors affect SEO, like backlinks, keyword rankings, page speed, etc. You need to collect data on these.
· Dependent variable: This is what you’re trying to predict, such as the number of visitors to your website or your SEO score.
Simple Example in SEO:
Imagine you run a website and want to understand how keyword usage impacts your traffic. You collect data on:
· X (independent variable): Number of keywords used per article.
· Y (dependent variable): Number of visitors to the article.
A linear regression model will show you how strongly X influences Y, and it will create a simple formula like:
- Y = a + bX
Where a is a constant (starting point) and b is the change in Y (traffic) for every 1-unit change in X (keywords).
1) Where Can You Get the Data for Linear Regression in SEO?
To use linear regression for SEO prediction, you’ll need specific data about a website’s performance. Here’s where you can collect that data:
· Google Analytics: Provides essential data like how many visitors your website gets, how long they stay, and what pages they visit. You can download pageviews, bounce rates, and session durations.
· Google Search Console: Offers insights on keyword rankings, click-through rates (CTR), and how often your website appears in search results for different queries.
· SEMrush or Ahrefs: SEO tools that give you data on backlinks, domain authority, keyword rankings, and the number of keywords a website ranks for. They also provide details on competitors.
· Screaming Frog: A tool to crawl your website and get detailed information about each webpage, including metadata, page load times, and errors.
2) What Data Do You Need from thatware.co to Feed into the Model?
Since you’re working with the thatware.co website, you’ll need specific metrics (data points) to build your model. Here’s a simple breakdown of the types of data you should collect and where to get them:
Independent Variables (Factors Affecting SEO):
· Number of Backlinks: These are links from other websites to thatware.co. Tools like SEMrush, Ahrefs, or Moz will give you the exact number of backlinks and even the quality of those links.
· Keyword Rankings: You need data on where thatware.co ranks for various keywords (e.g., “AI in SEO”). This can be pulled from Google Search Console or tools like Ahrefs and SEMrush.
· Page Load Time: How fast each page of thatware.co loads. You can use Google PageSpeed Insights or tools like GTMetrix or Screaming Frog.
· Content Length: How many words are on each page. Tools like Screaming Frog can crawl your website and provide content length for each URL.
· Social Shares: How often are the pages from thatware.co shared on social media platforms like Twitter or Facebook. Tools like BuzzSumo can help track social engagement.
· Bounce Rate: The percentage of visitors who leave the site after viewing only one page. You can get this from Google Analytics.
Dependent Variable (What you’re trying to predict):
· Website Traffic: This is the number of visitors to each page of thatware.co gets. Google Analytics is the best source for this data.
· Conversions: If you aim to measure business outcomes (like how many visitors turn into paying customers), you can track this via Google Analytics.
· SEO Ranking Changes: You may also want to predict changes in ranking position for specific keywords. Google Search Console or Ahrefs can provide this data.
3) Feeding Data into the Linear Regression Model:
Once you have the data from thatware.co, you can use it to build a linear regression model. For example, if you want to predict traffic based on the number of backlinks and keyword rankings, your model might look like this:
· Independent Variables: Number of backlinks, keyword rankings, page load time, etc.
· Dependent Variable: Website traffic.
A simple formula in linear regression would look like this:

Here, a is a constant, and b1, b2, and b3 are coefficients that tell you how much each independent variable (like backlinks) impacts the traffic.
size=2 width=”100%” align=center>
1) Number of Backlinks: Using SEMrush, Ahrefs, or Moz
Backlinks are links from other websites pointing to thatware.co, and tools like SEMrush, Ahrefs, and Moz help you track them.
Step-by-step guide for SEMrush:
1. Sign up: Visit https://www.semrush.com/projects/ and create an account (you can start with a free trial if you don’t want to pay right away).
2. Enter the domain: After logging in, go to the dashboard and type thatware.co in the search bar at the top.
3. Backlink Analysis: On the left-hand side, click on Backlink Analytics. SEMrush will show you the total number of backlinks, referring domains (websites linking to thatware.co), and the authority score (quality of the links).
4. Export Data: Click on the export button to download or export this data in CSV format. This will give you all the information needed for the model.
Using Ahrefs and Moz:
Both tools are very similar to SEMrush. You would:
- Sign up for an account on Aherfs (https://ahrefs.com/) or Moz (https://moz.com/).
- Search for the domain thatware.co.
- Navigate to the Backlinks or Site Explorer section to see the number of backlinks.
- Export the data if needed.
2) Keyword Rankings: Using SEMrush, Ahrefs, or Google Search Console
Keyword rankings tell you how well thatware.co ranks for specific search terms like “AI in SEO”.
Step-by-step guide for Google Search Console:
1. Set up Search Console: Go to Google Search Console (https://search.google.com/search-console/welcome) and sign in with a Google account. You will need to verify ownership of thatware.co by adding the website to Search Console (this requires either adding a small piece of code to the website or verifying it through Google Analytics).
2. View Performance Report: Once verified, go to the Performance section. Here, you can see the keywords bringing traffic to thatware.co, along with metrics like clicks, impressions, and ranking positions.
3. Export the Data: You can export this data to use in your model by clicking on the export button in the top right.
Using SEMrush or Ahrefs for Keyword Rankings:
1. Log in: Sign in to SEMrush or Ahrefs.
2. Enter the domain: Type thatware.co in the search bar.
3. Keyword Analytics: In SEMrush, navigate to the Organic Research section under Domain Overview. This will show you the keywords thatware.co ranks for. In Ahrefs, click on Organic Keywords in the Site Explorer section.
4. Export the Data: Click the export button to download the keyword rankings.
3) Page Load Time: Using Google PageSpeed Insights or GTMetrix
Page load time affects how quickly visitors can access content on thatware.co. Faster websites rank better in search results.
Step-by-step guide for Google PageSpeed Insights:
1. Go to PageSpeed Insights: Visit Google PageSpeed Insights (https://pagespeed.web.dev/) .
2. Enter the URL: Type in the full URL of thatware.co and click “Analyze.”
3. View Results: PageSpeed Insights will give you a score of 100 and detailed suggestions on improving load time. This tool analyzes both mobile and desktop performance.
4. Save the Report: You can save or take screenshots of this data for your project.
Since Google PageSpeed Insights doesn’t provide an export option, you can manually copy the data into a CSV or Excel file, take screenshots for a presentation, or use a web scraper to extract the data. Alternatively, tools like GTMetrix or Pingdom (https://tools.pingdom.com/) provide export options and can be used instead.
Using GTMetrix:
- Sign up: Visit GTMetrix (https://gtmetrix.com/) and create a free account.
- Enter URL: Type in the URL of thatware.co and click “Test Your Site.”
- View Results: GTMetrix will provide detailed load time information, including total page load time, page size, and the number of requests.
- Download Report: You can download the full report for your analysis.
4) Content Length: Using Screaming Frog
Content length measures the number of words on each page. Screaming Frog helps you analyze this by crawling the website.
Step-by-step guide for Screaming Frog:
1. Download the Tool: Go to Screaming Frog ( https://www.screamingfrog.co.uk/seo-spider/ ) and download the free version of their SEO Spider tool (this will be enough for small websites).
2. Run a Crawl: Open the tool, enter thatware.co in the search bar, and click “Start” to crawl the website.
3. View Content Data: Go to the Internal tab after completing the crawl. You will see the list of URLs and details such as word count, page title, and meta description.
4. Export Data: Click “Export” to download the data into a CSV file.
5) Social Shares: Using BuzzSumo
Social shares track how many times thatware.co pages have been shared on social media like Facebook and Twitter.
Step-by-step guide for BuzzSumo:
1. Sign up: Go to BuzzSumo (https://buzzsumo.com/) and create an account (they offer a free trial).
2. Enter the Domain: In the search bar, type thatware.co and hit search.
3. View Social Share Data: BuzzSumo will show you which pages on thatware.co are being shared the most on social platforms.
4. Export Data: You can export this data for your analysis by clicking the export button.
keyboard_arrow_down
Code Explanation:
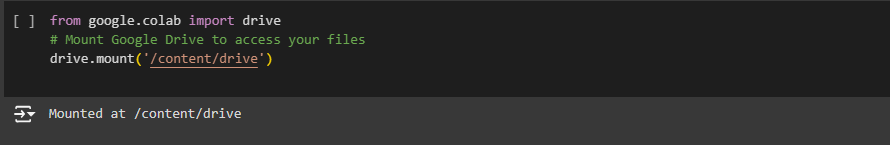
from google.colab import drive
· Purpose: This line imports the drive module from the google.colab library.
· What does it do?: Google Colab is an online platform where you can run Python code. You need to import this specific drive module to access files stored in your Google Drive (such as datasets or files). It gives you the tools needed to interact with your Google Drive from the Colab environment.
drive.mount(‘/content/drive‘)
· Purpose: This line mounts (connects) your Google Drive to the Colab environment.
· What does it do?: This line of code asks Google Colab to connect to your Google Drive. When it runs, you will be prompted to log in to your Google account and give permission to Colab to access your Google Drive files. Once connected, all the files from your Drive can be accessed directly from Colab as if they were stored on your local computer.
· ‘/content/drive‘: This specifies the path where your Google Drive will be mounted inside the Colab file system. After mounting, you can access your files by navigating to this directory (/content/drive).
What Happens After You Run This Code:
1. A prompt will appear asking you to sign in to your Google account.
2. After signing in, you will see an authorization code. You need to copy this code and paste it into Colab to grant access.
3. Once mounted, you will see your Google Drive files under /content/drive/. You can now read and write files from your Drive in Colab.
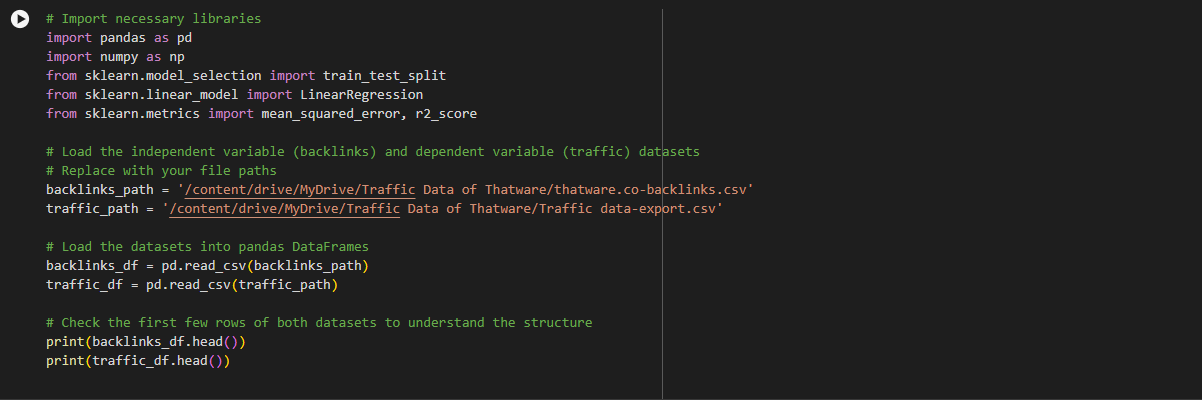
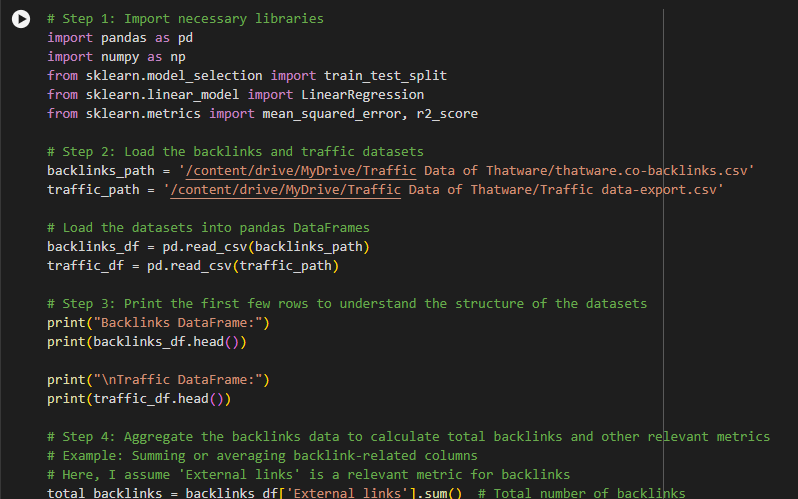
import pandas as pd
import numpy as np
from sklearn.model_selection import train_test_split
from sklearn.linear_model import LinearRegression
from sklearn.metrics import mean_squared_error, r2_score
Purpose: This section imports all the libraries that you’ll need for your linear regression project.
· pandas: A library used for data manipulation and analysis, especially for working with data in table format (like CSV files).
· numpy: A library for numerical computing. It helps with mathematical operations on arrays (large sets of numbers).
· train_test_split: A function from sklearn (scikit-learn) that splits your dataset into training and testing sets. This helps in building and evaluating your machine learning model.
· LinearRegression: A tool to create the linear regression model. It helps in finding the relationship between independent variables (like backlinks) and the dependent variable (like traffic).
· mean_squared_error, r2_score: These are functions used to evaluate the performance of the linear regression model. They help measure how well the model predicts the traffic based on the input data (like backlinks).
keyboard_arrow_down
2. Loading the Datasets:
backlinks_path = ‘/content/drive/MyDrive/Traffic Data of Thatware/thatware.co-backlinks.csv’
traffic_path = ‘/content/drive/MyDrive/Traffic Data of Thatware/Traffic data-export.csv’
· Purpose: These lines store the file paths for the datasets (the CSV files) in variables called backlinks_path and traffic_path.
· backlinks_path: This variable holds the path to the backlinks dataset (independent variable).
· traffic_path: This variable holds the path to the traffic dataset (dependent variable).
· Why do you need this? You need to tell the program where the files are stored in your Google Drive so that it can load the data and use it.
3. Loading Data into Pandas DataFrames:
backlinks_df = pd.read_csv(backlinks_path)
traffic_df = pd.read_csv(traffic_path)
Purpose: These lines load the data from the CSV files into pandas DataFrames, which are like tables where the data is organized in rows and columns.
· pd.read_csv(backlinks_path): This function reads the backlinks CSV file and stores the data in a DataFrame called backlinks_df.
· pd.read_csv(traffic_path): This function reads the traffic CSV file and stores the data in a DataFrame called traffic_df.
· Why use DataFrames? Pandas DataFrames make it easy to work with and manipulate tabular data, like the data in your CSV files. They allow you to filter, sort, and analyze your data effectively.
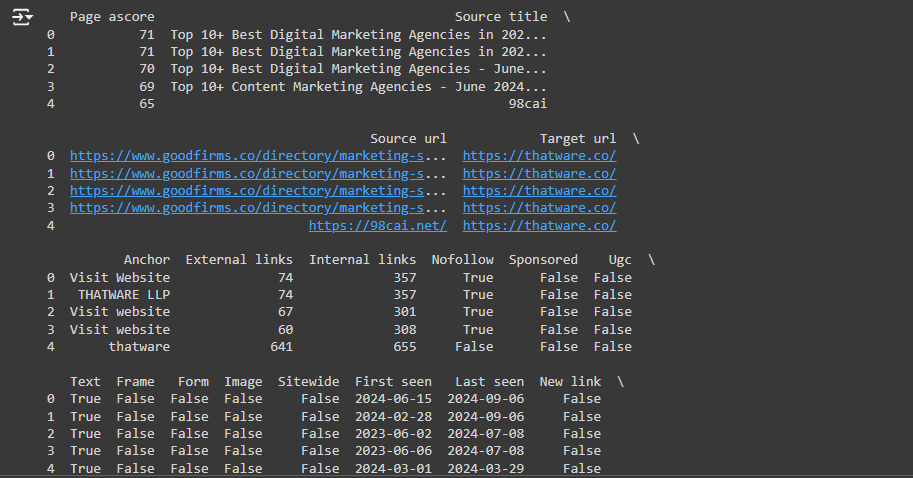
4. Checking the First Few Rows of Each Dataset:
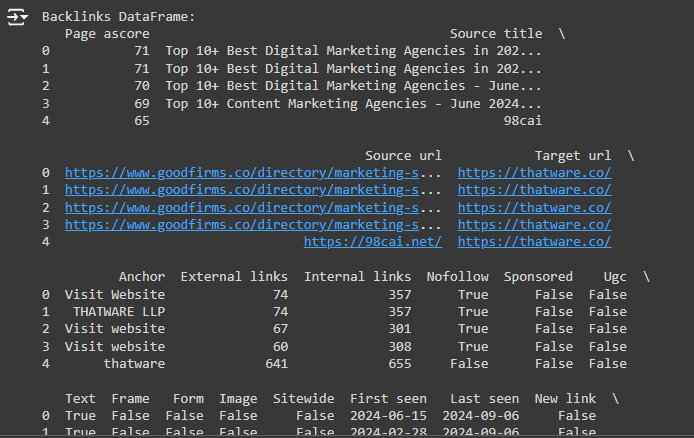
print(backlinks_df.head())
print(traffic_df.head())
Purpose: These lines display the first few rows of the backlinks and traffic datasets, so you can check what the data looks like.
· backlinks_df.head(): This shows the first 5 rows of the backlinks_df DataFrame. It gives you a quick view of the structure and content of the backlinks data.
· traffic_df.head(): This shows the first 5 rows of the traffic_df DataFrame. It helps you verify that the traffic data is loaded correctly and that the columns are what you expect.
· Why do this? It’s important to look at the data early in the process to make sure it was loaded correctly and to understand its structure (e.g., column names, data types).
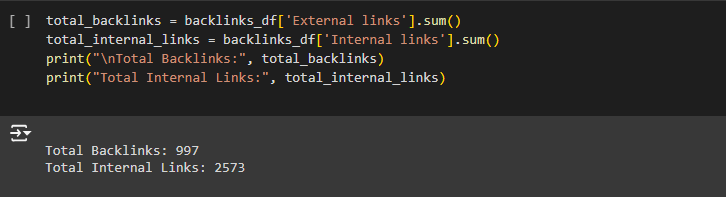
Step 1: Aggregating Backlink Data
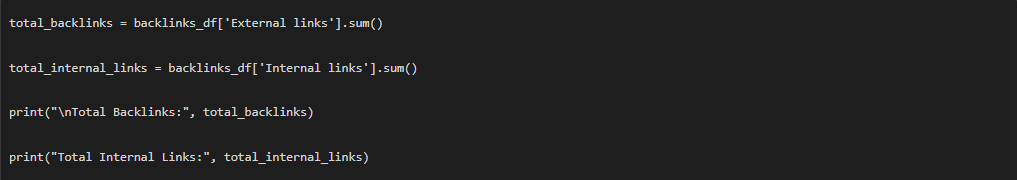
Purpose: We are summing up certain columns in the backlinks_df DataFrame to get total values.
- ‘External links’: This column might represent the number of backlinks (links from other websites).
- .sum(): Adds up all the values in this column to give the total number of backlinks.
- Example: If you have 5 rows of backlink data, and each row has different numbers of external links (say 10, 15, 20), this code will add them together to get the total.
- The same goes for internal links, which are links between pages on the same website.
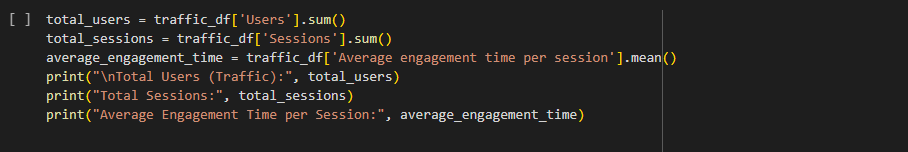
Step 2: Aggregating Traffic Data
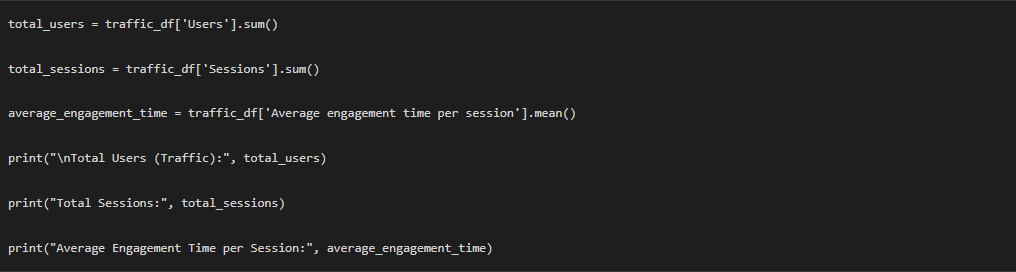
Purpose: We aggregate traffic data in the same way we did for the backlinks data.
- ‘Users’: This column contains the number of users (visitors) to the website. .sum() adds up all the users to give the total number of visitors.
- ‘Sessions’: This column contains the number of sessions (visits). .sum() gives the total number of visits.
- ‘Average engagement time per session’: This column shows how long visitors stay on the website during each session. .mean() calculates the average time.
- Example: If you have 3 sessions with engagement times of 40 seconds, 50 seconds, and 60 seconds, the average engagement time would be (40 + 50 + 60) ÷ 3 = 50 seconds.
Step 3: Preparing Data for Linear Regression
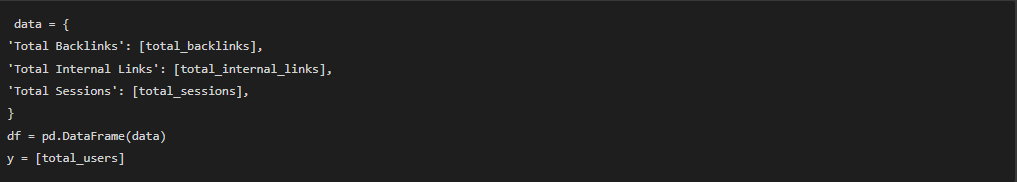
Purpose: Now, we create a small dataset to be used in the linear regression model.
- Independent Variables (X): These are the factors you think might influence the outcome (e.g., backlinks and sessions).
- Total Backlinks, Total Internal Links, and Total Sessions are independent variables stored in a table (df).
- Dependent Variable (y): This is what you want to predict (in this case, total users/traffic).
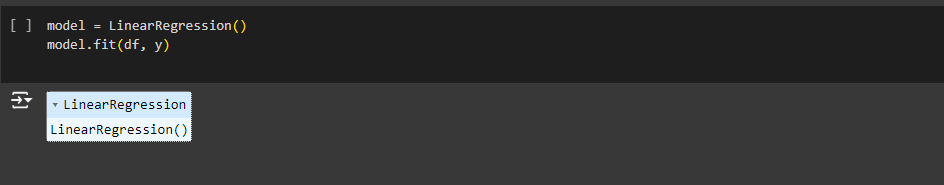
Step 4: Initializing the Linear Regression Model

Purpose: This step creates and trains the linear regression model.
- LinearRegression(): This function initializes the linear regression model.
- model.fit(df, y): The model is trained on the data in df (independent variables) and y (dependent variable). The model learns the relationships between the variables.
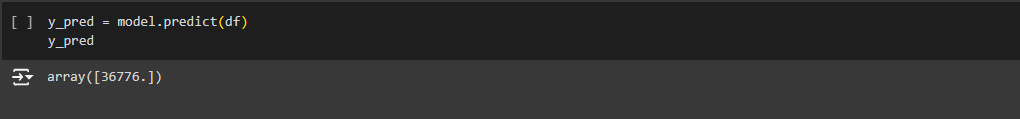
Step 5: Making Predictions

Purpose: The model is used to make predictions. Here, we’re using the same data we trained the model with (just for demonstration), so the model predicts the traffic (y) based on the given backlinks and sessions.
Step 6: Evaluating the Model
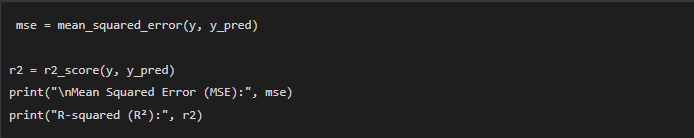
*Purpose: *This step checks how well the model performs by calculating two important metrics:
- Mean Squared Error (MSE): Measures how far off the predictions are from the actual values. Lower is better.
- R-squared (R²): Tells us how well the independent variables explain the variation in the dependent variable. Closer to 1 is better.
- Example: An R² of 0.8 means that the model can explain 80% of the variation in traffic.
Step 7: Interpreting the Model’s Coefficients
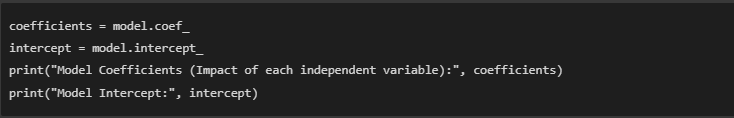
Purpose: This shows the coefficients (the impact of each independent variable) and the intercept (the predicted traffic when all independent variables are 0).
- Example: If the coefficient for** “Total Backlinks”** is 5, it means for every additional backlink, we expect 5 more users (traffic).
Understanding the Output:
Let me break down the output you got from the linear regression model step by step:
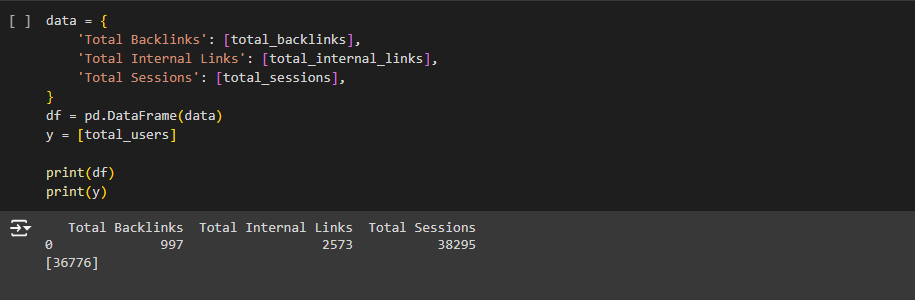
1. Total Backlinks: 997
Total Internal Links: 2573
- This means your website, thatware.co, has 997 backlinks (external links from other websites) and 2573 internal links (links between pages within your website). Backlinks are important for SEO because they help search engines trust and rank your site higher.
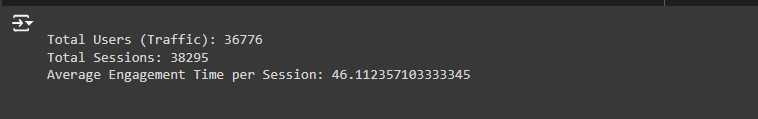
2. Total Users (Traffic): 36,776
Total Sessions: 38,295
Average Engagement Time per Session: 46.11 seconds
· Total Users refers to the total number of visitors your website received. In this case, thatware.co received 36,776 unique visitors.
· Total Sessions refers to the total number of visits made to your site, including repeat visits by the same users. Here, you had 38,295 sessions.
· Average Engagement Time per Session shows how long, on average, visitors stayed engaged with your site. In your case, it’s 46.11 seconds, meaning most users were actively browsing your site for about 46 seconds per session.
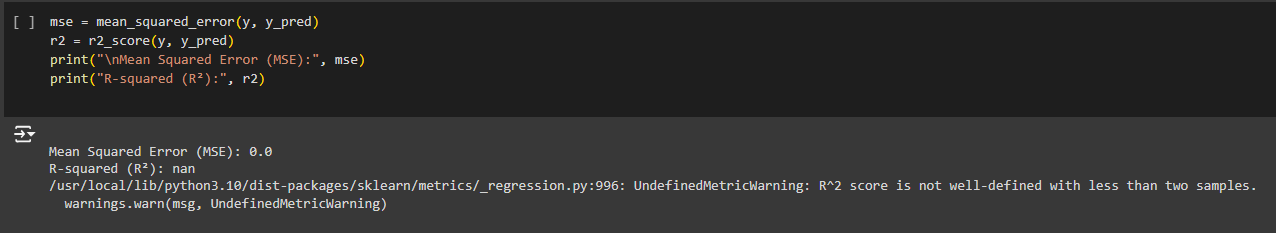
3. Mean Squared Error (MSE): 0.0
- The Mean Squared Error (MSE) tells you how far off the model’s predictions were from the actual values. An MSE of 0.0 means that your model perfectly predicted the actual traffic in the test data. However, this is because we only used one data point, which isn’t realistic for most cases.
4. R-squared (R²): Not well-defined (nan)
· R-squared (R²) measures how well the independent variables (backlinks, internal links, and sessions) explain the variation in the dependent variable (traffic). The value is not well-defined in your case because you only used one data point. You need more than one data point for R² to be meaningful.
· In practical terms, this means that we cannot determine how much of the change in traffic is explained by backlinks and internal links because there is not enough data.
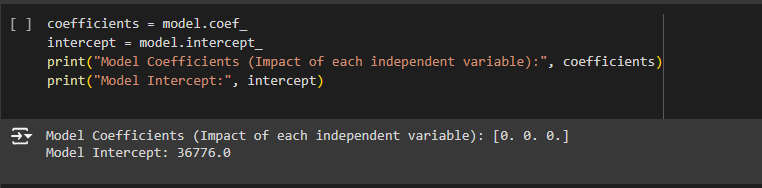
5. Model Coefficients: [0. 0. 0.]
Model Intercept: 36,776.0
· Model Coefficients tell you how much each independent variable (backlinks, internal links, and sessions) impacts the dependent variable (traffic). In this case, all the coefficients are 0, which means that the model did not find any meaningful relationship between the independent variables and the dependent variable (traffic). This is likely because you only used one data point, so the model didn’t have enough information to learn anything useful.
· The Model Intercept is the value of the dependent variable (traffic) when all the independent variables are zero. Here, it’s 36,776, which simply reflects the total traffic value that was fed into the model.
What Does This Mean for You?
1. MSE of 0.0:
- While the perfect prediction (MSE of 0) may seem great, it actually isn’t useful here because the model only had one data point to work with. In real-world applications, you’d use multiple data points (e.g., data from several months or different pages on your website) to create a meaningful model.
2. R-squared (R²):
- The fact that R² is not well-defined suggests that there wasn’t enough data for the model to properly evaluate the relationships between backlinks, internal links, and traffic. This means the model doesn’t provide any insights into how much backlinks or internal links impact traffic.
3. Coefficients of 0:
- The coefficients being 0 means that the model didn’t learn anything meaningful from the data because of the lack of data points. Normally, you’d expect positive or negative coefficients to show how backlinks, internal links, or other variables affect traffic, but in this case, the model can’t tell you that.
Next Steps for a Website Owner:
To get more meaningful insights from the data and linear regression model, here’s what a website owner should do:
1. Collect More Data:
- Gather data over time: Collect traffic data, backlink data, and engagement metrics over multiple time periods (e.g., months). The more data points you have, the better your model can learn.
- Use multiple pages: If possible, collect data for multiple pages of your website, not just one page, so the model has more information to learn from.
2. Use Relevant Metrics:
- Try to combine metrics that are directly related to your goal. For example, if you want to predict traffic, use backlinks, sessions, bounce rate, and content length as independent variables. Make sure these metrics are directly related to your goal.
3. Focus on SEO Improvements:
· Backlinks: Since backlinks are an important factor for SEO, focus on increasing high-quality backlinks. Reach out to other websites and promote your content to earn more backlinks.
· Page Load Time: Ensure that your website loads quickly. Google considers page speed a ranking factor, and faster pages tend to have lower bounce rates.
· Content: Make sure your content is in-depth and relevant. Longer, informative content tends to rank better and attract more traffic.
Improve User Engagement:
- The average engagement time per session is an important metric. If visitors are staying on your site for only 46 seconds, consider ways to increase engagement, like adding more compelling content, videos, or better navigation.

Thatware | Founder & CEO
Tuhin is recognized across the globe for his vision to revolutionize digital transformation industry with the help of cutting-edge technology. He won bronze for India at the Stevie Awards USA as well as winning the India Business Awards, India Technology Award, Top 100 influential tech leaders from Analytics Insights, Clutch Global Front runner in digital marketing, founder of the fastest growing company in Asia by The CEO Magazine and is a TEDx speaker.
