Guide To Kohonen Self Organizing Map (SOM)

Guide To Kohonen Self Organizing Map (SOM)

Get a Customized Website SEO Audit and Online Marketing Strategy and Action

    Self Organizing Map (or Kohonen Map or SOM) is a type of Artificial Neural Network. It follows an unsupervised learning model. It also represents the clustering concept by grouping similar data together. It is a technique to map multidimensional data onto lower-dimensional which allows people to reduce complex problems for easy interpretation.

    Kohonen self organizing map (SOM)

    It calculates the closest distance between the input vector & output vectors

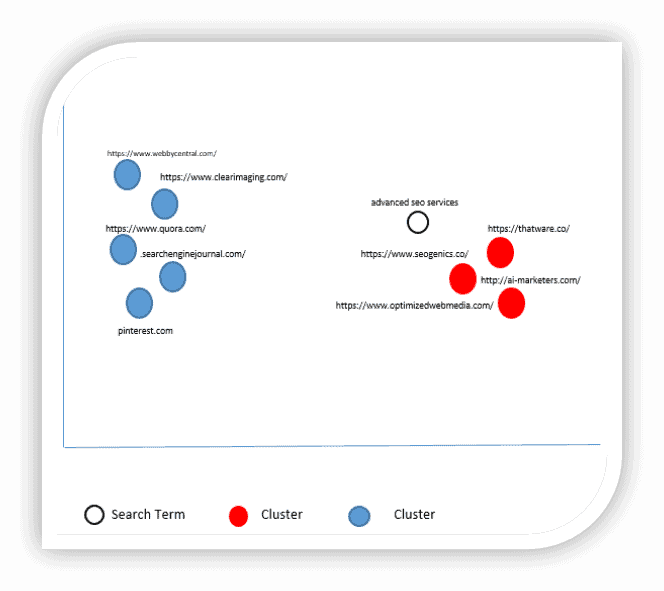
    Here we have to calculate a closer campaign according to the search term & we can easily find who are our top competitors. This program will help us find the actual competitors of our campaign & after finding the competitors; we can optimize our landing page’s properly for SERP improvements.

    Kohonen self organizing map Algorithm

    Each node weight initialize to a random value.

    Choose a random input vector

    Calculate the Euclidean distance between weight vector wij and the input vector x(t) connected with the first node, where t, i, j =0.

    Track the node that generates the smallest distance t.

    Calculate the overall Best Matching Unit (BMU). It means the node with the smallest distance from all calculated ones.

    Discover the topological neighbourhood βij(t) and its radius σ(t) of BMU in the Kohonen Map.

    Repeat for all nodes in the BMU neighbourhood: Update the weight vector w_ij of the first node in the neighbourhood of the BMU by including a fraction of the difference between the input vector x(t) and the weight w(t) of the neuron.

    Repeat the complete iteration until reaching the selected iteration limit t=n.

    Here, step 1 represents the initialization phase, while step 2 to 9 represents the training phase.

    Where;

    t = current iteration.

    i = row coordinate of the nodes grid.

    J = column coordinate of the nodes grid.

    W= weight vector

    w_ij = association weight between the nodes i,j in the grid.

    X = input vector

    X(t)= the input vector instance at iteration t

    β_ij = the neighbourhood function, decreasing and representing node i,j distance from the BMU.

    σ(t) = The radius of the neighbourhood function, which calculates how far neighbour nodes are examined in the 2D grid when updating vectors. It gradually decreases over time.

    FAQ

    A SOM is an unsupervised neural network algorithm created by Teuvo Kohonen in the 1980s. It maps high-dimensional input data onto a lower-dimensional (often 2D) grid of neurons while preserving topological (neighbourhood) relations among the data.

    Training involves: (1) initialising weight vectors for each neuron randomly; (2) for each input vector, finding the best matching unit (BMU) by Euclidean distance; (3) updating the BMU and its neighbours’ weights to move closer to the input; (4) gradually reducing learning rate and neighbourhood radius until convergence.

    Key components include: an input layer (with one node per feature), a lattice (grid) of output neurons each with a weight vector, a distance metric (e.g., Euclidean) to find the BMU, a neighbourhood function which decays over time, and a learning-rate schedule.

    The BMU is the neuron whose weight vector is closest to the input vector according to the chosen distance metric. It “wins” each iteration and triggers updates to itself and its neighbours.

    SOMs are used for clustering, dimensionality reduction, visualization of high-dimensional data, pattern recognition, anomaly detection, feature extraction, and in domains such as finance, geoscience, image analysis and more.

    Unlike k-means, SOMs preserve topological relationships (neighbourhood structure) on a grid. Unlike PCA, which is linear, SOMs handle non-linear mapping and give more interpretable visual maps of data.

    Advantages: intuitive 2D/3D visual maps of complex data, ability to capture and preserve topology, good for unsupervised learning and many features, useful for exploratory data analysis.

    Drawbacks include: training can be slow for large datasets, results depend on parameters (grid size, learning rate, neighbourhood radius), handling categorical data is less direct, and there's no explicit generative model of the data.

    Grid size depends on data complexity, sample size and computational constraints. A too-small grid underfits (coarse clustering); a too-large grid may overfit and slow convergence. Often experimentation with quantization error / topographic error helps.

    Yes — through online or incremental learning, SOMs can update weights with new inputs over time without retraining from scratch. This makes them suitable for dynamic or changing data environments.

    Summary of the Page - RAG-Ready Highlights

    Below are concise, structured insights summarizing the key principles, entities, and technologies discussed on this page.

    A Kohonen Self-Organizing Map (SOM) is an unsupervised artificial neural network used for clustering and dimensionality reduction. It maps high-dimensional data onto a lower-dimensional grid, making complex patterns easier to interpret. In SEO or competitive analysis, SOM can help organize campaign data, identify similar patterns, and highlight top competitors based on search terms.

    The SOM algorithm begins with initializing node weights randomly. It then selects a random input vector and calculates the Euclidean distance between this vector and each node’s weight vector. The node with the smallest distance becomes the Best Matching Unit (BMU). The algorithm next determines the BMU’s neighbourhood radius, which defines which nearby nodes will have their weights updated based on the input vector.

    During training, each node within the BMU’s neighbourhood updates its weight vectors by adjusting toward the input vector. The neighbourhood radius and learning influence decrease over time, allowing the map to refine itself gradually. This process repeats for all iterations until the network stabilizes. The final result is a structured, interpretable 2D grid that groups similar inputs, enabling clearer insights for applications like campaign optimization and SERP improvement.

    Tuhin Banik - Author

    Tuhin Banik

    Thatware | Founder & CEO

    Tuhin is recognized across the globe for his vision to revolutionize digital transformation industry with the help of cutting-edge technology. He won bronze for India at the Stevie Awards USA as well as winning the India Business Awards, India Technology Award, Top 100 influential tech leaders from Analytics Insights, Clutch Global Front runner in digital marketing, founder of the fastest growing company in Asia by The CEO Magazine and is a TEDx speaker and BrightonSEO speaker.