Get a Customized Website SEO Audit and SEO Marketing Strategy
How Branded Query Segmentation + Custom Chart Annotations Transform SEO Analysis & Reporting
Search engine optimisation has always relied on two fundamental pillars: understanding what’s happening and understanding why it’s happening. Since its earliest incarnation as Google Webmaster Tools, Google Search Console (GSC) has been the primary source of truth for organic search visibility — covering everything from indexing to impressions, clicks, search queries, and technical issues. Over the past decade, GSC has gradually evolved from a technical dashboard into a more holistic performance platform. Yet one major gap persisted: it didn’t provide enough context or segmentation to understand the story behind the numbers.
That changes in November 2025, with Google introducing two powerful new features designed to make SEO analysis clearer, faster, and far more actionable:
- A Branded vs Non-Branded Queries Filter
- Custom Chart Annotations for Performance reporting
These upgrades address a long-standing problem for SEO professionals: the difficulty of separating the influence of brand familiarity from organic discovery, and the challenge of correlating performance shifts with site changes, campaigns, or external events. Until now, analysts had to juggle multiple tools, spreadsheets, change logs, and regex workarounds just to understand what part of traffic growth came from brand awareness, and what part came from actual SEO improvements.
With the introduction of built-in query segmentation and visual performance annotations, GSC is entering a new era — moving from a diagnostic tool to a genuine analytics decision-support system. For the first time, SEOs, marketers, developers, and product teams can interpret trends with context, meaningfully connect cause-and-effect relationships, and produce reporting that tells a clear and compelling narrative.
Why This Update Matters in 2025
GSC’s Evolving Role in SEO Measurement
Historically, GSC has excelled at providing the raw data — impressions, clicks, CTR, and ranking positions. But interpreting that data has often required external tools, complex spreadsheets, or subjective assumptions. As search ecosystems have grown more competitive and algorithm updates more frequent, the demand for deeper segmentation and more contextual insights has intensified.
The Need for Precise Segmentation
One of the biggest analytical limitations in GSC has been the inability to clearly separate branded vs non-branded search performance. Brand-driven traffic behaves very differently from discovery-driven traffic, and without segmentation, it’s easy to misinterpret growth or decline. Until this update, analysts had to manually build lists of branded terms or rely on regex filtering — a time-consuming and error-prone process.
The new segmentation filter eliminates this friction.
The Complexity of Connecting Actions to Results
SEO performance does not exist in a vacuum. Rankings and clicks shift due to a wide range of factors:
- Site redesigns
- New content launches
- Technical updates
- Google algorithm updates
- PR campaigns and social media virality
- Server downtime
- Seasonal promotions
- External crises
Yet GSC previously offered no built-in way to document or overlay these events directly onto performance charts. Teams relied on separate logs or the memories of individuals — making it difficult to accurately attribute performance changes.
The new Custom Chart Annotations feature solves this problem elegantly by enabling teams to record events right on the timeline.
Two Major Upgrades — One Meaningful Leap Forward
Together, the branded queries filter and custom chart annotations bring SEO practitioners closer than ever to a unified analytics environment. This represents a significant mindset shift in GSC’s evolution:
➡️ From raw data → to contextualised insights
➡️ From diagnosis → to storytelling
➡️ From reactive troubleshooting → to proactive performance management
These features transform GSC from a tool you check periodically into a tool you can rely on daily to understand patterns and explain outcomes.
What Readers Will Learn
To help you take full advantage of these powerful new features, this guide walks you through everything you need to know. By the end, you’ll be able to integrate these tools into your workflow and use them to improve reporting, communication, and strategic decision-making.
1. What Each New Feature Does
You’ll get a clear and detailed explanation of the Branded vs Non-Branded Queries filter and the Custom Chart Annotations tool, including how they work, where to find them, and what data they influence.
2. How to Activate and Use Them
We’ll walk step-by-step through the process of applying branded segmentation and adding annotations so you can immediately begin using them in your GSC dashboards.
3. Real Workflows for SEO Teams
Learn exactly how SEOs, content managers, and technical teams can integrate these features into weekly or monthly processes — from reporting to debugging to campaign measurement.
4. How Both Features Work Together
You’ll see how branded segmentation and timeline annotations create a powerful synergy, giving you the ability to accurately attribute performance shifts to real-world actions.
5. Real-World Use Cases
We’ll explore examples across different industries and scenarios, such as PR-driven branded spikes, seasonal trends, technical deployments, and non-branded content cluster rollouts.
6. A 30-Day Implementation Plan
Finally, you’ll get a step-by-step, actionable plan to integrate these features into your SEO workflow — including auditing branded terms, setting up annotation conventions, enhancing reports, and running initial analyses.
The Branded Queries Filter: A Groundbreaking New Segment in GSC
The introduction of the Branded vs Non-Branded Queries Filter marks one of the most impactful Search Console updates in years. For the first time, GSC allows users to isolate two fundamentally different types of search intent: users who are already familiar with your brand versus those discovering you for the first time. This distinction unlocks a level of insight that SEOs previously had to build manually through complex filters, exports, and regex scripts.
What the Branded Queries Filter Is
Google’s Definition of Branded Search
Google classifies a query as branded when it contains terms that are directly associated with your brand identity. This includes:
- Your core brand name (“Nike”, “Tesla”, “Zendesk”)
- Brand variations, abbreviations, and misspellings (“Nkie”, “Telsa”, “Zdesk”)
- Product-line and family names (“Nike Pegasus”, “Tesla Model Y”, “Zendesk Sell”)
- Service-level brand terms (e.g., “Adobe Illustrator”, “Shopify Payments”)
- Implicit brand references, where Google infers user intent even without an explicit brand keyword — such as a unique product name associated only with your company.
This classification is dynamic, data-driven, and continuously updated as your brand evolves, gains popularity, or introduces new product terminology.
How It Appears in GSC
Once enabled for your property, the branded queries feature becomes accessible directly from your Performance report:
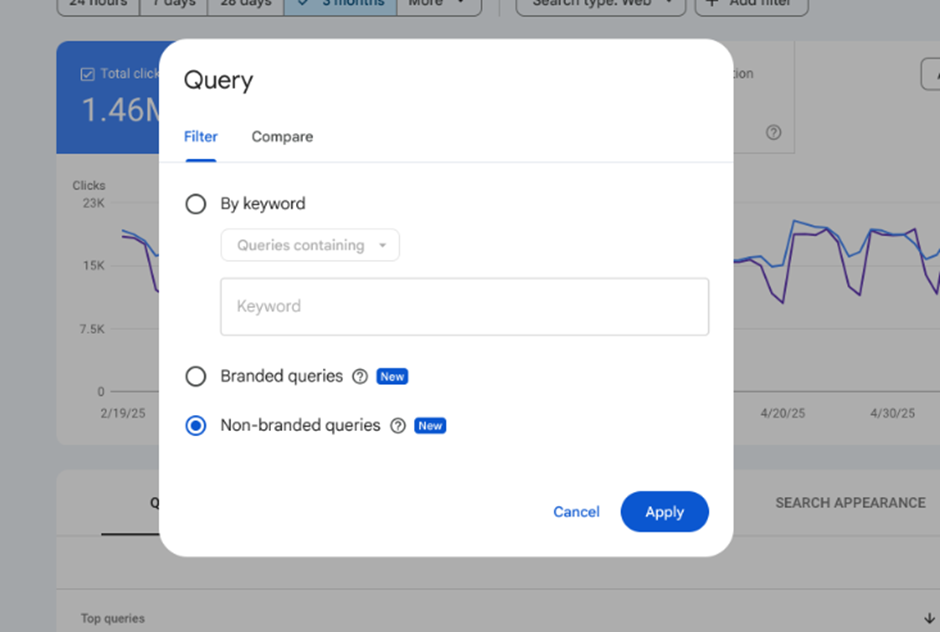
- Navigation Path:
Performance → Search Results → Queries → +New Filter → Query → Branded / Non-Branded - Dashboard Integration:
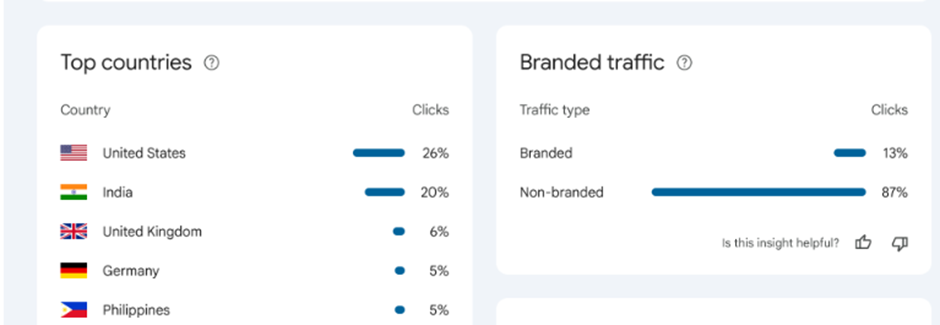
Many users will also see an Insights card summarizing total click distribution between branded and non-branded traffic — offering a quick snapshot of your search demand mix. - Rollout Limitations:
Google is gradually releasing this feature, and availability depends on:- Query and impression volume: Low-volume sites may not see it initially.
- Property type: URL-prefix and subdomain properties may not yet qualify.
- Classification confidence: Google may delay activation until it’s confident in identifying your brand terms.
These limitations will likely ease over time, but for now, some sites may see staggered rollout.
Behind the Scenes: How Google Likely Classifies Branded Queries
While Google doesn’t publicly detail the exact logic behind the branded filter, several signals likely inform the classification:
- Machine learning models trained on entity recognition
Google’s natural-language models identify brand names similarly to how they detect entities in Knowledge Panels. - Historical user patterns
Terms repeatedly associated with your website, products, or brand pages become part of your branded entity graph. - Semantic and lexical similarity models
These detect misspellings, close variations, and product synonyms. - Potential pitfalls:
- Generic brand names (e.g., “Apple”, “Target”, “Amazon”) may create ambiguity.
- Brands using common dictionary words may trigger misclassifications.
- Multilingual brand presence can confuse classification in non-English markets.
For these reasons, periodic validation is recommended to ensure Google’s classifications match your actual brand vocabulary.
Why Branded vs Non-Branded Matters for SEO
Clarifying Traffic Intent
Understanding search intent is foundational to SEO strategy. Branded and non-branded queries reflect two entirely different audiences:
- Branded traffic represents
- High intent
- Strong brand familiarity
- Repeat visitors, loyal users, or people influenced by marketing campaigns
- Non-branded traffic represents
- Discovery-stage users
- SEO-driven visibility
- People searching broader generic terms
When these two groups are blended together, it becomes nearly impossible to assess the real impact of your SEO efforts. A spike in branded traffic, for example, may look like SEO success — when in reality it’s due to a TV ad, PR campaign, or viral social post.
Segmentation eliminates that confusion.
Metric Differences Between Segments
Branded and non-branded queries often behave very differently:
- CTR: Branded queries typically enjoy significantly higher CTR because users already know what they want.
- Average Position: Branded queries often rank #1 or near the top by default. Non-branded rankings reflect real competitive performance.
- Conversions:
- Branded visits often convert exceptionally well.
- Non-branded traffic tends to be lower intent but higher volume.
- Funnel Positioning:
- Branded queries = bottom-of-funnel (BOFU)
- Non-branded = top-of-funnel (TOFU) or mid-funnel (MOFU)
These differences illustrate why blended reporting obscures strategic opportunities.
Improved ROI Reporting
The branded vs non-branded split dramatically enhances reporting quality:
- Show executives how much traffic is driven by brand investment (ads, PR, influencer marketing).
- Demonstrate SEO’s contribution to new user acquisition by highlighting non-branded growth.
- Strengthen cross-department communication — essential for CMOs, growth teams, and product managers.
- Make performance storytelling more accurate and credible, a major advantage in budget discussions.
This segmentation helps organisations justify investments and optimise resource allocation.
Time Savings vs Manual Regex Workflows
Before this update, the workflow for branded segmentation was painfully manual:
- Export GSC data
- Create regex lists of brand terms
- Segment data via spreadsheets or BI tools
- Clean and maintain keyword lists regularly
This process was error-prone, inconsistent across teams, and difficult for beginners.
Now, segmentation takes one click — no regex, no exports, no maintenance.
This not only saves time but makes analysis significantly more accessible across the organisation.
How to Use the Branded Query Filter (Step-by-Step Workflow)
Preparing the Dashboard
Before applying the branded filter, set up the broader analysis environment:
- Choose comparison periods:
Depending on your goals, these may include:- Year-over-year (YoY)
- Month-over-month (MoM)
- Campaign-specific windows
- Verify the search type:
Branded/non-branded segmentation can differ across:- Web search
- Image search
- Video search
- News or Discover (if available)
Starting with consistent settings ensures accurate interpretation.
Applying the Filter
A clear, simple path:
- Open Performance → Search Results
- Select your date range
- Click + New → Query → Branded / Non-Branded
- Switch between segments or run side-by-side comparisons
- Export or chart data for deeper reporting or dashboard creation
Within minutes, you can produce segmented visibility trends and insights.
Interpreting the Data
Some common patterns to watch for:
- Non-branded growing slower than branded:
May indicate brand strength but stagnating SEO discovery. - Branded spikes without corresponding non-branded growth:
Likely caused by PR events, TV ads, influencer partnerships, or offline campaigns. - Both segments declining simultaneously:
Warning signal of:- Technical issues
- Major algorithm impacts
- Indexing or crawlability problems
- Analytics misconfigurations
Segmentation turns interpretation from guesswork into clarity.
Practical Scenarios
Here are concrete examples where branded vs non-branded segmentation becomes essential:
- TV or PR Campaign:
Branded traffic spikes, but non-branded stays stagnant → indicates marketing-driven awareness.
- Publishing a New Content Cluster:
Non-branded impressions rise steadily → proof of successful SEO-driven discovery.
- Brands with Multiple Product Lines:
Allows tracking each product family’s brand recognition separately.
- Link Building Campaign:
Non-branded keywords often benefit most from authority growth → segmentation helps isolate impact.
These scenarios highlight how this filter strengthens performance attribution across teams.
Caveats & Limitations
Classification Accuracy Issues
While powerful, the branded filter isn’t perfect:
- Missed synonyms or product nicknames
- Competitor names embedded within your brand name
- Overlapping dictionary words
- Inconsistent recognition during rebrands
Regular verification is advised.
Availability Constraints
Some factors affect rollout:
- Data volume thresholds: Smaller websites may not qualify early.
- Property types: URL-prefix properties might not be supported yet.
- Regional and multilingual properties: Branded classification may vary across languages.
These limitations are expected to improve as adoption grows.
Cross-Team Coordination Is Essential
Branded search volume is influenced by far more than SEO:
- PR hits
- Offline advertising
- Viral social media events
- App-store ranking changes
- Crisis events
- Major product launches
SEOs must collaborate with other teams to interpret branded signals accurately.
Best Practices for Using Branded Segmentation
To get the most out of this feature:
- Set quarterly goals for non-branded growth — the real indicator of SEO success.
- Use MoM and YoY comparisons to identify long-term trends.
- Create two KPI dashboards:
- Brand Health (branded-only metrics)
- SEO Discovery Growth (non-branded metrics)
- Align SEO with PPC segmentation:
Both teams should speak the same “brand vs non-brand” language. - Use segmentation for content gap analysis to identify where new articles can capture non-branded demand.
When applied consistently, branded segmentation becomes a meaningful strategic lens rather than just another filter.
Custom Chart Annotations: The Missing Link in GSC Since 2015
For years, Google Search Console has offered a wealth of performance data — but without context, even the most detailed charts can feel incomplete. SEO professionals have long relied on external documentation, spreadsheets, Slack messages, and institutional memory to understand why performance changed on specific dates. With the introduction of Custom Chart Annotations, Google finally fills this gap, giving users the ability to embed their own notes directly into GSC’s performance timeline.
This feature is one of the most impactful analytics upgrades Google has released in the last decade. Below, we break down what annotations are, why they matter, and how to integrate them into a modern SEO workflow.
What Custom Annotations Are
Definition & How They Work
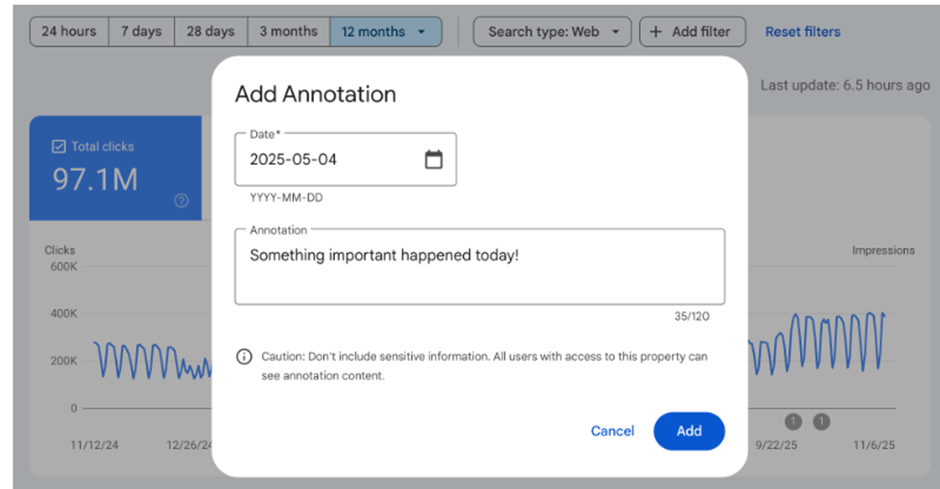
Custom Chart Annotations allow you to attach short notes—up to 120 characters—to specific dates on your GSC Performance chart. The process couldn’t be simpler:
- Right-click on any date in the performance graph
- Select “Add annotation”
- Enter your note (≤ 120 characters)
- Save it
- A small marker icon appears on the timeline
- Hover over it anytime to see the note
Every user with access to the property will see these annotations, making them shared contextual markers that enhance collaboration and transparency.
Annotation Limits & Rules
While powerful, annotations work within a set of constraints:
- 200 annotation limit per property
- Auto-expiry after ~500 days (about 16 months)
- Annotations cannot be edited — only deleted
- Visible only in the standard timeline chart
- Supported across most common filters and chart views
These rules emphasize the importance of meaningful, well-considered annotations — without clutter or unnecessary noise.
Why Annotations Matter for SEO Teams
Annotations fundamentally change how teams interpret shifts in search performance. Here’s why they’re such a game-changer.
Solving the Causality Problem
One of the hardest challenges in SEO is determining the cause of performance changes. Without context:
- A surge in clicks might be mistaken for an algorithm win
- A drop in impressions might falsely be attributed to a penalty
- Seasonal shifts may be confused with ranking issues
Annotations turn vague assumptions into grounded interpretations. By marking exactly when events happened, your performance graph gains an immediate layer of meaning. No more guesswork.
Replacing External Logs
Most SEO teams juggle change logs across:
- Spreadsheets
- PM platforms
- Slack threads
- Email updates
- Internal wikis
This fragmentation often leads to confusion and outdated documentation. GSC annotations replace these scattered records with one unified timeline, directly tied to performance data. Now, SEO, development, and content teams can all align behind one central source of truth.
Better Stakeholder Communication
For executives, CMOs, product leads, or clients — charts without context are nearly impossible to understand. With annotations, presentations become infinitely clearer.
Instead of saying: “We saw a jump here around mid-March.”
You can say: “This jump started 10 days after our new landing page cluster went live.”
The difference in clarity, confidence, and perceived strategic intent is enormous.
Helping Future Teams
When team members leave, take vacations, or shift roles, knowledge often leaves with them. Annotations preserve:
- SEO initiative history
- Technical change timelines
- Algorithm event logs
- Marketing and PR triggers
New hires or contractors can instantly understand months of development with a quick scan of the annotations. This dramatically reduces onboarding friction and builds long-term operational continuity.
How to Add & Use Annotations (Step-by-Step)
When to Add an Annotation
You should annotate any event that has the potential to affect search performance. This includes:
- Major content releases
- New product/category launches
- Website redesigns
- Server or infrastructure migrations
- Technical fixes
- URL structure changes
- Backlink or PR campaigns
- Google algorithm updates
- Seasonal campaigns or promotions
- Downtime or indexing problems
- Significant UX or performance updates (e.g., lazy loading, CWV enhancements)
If it can move the needle, it deserves an annotation.
Adding the Annotation
Adding an annotation is a simple 5-step process:
- Open your Performance chart in GSC
- Navigate to the date associated with the event
- Right-click the chart → select Add annotation
- Type a short, clear note (up to 120 characters)
- Save and confirm — the marker appears immediately
Congratulations — you’ve just added context to your data.
Annotation Best Practices
To get maximum value, follow these guidelines:
1. Maintain Consistency
Use a standardized format. For example:
- Content — Cluster A published
- Tech — Speed fix deployed
- Marketing — Summer promo launch
2. Keep Notes Short & High-Level
Avoid unnecessary detail. Instead of: “We restructured the entire blog architecture across 40 URLs.”
Use: “Tech — Blog architecture update”
3. Avoid Sensitive Information
Everything in GSC is visible to all property users.
Never include internal strategy, financials, salaries, or client data.
4. Use Manual “Categories”
Prefixes help visually sort annotations quickly.
5. Maintain a Shared Team Guideline
A simple team document ensures everyone uses the same naming approach.
Examples of Effective Annotation Notes
- “New CMS migration — week 1”
- “E-E-A-T enhancements deployed”
- “PR campaign: Influencer collab live”
- “Google Core Update confirmed”
- “Backlink outreach begins — Agency X”
- “Product line rebrand launch”
- “Server downtime (2 hrs)”
- “Holiday sale promo starts”
Short, clear, and immediately interpretable.
Caveats & Limitations
Even though annotations are extremely useful, you need to be aware of their limitations.
No Editing Allowed
Once created, annotations cannot be edited — only deleted and re-added.
Why this matters:
- Accuracy becomes critical
- Spelling errors require deletion
- You may lose the original context when deleting
Best practice: Take a moment to rewrite your note before saving.
Auto-Expiry After 500 Days
Annotations disappear after roughly 16 months. For long-term projects or multi-year SEO initiatives:
- Maintain a separate backup log in your internal documentation
- Re-add critical multi-year events when needed
This prevents important context from disappearing over time.
Visibility Limitations
Annotations may not appear in:
- Comparison views (e.g., compare dates)
- Certain experimental chart types
- 24-hour data views
- Data extracted via the GSC API
This means annotations are primarily designed for the standard performance chart.
Practical Use Cases
Custom Chart Annotations open up a wide range of analytical possibilities across SEO and marketing disciplines.
Attribution Models
Annotations help prove what actually led to a performance shift:
- Correlate spikes to campaigns
- Validate SEO hypotheses
- Distinguish algorithm-update impacts from technical fixes
- Document precisely when indexing fixes or content rewrites were deployed
Annotations make attribution significantly more precise.
Content Strategy Alignment
For content-heavy sites:
- Mark when content clusters go live
- Track time-to-rank (publish date → ranking growth)
- Identify which content formats drive the biggest improvements
- Monitor publishing cadence consistency
This makes editorial planning more data-driven.
Technical SEO Debugging
Technical teams benefit immensely by marking:
- Crawl budget optimizations
- Page-speed enhancements
- Schema improvements
- Core Web Vitals updates
- Infrastructure changes
Seeing performance shifts relative to these events accelerates diagnosis and proves ROI.
Cross-Channel Marketing Analysis
Annotations allow you to overlay marketing initiatives onto SEO performance:
- PPC brand campaigns → check if branded queries spike
- Email campaigns → measure short-term traffic jumps
- Social virality → branded uplift
- TV/PR launches → immediate search interest
- Influencer campaigns → track demand surges
Instead of guessing whether marketing influenced search demand, you can verify it directly.
Why These Two Features Are More Powerful Together
Google’s November 2025 updates to Search Console introduce two features that, while individually valuable, become exponentially more powerful when used together. The Branded vs Non-Branded Queries filter gives you a clearer understanding of what changed in your traffic — the nature of the audiences reaching your site. The Custom Chart Annotations feature explains why those changes happened by tying performance shifts to real events, decisions, or external factors.
Together, they transform raw data into a narrative you can understand, trust, and communicate.
Bridging Segmentation + Timeline Context
Branded Segmentation Shows What Type of Traffic Changed
With the new branded filter, you instantly see whether growth or decline came from:
- People actively searching for your brand (branded traffic)
- People discovering you through generic or informational keywords (non-branded traffic)
This segmentation alone resolves one of the biggest historical issues in SEO reporting: identifying whether traffic surges are a result of brand strength, PR, offline marketing — or actual SEO improvements.
Annotations Show Why It Changed
Annotations allow you to document when something meaningful happened:
- A major PR campaign
- A site redesign
- A technical SEO fix
- An algorithm update
- A new marketing initiative
- A large content cluster being published
These events help you contextualise performance patterns. When a spike or drop occurs, you can immediately see what happened on or around that date.
Together: Clear Cause–Effect Narratives
When you combine segmentation (what changed) with annotations (why it changed), you gain a level of analytical clarity that was previously missing in GSC. Suddenly:
- A spike in branded searches aligns with a PR campaign
- A dip in non-branded clicks coincides with a technical issue
- A rise in non-branded impressions kicks in shortly after a content rollout
- A drop in both segments hints at an algorithm update or major site problem
This dual-lens view turns your organic search data into actionable knowledge — not just numbers on a page.
Scenario Walkthroughs: Realistic Examples
To illustrate how the two features work together, let’s look at several real-world scenarios where segmentation + annotation create meaningful insights.
Content Campaign Designed for Non-Branded Growth
Your team launches a content cluster targeting new informational queries. Here’s the workflow:
- Add an annotation for the campaign launch
– Example: “Cluster X: 20 new blog posts published.” - Apply the Non-Branded filter in GSC
– This isolates the performance of new-user discovery traffic. - Observe uplift in non-branded impressions and clicks
– Typically 7–30 days after publishing.
– Check for increased visibility of specific informational keywords. - Present results tied directly to the annotation timeline
– You can say: “Non-branded impressions grew 28% in the month following the content rollout.”
– Stakeholders now have clear evidence of content performance.
Without segmentation, the rise might have been mistaken for brand visibility. Without annotations, the cause might have been forgotten. Together, the story becomes crystal clear.
PR Event Leading to Branded Search Surge
Imagine your company gets featured in a major news outlet or an influencer collaboration goes viral.
- Apply the Branded filter → Immediately see a spike in brand queries.
- Annotation explains the source → “PR: Forbes interview published.”
- Stakeholders understand the spike is PR-driven, not SEO-driven.
This distinction is crucial. Otherwise, a PR-driven surge might be mistakenly credited to SEO, leading to inaccurate reporting or misallocated resources.
By segmenting branded traffic and referencing the annotation, you preserve clarity:
Brand-awareness efforts boosted traffic, not search optimisation.
Technical Fix Leading to Gradual Recovery
Technical issues — like indexing drops, slow pages, or broken internal links — often affect both branded and non-branded performance, but not always equally.
- Add annotation: “Indexing fix deployed.”
- Track performance for 30–60 days after the fix.
– Are impressions recovering?
– Is click-through rate improving?
– Which segment recovers faster?
In many cases:
- Branded traffic returns first, because brand-aware users are more resilient to ranking fluctuations.
- Non-branded traffic recovers more slowly, especially if rankings were affected.
Using both:
- You get clearer proof that the fix worked.
- You can report transparent recovery patterns to developers or stakeholders.
- You can refine future technical rollout processes based on observed timelines.
Algorithm Update Impact Analysis
Google algorithm updates can dramatically affect ranking patterns — but not always uniformly across branded vs non-branded queries.
Here’s how segmentation + annotations help:
- Add an annotation on the confirmed update date.
- Apply the branded filter
– Often branded traffic remains steady because searchers already know you. - Apply the non-branded filter
– This may show declines or gains depending on how the update impacted informational/generic rankings. - Build a narrative of algorithmic sensitivity
– “The November Core Update impacted non-branded queries related to Topic X. Branded search remained stable.”
This provides clarity on whether performance changes are due to Google’s algorithm rather than internal issues — enabling appropriate action.
The SEO Storybook: Turning Data into a Narrative
When combined, annotations and branded segmentation turn your GSC analytics into a living, breathing SEO storybook — a chronological narrative that documents your organisation’s search history.
How This Storybook Works
Each annotation becomes a chapter marker:
- New campaigns
- Site updates
- Experiments
- Mistakes
- Recoveries
- Algorithm shifts
- Technical rollouts
- Press mentions
- Launches & milestones
Each segmentation filter becomes a lens that reveals:
- Which traffic segment reacted
- Which pages benefited
- Which queries grew or fell
- How user intent changed over time
Why This Matters for Teams
This storybook becomes invaluable for:
- Presentations
– Executives love seeing cause-and-effect narratives.
– Reports become storytelling instead of spreadsheets. - Audits
– Consultants or new team members quickly understand your SEO history.
– No more hunting for change logs in scattered tools. - Stakeholder Education
– Marketing, content, dev, and leadership get aligned around what drives outcomes. - Future-Proofing
– Institutional memory is preserved.
– Decisions become data-informed, not guesswork.
Reduces Guesswork for Future Team Members
When a new SEO joins the company, they no longer need to ask:
- “When did the redesign happen?”
- “Why did traffic dip in August?”
- “Was this drop algorithmic or a site change?”
- “When did the content team launch that campaign?”
The answers are already annotated in charts — timestamped, contextualised, and segmented.
Creates a Performance Timeline Including:
- Wins — campaigns, successful redesigns, new content clusters
- Experiments — tests that worked (or didn’t)
- Mistakes — accidental no-index tags, failed deployments
- External Impacts — PR features, seasonal boosts, crises
- Recoveries — post-update rebounds, technical fixes
This transforms SEO from a series of disconnected tasks into a cohesive, documented narrative of growth.
30-Day Action Plan to Adopt These Features
Implementing the new Google Search Console updates doesn’t require a complete overhaul of your workflows. With a structured approach, you can begin benefiting from branded query segmentation and custom annotations within just a month. The following step-by-step, four-week plan will help you embed these features into your daily SEO operations, streamline reporting, and strengthen cross-team collaboration.
Week 1 — Setup & Audit
Before diving into segmentation and annotation workflows, your first step is ensuring all necessary GSC capabilities are available, accurate, and properly configured.
✔ Check Property Access
Make sure all relevant team members — SEO strategists, content managers, developers, and analysts — have the correct permission levels in GSC.
- Confirm that access is granted to the correct domain-level property, not a URL-prefix version, so branded segmentation works consistently.
- Ensure agencies or external partners have access if they will contribute to annotations or reporting.
✔ Confirm Branded Filter Availability
The Branded vs Non-Branded Queries filter is still rolling out across properties.
- Visit Performance → Search Results → + New Filter → Query to see if “Branded” and “Non-branded” appear.
- If not available, add a reminder to check weekly — access may enable automatically once your property hits Google’s query-volume threshold.
✔ Verify Branded Classification Accuracy
Google largely automates branded recognition, but it’s vital to confirm nothing important is missing.
- Apply the Branded filter and browse through top queries.
- Look for unclassified variants such as:
- Abbreviations
- Product family names
- Brand misspellings
- Local-language brand variations
- Apply the Non-branded filter and check for accidental inclusions of brand queries that slipped through.
Correcting classification happens through Google’s internal learning—not manual tagging—so your role is simply to stay aware of inconsistencies.
✔ Make a List of All Brand Names, Sub-Brands, & Misspellings
Build an internal “brand dictionary” your team aligns on:
- Main brand name
- Legacy brand names
- Product lines
- Service variants
- Common user misspellings
- Abbreviated forms
- Regional brand versions
This list will guide your audits, reporting, and future segmentation interpretation.
Week 2 — Reporting Enhancements
Once the foundational setup is complete, begin integrating the new features into your analytics reporting. The goal this week is to create segmented dashboards and establish a baseline.
✔ Build a Weekly Dashboard With Branded & Non-Branded Tabs
Set up two distinct views:
- Branded Performance Dashboard
- Non-Branded Performance Dashboard
These become the cornerstone of your future reporting structure.
✔ Add Segmented CTR, Impressions, Clicks, Rankings
For each dashboard, include:
- Total clicks
- Total impressions
- Average CTR
- Average position
- Keyword trends
- Page-level segmentation
This structure allows quick visibility into how each segment behaves differently.
✔ Identify Current Ratios (e.g., 60/40 Split)
Determine what percentage of your current traffic is branded vs non-branded.
This ratio becomes your baseline for evaluating:
- Brand-awareness growth
- Discovery-based SEO progress
- Impact of upcoming campaigns
Example benchmarks:
- High-branded ratio (70%+): strong brand awareness, but limited discovery growth
- Balanced ratio (50/50): healthy mixed traffic
- High non-branded ratio (70%+): strong SEO acquisition potential
✔ Spot Quick Wins
Using the non-branded segment, identify:
- Pages with high impressions but low CTR
- High-ranking keywords that could be lifted to page one
- Thin content opportunities in emerging topics
- Pages ranking on page 2–3 that need internal links, content refreshes, or FAQs
And on the branded side, look for:
- Pages not capturing branded queries effectively
- Outdated landing pages hurting brand perception
- Queries indicating potential new product or brand directions
By the end of Week 2, your dashboards should provide clear visibility into your traffic composition and early optimization opportunities.
Week 3 — Start Annotating Key Events
Now that you have clean segmentation and consistent dashboards, it’s time to start adding context to your performance data directly within GSC.
✔ Add 3–5 Foundational Annotations
Start by marking the most significant events from the last several months or upcoming weeks. Examples:
- Last major redesign
“Site redesign launched — New UX + template rollout”
- Key content releases
“Topical authority cluster: 18 articles published”
- Latest algorithm updates
“Google Core Update confirmed — volatility expected”
- Major marketing campaigns
“Brand TV ad campaign launched nationwide”
These initial annotations create the baseline for future interpretation.
✔ Build Annotation Naming Rules for Consistency
Create an internal framework for annotation clarity. For example:
- Prefix by category:
- Content —
- Tech —
- PR —
- PPC —
- Algo —
- Use concise verbs: launched, fixed, deployed, released, migrated
- Keep all notes under 120 characters
- Avoid confidential or sensitive details (contracts, revenue, internal issues)
✔ Share Guidelines Across Teams
Send the annotation rules to:
- Developers (for technical deployments)
- Content teams (for major content pushes)
- Marketing/PR (for brand and campaign launches)
- Leadership, if they review GSC data
- External agencies, if they track campaigns or updates
When everyone contributes, the annotation timeline becomes a single source of truth — a shared history of everything affecting performance.
Week 4 — Strategic Insights & Cross-Team Alignment
With segmentation and annotations now embedded, Week 4 is dedicated to turning data into strategic insights and aligning stakeholders around that intelligence.
✔ Analyze Recent 30–90 Day Performance Using Both Lenses
Apply the branded and non-branded filters and overlay annotation dates to uncover:
- Correlations between campaigns and branded traffic spikes
- Impact of technical improvements on non-branded rankings
- Effects of algorithm updates on different keyword types
- Seasonality trends with context
This is where the new features combine to provide genuine cause-and-effect understanding.
✔ Align With PR, PPC, and Content Teams
Branded and non-branded segmentation becomes especially powerful when shared across channels.
PR & Brand Teams
Use branded query trends to evaluate:
- Press coverage strength
- Brand awareness campaigns
- Offline ads or influencer pushes
PPC Teams
Compare branded search trends with:
- Brand bidding campaigns
- Rising branded search demand
- Cannibalization vs amplification patterns
Content Teams
Use non-branded data to identify:
- Keyword gaps
- High-potential topics
- Content refreshing opportunities
- Searcher intent changes
This cross-team insight closes the loop between organic, paid, PR, and product storytelling.
✔ Build a Quarterly Reporting Template Using Both Features
Create a new reporting structure including:
- Branded vs non-branded KPIs
- Month-over-month and quarter-over-quarter comparisons
- Annotation-highlighted performance shifts
- Campaign-specific attribution charts
- Insights broken out by content categories or landing pages
Your reports instantly become more transparent, data-driven, and credible.
✔ Plan New Experiments Validated via Annotations
Use your new clarity to test:
- Content release patterns
- Metadata experimentation
- New internal-linking strategies
- Structured data rollouts
- Technical SEO improvements
- PR or brand awareness initiatives
Annotate each experiment’s start date so results can be measured, evaluated, and scaled.
Conclusion
Why November 2025 Matters for GSC’s Evolution
The November 2025 update marks one of the most meaningful milestones in the history of Google Search Console. For the first time, GSC provides native segmentation of query types, allowing users to instantly separate branded from non-branded traffic without regex workarounds, spreadsheets, or external tools. This alone is a breakthrough for SEO analysts, marketers, and decision-makers who rely on clean, interpretable data to understand what’s actually driving growth.
Just as transformative is the introduction of contextual performance tracking through custom chart annotations. Until now, the story behind performance patterns — why something increased, when a change occurred, or how a campaign influenced traffic — lived outside of GSC. With the ability to annotate key dates directly within your performance timeline, GSC finally supports the kind of contextual visibility SEO teams have needed for years.
Together, these upgrades move GSC closer to the analytical sophistication of GA4’s event-based reporting. While GSC historically provided raw data and trends, the new combination of segmentation + annotation empowers users to blend data + context, enabling richer, more accurate interpretations. It’s a foundational shift: GSC is no longer just a diagnostic tool — it is evolving into a full-fledged performance analysis and decision-making platform.
Benefits Summarized
The two new features introduced in this update deliver substantial practical value for every role involved in organic search. Here’s a concise look at how they upgrade your workflow:
1. Clearer Search-Intent Segmentation
Separating branded vs non-branded queries allows teams to correctly distinguish discovery-driven growth from brand-awareness growth — ending years of mixed-signal analysis.
2. Better Documentation of Changes
Custom annotations turn your performance graph into a living changelog. Events, updates, fixes, launches, and campaigns can finally be viewed directly alongside their impact.
3. Stronger ROI Demonstration
Whether it’s content marketing, branding, SEO, or editorial work, segmentation and annotations make it easier to attribute results, quantify contributions, and communicate value to stakeholders.
4. Improved Collaboration Across Teams
Because annotations are visible to anyone with property access, they create a shared source of truth. SEO, content, PR, dev, product, and growth teams can all contribute to — and benefit from — a more unified performance history.
5. More Confident Decision-Making
With the fog lifted from search analysis, teams are better equipped to interpret trends, identify causality, and make informed decisions without guesswork or misattribution.
Wrapping Up
These features are live (or rolling out), and there’s no reason to wait. To start benefiting immediately, take the following simple steps:
1. Log Into GSC and Try the Branded Filter
Explore how your search traffic divides between brand-aware users and new discovery audiences. You may be surprised by the ratio.
2. Add Your First Set of Annotations
Pick a few key events — a recent site change, a content release, or a known algorithm update — and mark them on your chart. This alone will transform how you interpret your performance graph.
3. Build a Simple Segmentation-Based Dashboard
Create a branded vs non-branded report in your weekly or monthly analytics workflow. Use it to track awareness growth, SEO effectiveness, and campaign outcomes.
4. Start Treating Your GSC Performance Graph Like a Narrative Timeline
Your graph is no longer just data points. It’s a story of your website’s evolution — its experiments, wins, challenges, and improvements. Use annotations and segmentation to document that story the right way.
November 2025 represents a turning point for search performance analysis. With clearer segmentation and built-in contextual insights, GSC now empowers SEO teams to understand not only what changed — but why. The result is more transparent reporting, more accurate attribution, and a more confident approach to decision-making.
If you haven’t explored these new features yet, now is the perfect moment to begin building your search performance story with clarity, context, and confidence.
