Welcome to THATWARE, we are on a mission to innovate SEO using artificial intelligence, machine learning, and data science.
Here we are publicly sharing some of our whitepaper on how AI can be utilized for the benefit of optimizing a page for better SEO performance. We are using cutting edge technologies from various fields such as NLP, information retrieval, semantic engineering, data science, AI, language R, and etc.
Disclaimer: This whitepaper should not be used without the consent and permission of THATWARE, if used please do mention the source as us! Furthermore, this whitepaper documentation is legally licensed & registered under Copyright Act, 1957 under the name of THATWARE LLP.
1. USING BAG OF WORD(WORD CLOUD) TO FIND OUT THE BEST FEATURED ANCHOR TEXT:
Introduction:
Bag of Words, in short BoW is use to extract featured keyword from a text document. These features can be used for training machine learning algorithms. Basically speaking Bag of words is an algorithm that counts how many times a word appears in a document. Word counts allow us to compare documents and their similarities and it is used in many various fields.
Analysis:
By counting word occurrence the numbers of occurrences represent the importance of word. More frequency means more importance. First we tokenize each and every word in the text document then we use the tokenized words for each observation and find out the frequency of each token. After that we can determine the frequency of a particular word which will later on indicate a relevancy of a keyword to a particular site.
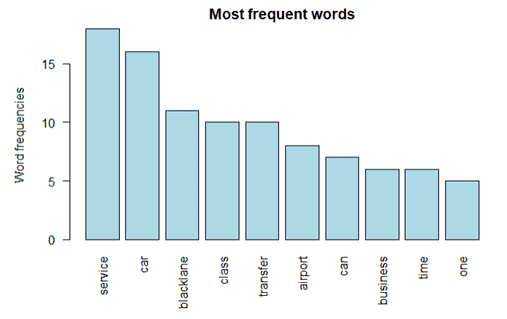
Taken a corpus (Collection of documents) which contains text related to the site, we vectorized all the word in corpus and separated them, each and word has a value (integer) that indicates their occurrences later on we have created a visualization to clear out which word stands out the most. At the end to get a fine anchor text from particular content is we extracted the highest most frequently occurring words from the corpus.
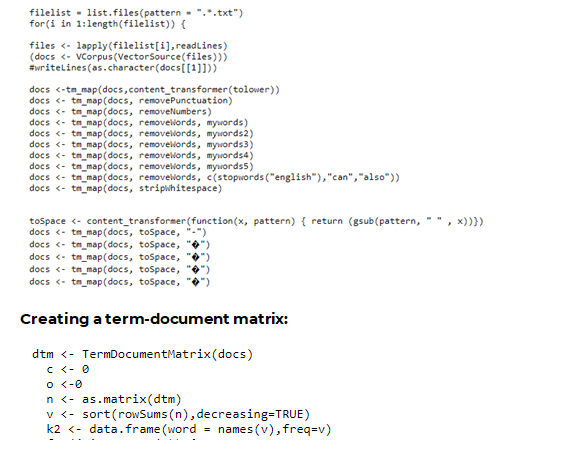
Creating into a corpus the cleaning them, also converting it into the lower case:

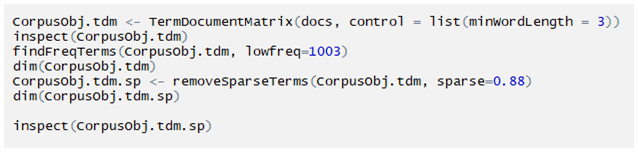
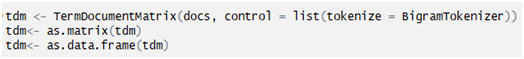
Creating a term-document matrix:
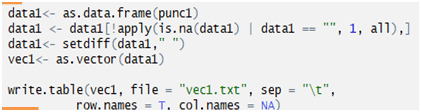
Sorting the data and converting into a data frame:

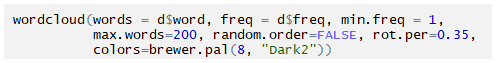
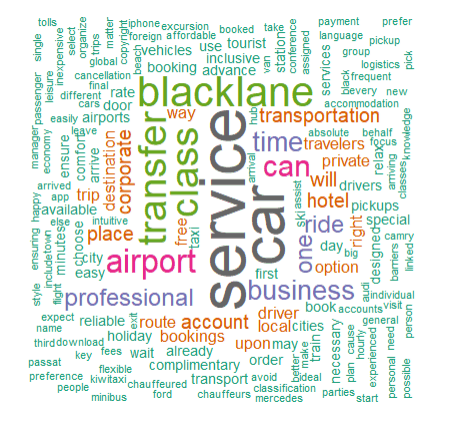
Creating a word cloud:
OUTPUT:
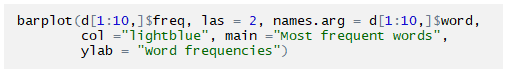
Also creating a barplot:
USE IN SEO:
The Bag-of-words model is mainly used as a tool of feature generation. After transforming the text into a “bag of words”, we can calculate various measures to characterize the text. The most common type of characteristics or features calculated from the Bag-of-words model is term frequency, namely, the number of times a term appears in the text.
CONCLUSION:
As far As we know keywords and contents are one of the most valuable things present nowadays most of the search engine’s algorithms are advancing daily as we speak. In every search query hit the search engine gives a relatable site to browse which is derived by many algorithms. So choosing a keyword for site holds the important key to your site’s visibility in SERP.
2. USING PRECISION AND RECALL TO GET THE ACCURACY OF A PARTICULAR MODEL (TOPIC MODEL)
Introduction:
Precision and Recall, both of the terms indicate a distinct meaning. Precision means the percentage of your results which are relevant and recall indicates the percentage of total relevant results correctly classified by a particular algorithm.
Analysis:
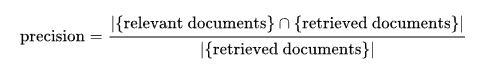
Precision:
In the field of information retrieval, precision is the fraction of retrieved documents that are relevant to the query.
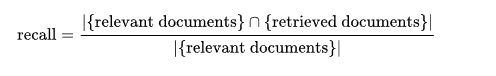
Recall:
In information retrieval, recall is the fraction of the relevant documents that are successfully retrieved.

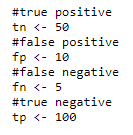
Initializing values:
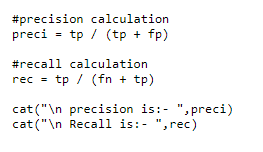
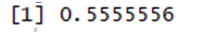
Calculating precision and recall:
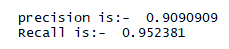
OUTPUT:
USE IN SEO:
In various fields like pattern recognition, information retrieval and binary classification to fetch the relevant information, while precision is the fraction of relevant instances among the retrieved instances and recall is the fraction of relevant instances that have been retrieved over the total amount of relevant instances.
Likewise in SEO clusters of semantically similar focus keywords can be identified using precision and recall. Precision has the ability of a classification model to return only relevant instances; Recall has the ability of a classification model to identify all relevant instances.
CONCLUSION:
Precision and recall are two extremely important model evaluation metrics. We used these metrics to identify relevant keywords from a particular model. Also, we can determine the relevancy of particular content.
Generally in information retrieval, if you want to identify as many relevant documents as you can (that’s recall) and avoid having to sort through junk (that’s precision).
3. USING NAÏVE BAYES TO CLASSIFY FOCUS KEYWORD ACCORDING TO THEIR RANK
Introduction:
Naive Bayes classifiers are a collection of classification algorithms using probability-based on Bayes’ Theorem. Basically, it is a classification technique with an assumption of independence among predictors. A Naive Bayes classifier assumes that a particular feature in a class is unrelated to any other feature in the class. This assumption is called class conditional independence.
Analysis:
Naive Bayes model is very useful against large scale data sets. Naive Bayes is a technique for constructing classifiers models. In the model, there are classes which are assigned by a particular label represented as vectors of feature values, where the class labels are drawn from some finite set.
Base formula:
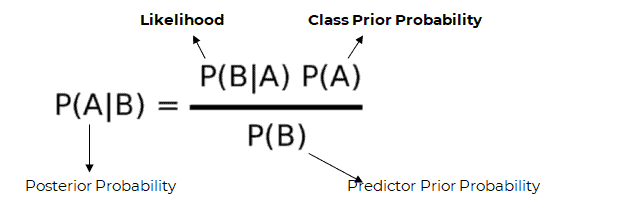
P(A|B) is the posterior probability of class (A, target) given predictor (B, attributes).
P(B) is the prior probability of class.
P(B|A) is the likelihood which is the probability of predictor given class.
P(B) is the prior probability of predictor.
There are three types of Naive Bayes model:
1. Gaussian
2. Multinomial
3. Bernoulli
Constructing a sparse document-feature matrix:

Setting factors and keeping the last one as ‘NA’
Creating the naive Bayes classifier:
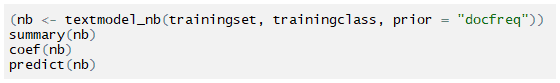
textmodel_nb: Naive Bayes classifier for texts, a multinomial or Bernoulli Naive Bayes model, given a dfm and some training labels.
coef: A function which extracts model coefficients from objects returned by modeling functions.
predict: is a generic function for predictions from the results.
Predicting models with different prior distribution:
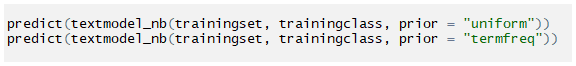
prior distribution on texts; one of “uniform”, “docfreq”, or”termfreq”. Prior distributions refer to the prior probabilities assigned to the training classes, and the choice of prior distribution affects the calculation of the fitted probabilities. The default is uniform priors, which sets the unconditional probability of observing the one class be the same as observing any other class. Getting the result:
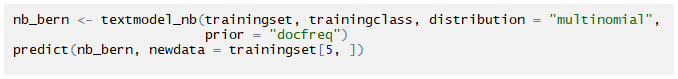
Distribution: count model for text features, can be multinomial or Bernoulli.
prior distribution on texts; “docfreq”
USE IN SEO:
We used Naive Bayes classifiers, to classify good keywords and bad keywords according to their rank, from this we can analyze why the rankings are dropping for some particular keyword, later on the result will be used in penalty analysis.
CONCLUSION:
Naive Bayes algorithm will really helps in SEO, classification can really help to identify potential ranking keyword as well as bad keywords. This can help in mapping keyword in a better way that will increase visibility in SERP.
4. CORRELATING MULTIPLE SITES TO GET A BRIEF UNDERSTANDING OF RANKING FACTORS
Introduction:
A correlation is a numerical measure of two entities, meaning a statistical relationship between two entities. Each entity has a set of observed data which later on used in various types of analysis.
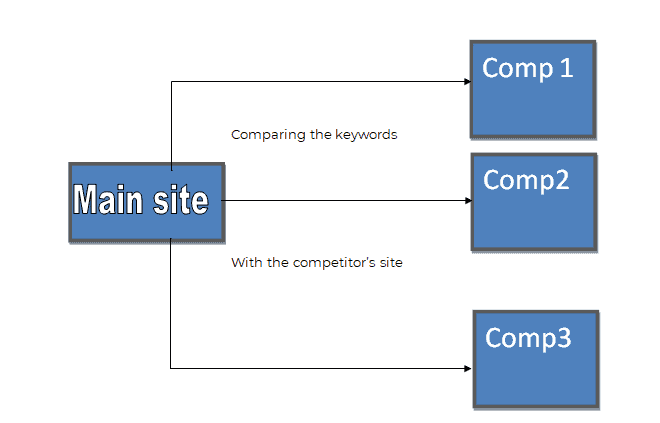
In our case it is website correlation or website matching, this is a process which is used to get a preview of both the main site and the competitor site’s structure, content, and category. Later on helps in identifying critical issues which may to lead to bad ranking or penalty.
Analysis:
Two main types of correlation that we use are:
Pearson:
Pearson correlation coefficient is a measure of the linear correlation between two variables containing data sets where 1 represents positive linear correlation 0 neutral and -1 represents negative linear correlation.
Base formula:
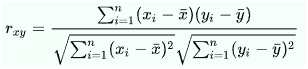
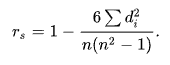
Where n is the sample size, xi and yi are the individual sample points indexed with i,Spearsman:
Spearman’s rank correlation coefficient measures statistical dependence between the rankings of two variables. Spearman’s correlation assesses monotonic relationships. If there are no repeated data values, a perfect Spearman correlation of +1 or −1 occurs when each of the variables is a perfect monotone function of the other.
Base Formula:
But we used correlation in a different way that really helps to analyze a site’s structure, we made a program that scrapes sites to get a view on structure and how it affects ranking in SERP by judging factors.
Scraping selected URLS

Keyword input:
Number of urls:

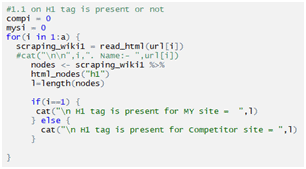
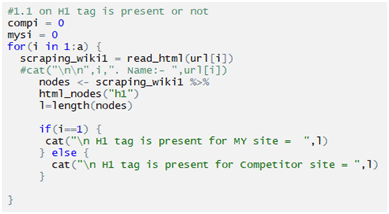
Checking H1:
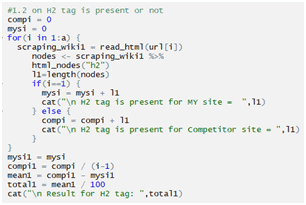
Checking H2:
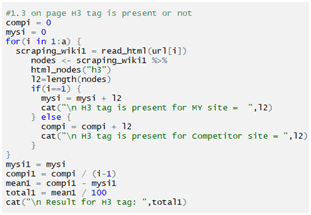
Checking H3:
Checking H4:

Checking H5:

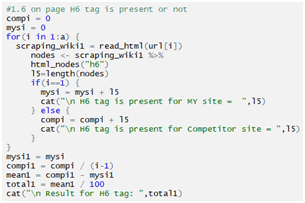
Checking H6:
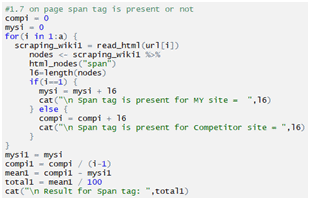
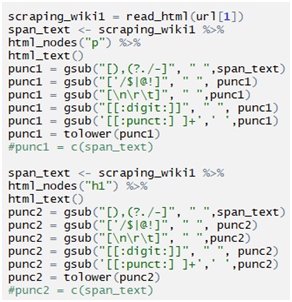
Checking span tag:
Checking i tag:

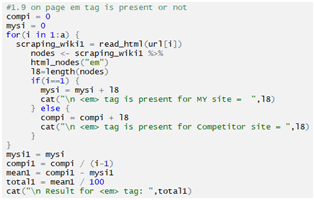
Checking em tag:
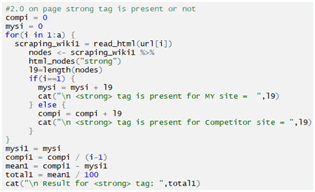
Checking strong tag:
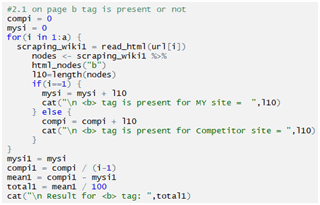
Checking b tag:
Checking li tag:

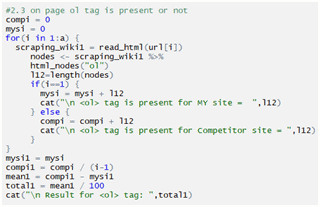
Checking ol tag:
Checking ul tag:

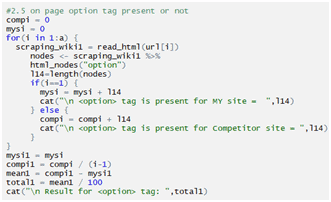
Checking option tag:
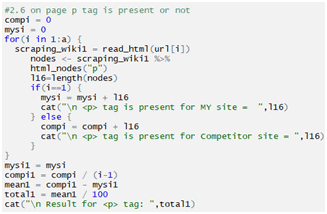
Checking p tag:

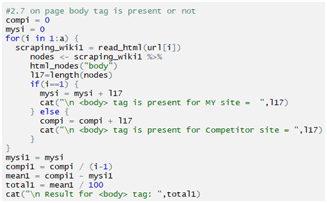
Checking body tag:

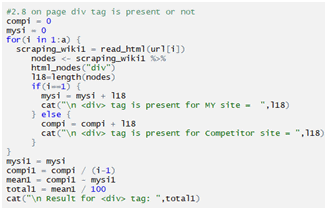
Checking div tag:

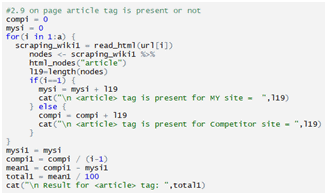
Checking article tag:
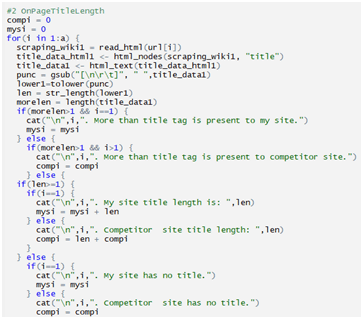
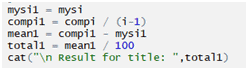
Page title length checking:
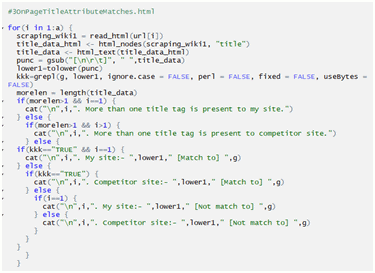
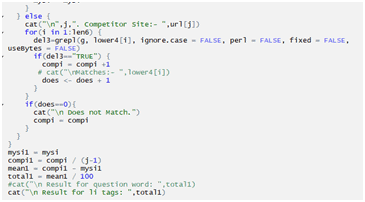
Checking Page Title Attribute Matches:
Checking if Page Li tag Matches:
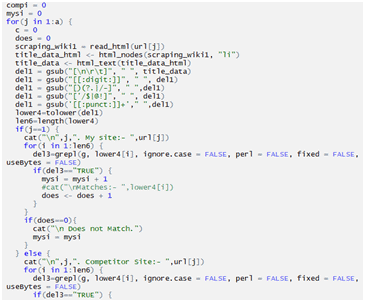
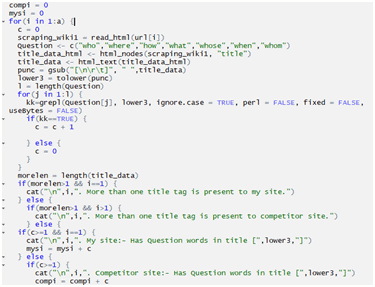
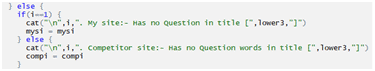
Checking Page Title contains Question Words:
Checking if Page Li Tag Exact Matches:
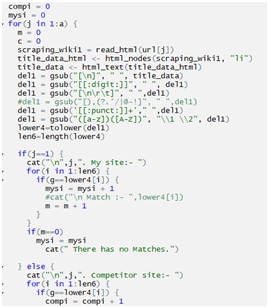
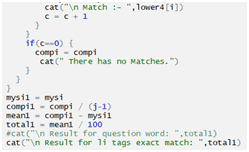
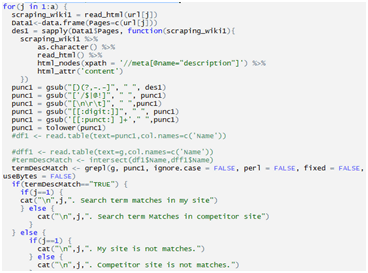
Checking Page Meta Description Length:
Checking Page Meta Description Search-Term Matches:
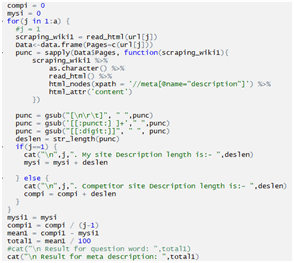
Checking Page Meta Keywords Matches:
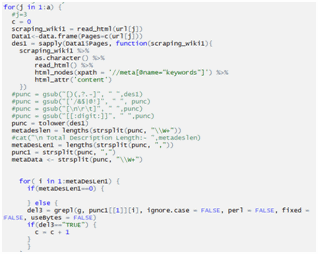
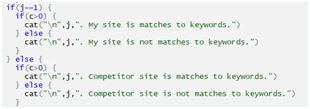
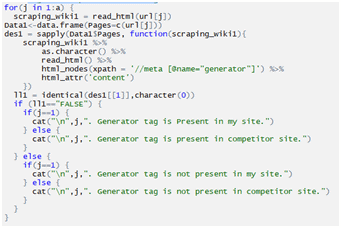
Checking Page Has WordPress Generator Tag:
USE IN SEO:
In every search enigine correlating sites in common, this helps to uncover keywords with similar time-based (frequency options: weekly or monthly)or provided search query.
“Google Correlate uses the Pearson correlation to compare normalized query data to surface the highest correlative terms.”
Although we used our program to judge each and every keyword in meta description, title tag, alt text, i tag, p tag etc. against multiple competitors to check what kind of matches (Exact match, phrase match, search term match) are present in the content, this affect the ranking in terms of keyword and search query hit by users. We also check the pearson value and spearman’s ranking value to analyze how the main site is performing compare to its competitor .
Our method of correlating websites gives an insight in variuos crucial elements which afftects a site’s visibilty in SERP.
CONCLUSION:
Pearson’s Correlation Coefficient and Spearman’s Rank-Order Correlation helps to get a complete overview of the data fetched by correlating the main site and the competitors site.
In SEO using correlation we can determine what the main site is lacking and according to the results we can implement changes which will lead to better ranking in SERP.
5. TOPIC MODELLING USING LDA(LATENT DIRICHLET ALLOCATION) FOR KEYWORD OPTIMIZATION IN SEO
Introduction:
The Information Retrieval model, Latent Dirichlet Allocation (LDA) is a “generative probabilistic model” of a collection of composites made up of parts. In terms of topic modeling, the composites are documents and the parts are words and/or phrases (phrases n-words in length are referred to as n-grams).
Topic models provide a simple way to analyze large volumes of unlabeled text. Topic modeling is a method for unsupervised classification of documents. Latent Dirichlet allocation (LDA) is a particularly popular method for fitting a topic model. It treats each document as a mixture of topics, and each topic as a mixture of words. This allows documents to “overlap” each other in terms of content, rather than being separated into discrete groups, in a way that mirrors typical use of natural language.
Purpose:
Although LDA has many applications in many various fields, we used LDA to find out the keyword’s belonging probability in particular topic from a particular document. Each and every keyword has a belonging probability in particular topic which also indicates their relevance to a particular document.
After analyzing one’s content of a website, using LDA topic modeling we can determine which keyword holds the highest relevancy score based off a query (search term). By using those Keywords which helps in increasing a page’s relevancy for most of the search engine.
Analysis:
Latent Dirichlet allocation is one of the most common algorithms for topic modeling. Without diving into the math behind the model, we can understand it as being guided by two principles.
1. Every document is a mixture of topics
2. Every topic is a mixture of words
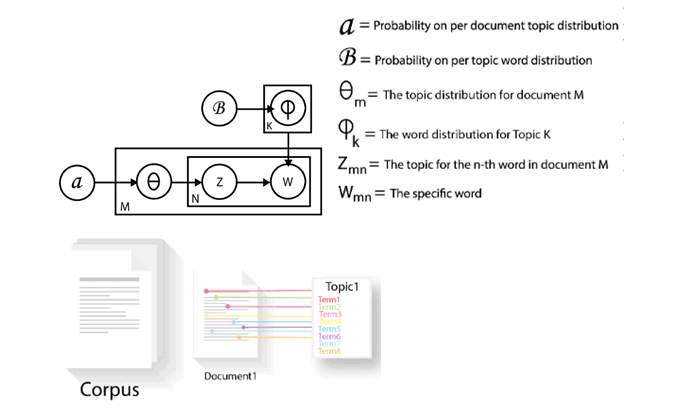
LDA views documents as bags of words. LDA first assumes that a document was generated, by picking up a set of topics and then for each topic picking a set of words. Then the algorithm reverse engineers the whole process to find out the topic for each set of words.
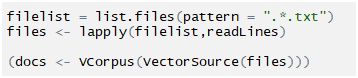
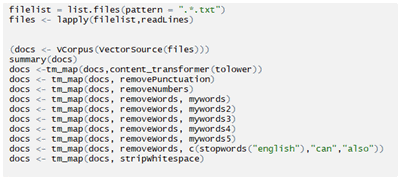
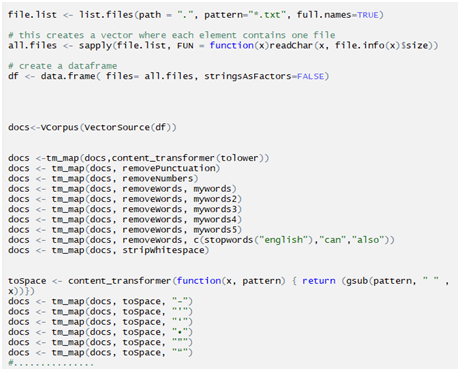
Load and the files into a character vector:
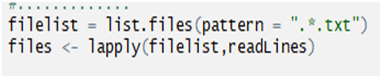
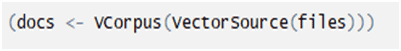
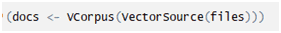
Create corpus from the vector:
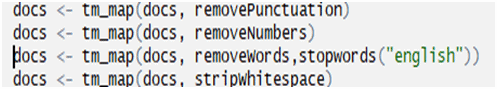
Data Pre-processing: Remove potential problematic symbols:
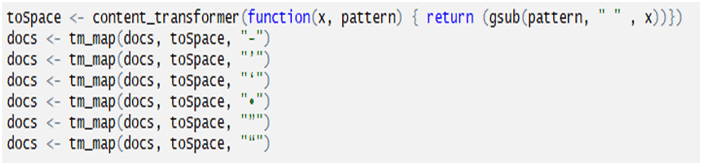
Remove punctuation, digits, stop words and white space:
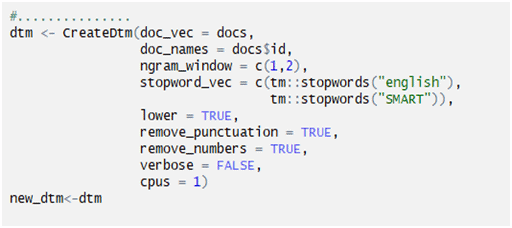
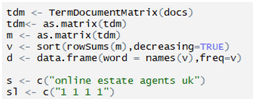
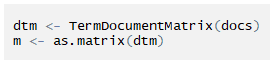
Creating a Document Term Matrix:
Setting parameters required in “Gibbs” sampling method:
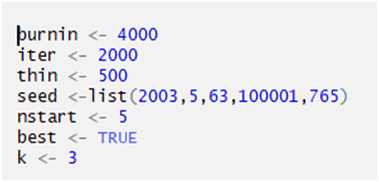
K= number of topics (min=2)
K=2, means the topic distribution per document will be 3.
The main point of using the seed is to be able to reproduce a particular sequence of ‘random’ numbers.
Iteration is set to be 2000 time
Finally ready to use the LDA() function from the topic models package:
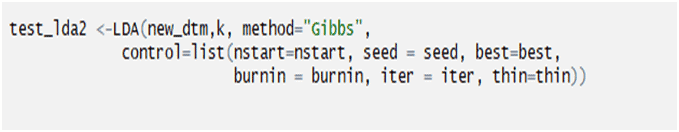
Method=”Gibbs” is Gibbs sampling or a Gibbs sampler is a Markov chain Monte Carlo algorithm for obtaining a sequence of observations which are approximated from a specified multivariate probability distribution, when direct sampling is difficult. Word-topic probabilities:
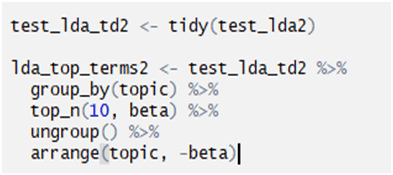
Test_lda_td2<-tidy(test_lda2)
Converted the LDA output in Tidy form
Once a dataset is tidy, it can be used as input into a variety of other functions that may transform, model, or visualize the data.
group_by() takes an existing tbl and converts it into a grouped tbl where operations are performed “by group”. ungroup() removes grouping. In this case the tbl is grouped by topic.
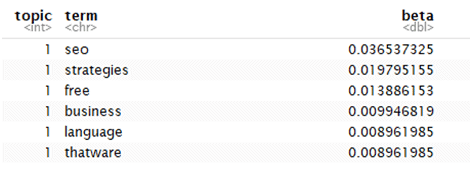
top_n(10,beta):In this case it means that top 10 terms along with their beta is being showed.
SBeta: Beta represents topic-word density with a high beta, topics are made up of most of the words in the corpus, and with a low beta they consist of few words.
In this case the beta also shows the topic-word probability:
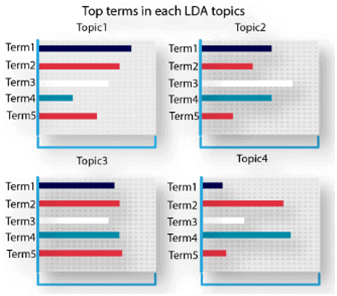
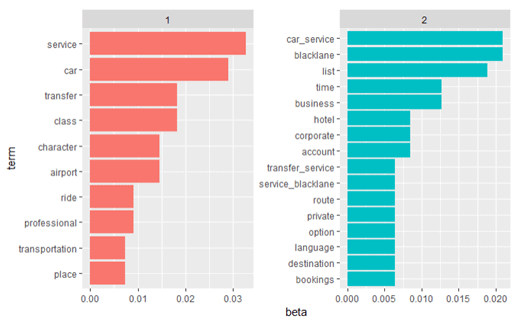
Visualization, of the 2 topics that were extracted from the documents:
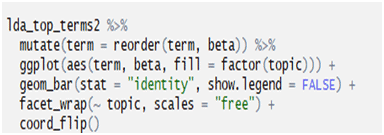
OUTPUT:
USE IN SEO:
We use LDA topic modeling to find out the best keyword by their relevancy score. We use the main site’s content to analyze to get the best keyword available from the content to increase the page visibility in SERP.
Algorithm We Used:
- Assume there are k topics across all of the documents
- Distribute these k topics across document m by assigning each word a topic.
- For each word w in document m, assume its topic is wrong but every other word is assigned the correct topic.
- Probabilistically assign word w a topic based on two things:– what topics are in document
How many timesword w has been assigned a particular topic across all of the documents
- Repeat this process a number of times for each document.
CONCLUSION:
Topic modeling is the process of identifying topics in a set of documents. This can be useful for search engines, trending news topics, and any other instance where knowing the topics of documents is important.
In our case we used the algorithm for finding out the money in the content this algorithm is very useful for keyword research optimizing content and other factors, which leads to better ranking of a particular site.
6. USING FLEISS’ KAPPA DETERMINING THE AGREEMENT PERCENTAGE OF SOME PARTICULAR FACTORS IMPLEMENTATION
Introduction: Cohen’s kappa is used to measure the percentage of agreement between two raters. But the drawback is that we can’t use more than two raters in cohen’s kappa, to overcome the problem an extension called Fleiss’ kappa is used. Fleiss’ Kappa is a way to measure agreement between three or more raters. Base Formula for two raters:
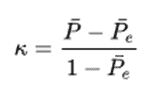
1 – Pe = Gives the degree of agreement that is attainable above chance
P – Pe = Gives the degree of the agreement actually achieved above chance.
K= 1 (If the raters are in complete agreement)
K < 0 (If there is no agreement among the raters)
Analysis:
We used kappa statistics to determine the degree of agreement of the nominal or ordinal ratings made by multiple raters when the raters evaluate the same samples. In our case agreement can be defined of as follows, if a fixed number of raters assign numerical ratings to a number of factors then the kappa will give a measure for how consistent the ratings are.
To serve our purpose we used Kappa Statistics shown below so we can get the desired result.
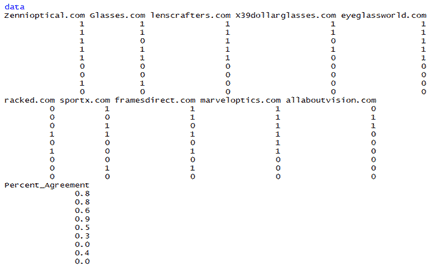
We have taken a supervised data subjects, which are observed from several websites, whether the particular subject or point is present or not.
According to that, I’ve created a test file containing agreement and disagreement, which is represented as 1 and 0, 0 means disagreement and 1 means agreement.
The dataset we used
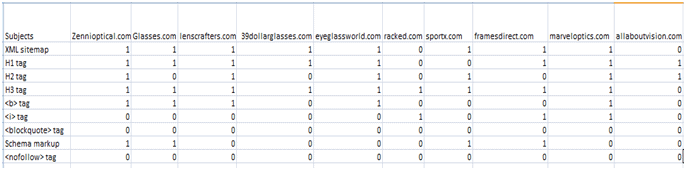
Subjects (Factors)
Raters (Competitors)
Imported the data from the default directory
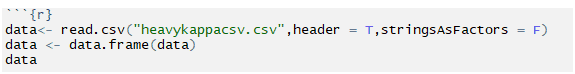
Applied Fleiss Kappa:

OUTPUT:
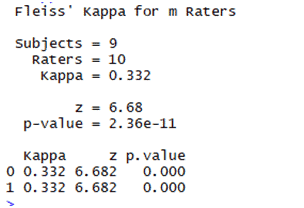
Now,
Deriving the percentage of agreement for each subject:
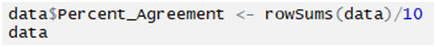
10, because there are 10 competitors
OUTPUT:
RESULT FILE:

Percentage of the agreement for each subject
The kappa agreement value
USE IN SEO:
In Kappa statistics, we measure the percentage of agreement of ratings made by multiple raters, which helps in making a decision for many different tasks.
Likewise in our case we use Kappa Statistics to judge some elements or factors (tags) that are crucial for SEO (heading tag, meta description, nofollow, noindex, iframe, etc.), by comparing it to the main site with multiple competitor’s sites to see the degree of agreements that which factor should we use the most and which should we avoid to get ranked in SERP.
CONCLUSION:
In SEO, analyzing competitor’s site in one of the most mandatory procedure, this gives a brief review of how your site’s condition is compared to your competitor’s site. This helps understand where your site is lacking. By using Kappa Statistics we can determine which factor holds the major priority through observing the degree of the agreement. Kappa Statistics can really help in competitor analysis.
7. USING JACCARD INDEX FIND RELATED TAGS
Introduction:
Jaccard Index determines how similar the two sets are, this compares members for two sets to see which members are shared and which are distinct. Basically speaking Intersection over Union, the size of the intersection divided by the size of the union of the sample sets.
Analysis:
Base formula of Jaccard index:
J(A,B) = |A∩B| / |A∪B|
In our case we’ve two vectors which contains terms from a corpus,
Two vectors X and Y, each represented as a set
A = {0,1,2,5,6}
B = {0,2,3,4,5,7,9}
If the Jaccard index between two sets is 1, then the two sets have the same number of elements in the intersection as the union, and we can show that A∩B=A∪B. So every element in A and B is in A or B, so A = B.
Loading the documents and creating it into a corpus:
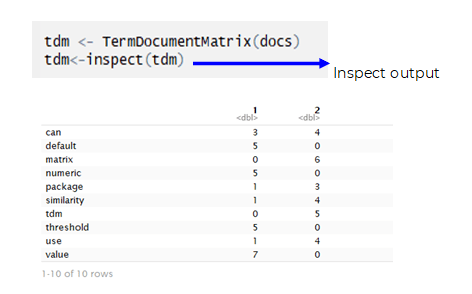
Creating term document matrix:
Giving a specified tag
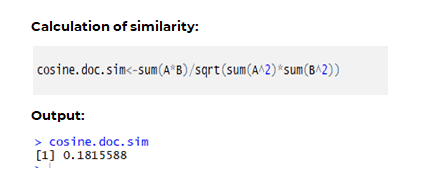
Calculating the results:

OUTPUT:
USE IN SEO:
The Jaccard index is used to measure similarity between two sets by Intersection over Union. Jaccard index allows us to find highly related tags which literally have no textual characteristics in common, this is one of the most used method for identifying good tags, bad tags and relatable tags. By using Jaccard Index we can determine whether the tags are valuable or not.
ALGORITHM:
- Creating corpus with multiple documents
- Pre-processing the documents
- Creating term document matrix
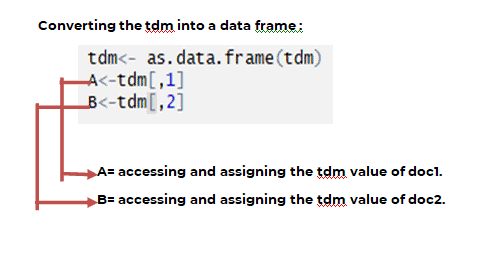
- Separating terms and value
- Creating two sets
- Calculating the sets with the base formula
- Getting the output
CONCLUSION:
User-generated content is one of the most valuable sources of content this can help us build human driven natural language descriptions. User generated tags can hold the key to increase visibility to SERP, although there are millions of tags created by the user for some particular product, some may lead to duplicity of content, Jaccard index can solve the issue by identifying tags that relates to some particular product.
8. USING HIERARCHICAL CLUSTERING TO FIND OUT SIMILAR TAGS IN THE SITE
Introduction:
Hierarchical clustering is an algorithm that groups similar objects into groups called clusters. The endpoint is a set of clusters, where each cluster is distinct from each other cluster, and the objects within each cluster are broadly similar to each other.
All the data Points in the clusters are very much similar to each other likewise in other clusters they also have very similar data points but every cluster is dissimilar than each other because the data points in a particular cluster have a different values than the data points in the other cluster.
Analysis:
Hierarchical clustering involves creating clusters that have a predetermined ordering from top to bottom.
Hierarchical cluster sees the data as a separate cluster Then, it repeatedly executes the process of identifying the two clusters that are closest together and merging the two most similar clusters as one.
Hierarchical clustering generally falls into two types:
Agglomerative: This is a “bottom-up” approach: each observation starts in its own cluster, and pairs of clusters are merged as one moves up the hierarchy. In this technique, initially, each data point is considered an individual cluster. At each iteration, the similar clusters merge with other clusters until one cluster or K clusters are formed.
Divisive: This is a “top-down” approach: all observations start in one cluster, and splits are performed recursively as one moves down the hierarchy. In divisive or top-down clustering method we assign all of the observations to a single cluster and then partition the cluster to two least similar clusters
Algorithms to determine the distance of the data points:
Euclidean distance, Squared Euclidean distance, Manhattan distance, Maximum distance, Mahalanobis distance.
Calculate the similarity between two clusters:
Calculating the similarity between two clusters is important to merge or divide the clusters. Certain approaches used to calculate the similarity between two clusters:
- Maximum or complete-linkage clustering
- Minimum or single-linkage clustering
- Group Average
- Distance Between Centroids
- Ward’s Method
Implementation:
Taken a specific page to analyze:

Now, scraping the site:
Creating term document matrix:
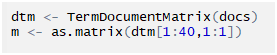
A given range of terms 1 to 40 with docs 1. Distance Between vectors:
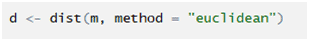
Algorithm used Euclidean distance to measure the distance of each terms in this case.
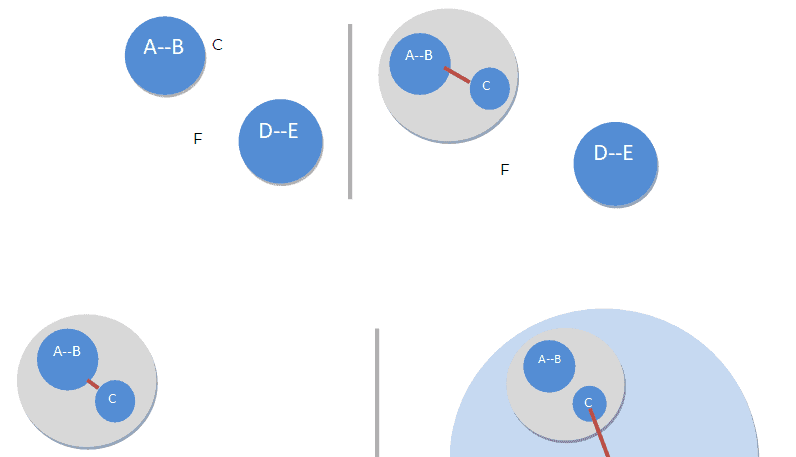
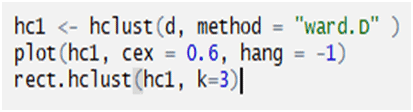
Plotting and Clustering:
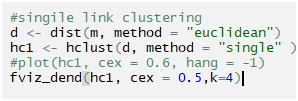
Single Linkage :
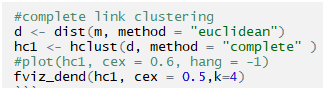
Complete Linkage :
OUTPUT:
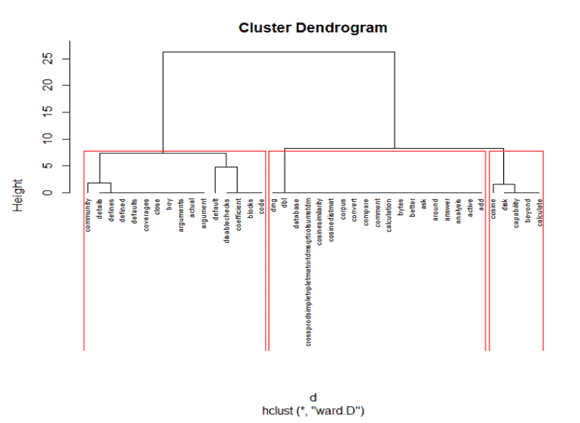
The Hierarchical clustering Technique can be visualized using a Dendrogram.
A Dendrogram is a tree-like diagram that records the sequences of merges or splits.
USE IN SEO:
Clusters of similar data points actually helps in analyzing tags of a particular site and we can determine how much similar they are. Finding out similar tags which are helpful if the tags are relevant with the site this can increase the visibility of site in SERP.
Algorithm of basic hierarchical clustering:
Step- 1: In the initial step, we calculate the proximity of individual points and consider all the data points as individual clusters.
Step- 2: In step two, similar clusters are merged together and formed as a single cluster.
Step- 3: We again calculate the proximity of new clusters and merge the similar clusters to form new clusters.
Step- 4: Calculate the proximity of the new clusters and form a new cluster.
Step- 5: Finally, all the clusters are merged together and form a single cluster.
CONCLUSION:
Hierarchical clustering is a powerful technique that allows you to build tree structures from data similarities. Clustering can discover hidden patterns in the data. We can now see and separate how different sub-clusters relate to each other, and how far apart data points are.
But in our case we just need to find out similar tags to use in tag optimization which will help in SEO in a different way that a particular site can rank higher in SERP.
9. USING K-MEANS TO IDENTIFY A GROUP OF SEMANTICALLY SIMILAR KEYWORDS
Introduction:
K-means clustering aims to partition n observations into k clusters in which each observation belongs to the cluster with the nearest mean, serving as a prototype of the cluster. The algorithm inputs are the number of clusters K and the data set. The data set is a collection of features for each data point.
Analysis:
We have taken a data set which includes items with certain features, and values for these features (like a vector). The task is to categorize those items into groups (clusters). To get the desire output, we used k-Means algorithm; an unsupervised learning algorithm.
Fetching the files and clearing them:
Creating term document matrix:
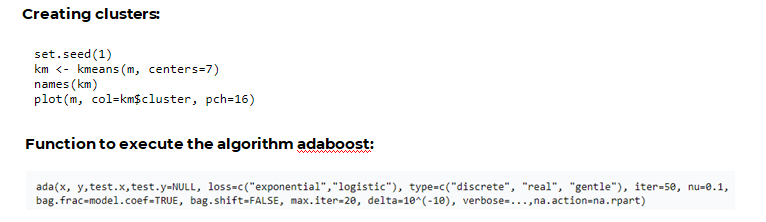
Performing the cluster:
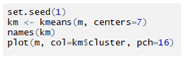
OUTPUT:

USE IN SEO:
In general we used k-Means clustering to find a group of semantically similar keywords. By this algorithm we can determine the words present in a particular group of cluster is similar to each other and dissimilar to other words in some different cluster.
To optimize a particular keyword we use k-Means clustering to build and find more meaning into a particular word that is being used in a site’s content. Basically using semantic keyword, a particular keyword can indicate the true intent of content that might satisfy the user’s query which may lead to have more traffic in a website and also the site’s rank may get higher in SERP.
ALGORITHM:
- Clusters the data into k groups where k is predefined.
- Select k points at random as cluster centers.
- Assign objects to their closest cluster center according to the Euclidean distance function.
- Calculate the centroid or mean of all objects in each cluster.
- Repeat steps 2, 3 and 4 until the same points are assigned to each cluster in consecutive rounds.
CONCLUSION:
Kmeans clustering is one of the most popular clustering algorithms and usually the first thing practitioners apply when solving clustering tasks to get an idea of the structure of the dataset.
In our case we used k-Means to optimize keywords, by doing so it gives more depth to particular content and provides more value in the eyes of Google. This will create the opportunity and more chances to obtain a variety of keyword rankings also an opportunity to rank for a longer period of time. By the implementing the keyword we chose from a particular cluster we can deliver more relevant content.
10. RANK BRAIN SCHEMA IMPLEMENTS
Introduction: Schema markup is a form of microdata added to a particular webpage that creates an enhanced description which also known as the rich snippet that appears in the search results. Top search engines – including Google, Yahoo, Bing, and Yandex – first started collaborating to create Schema.org, back in 2011. Purpose: Schema is used to improve the way search engines read and represent your page in SERPs.
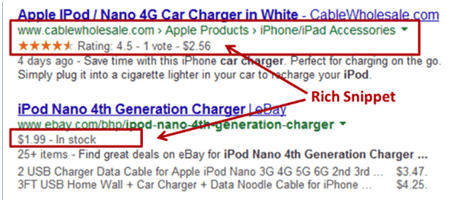
In the above screenshot you can see star rating and rates. Both of these can be added using Schema. Search results with more extensive rich snippets (like above-created using Schema) will have a better click-through rate. Schema markup is important for RankBrain Algorithm. We have developed a schema that satisfies the RankBrain Algorithm which will help interpret the context of a query.
Analysis:
Schema markup was invented for users, so they can see in the SERPs what a website is all about, the place, the time schedule, cost, rating, etc. This is a user-centric improvement. Search engines help users to find the information they need.
Many types of research indicate that schema holds one of the important keys to SERP, they say that websites with schema markup will rank better in the SERPs than websites without markup. Some studies also determined that websites with markup rank an average of four positions higher in the SERPs than those without schema markup.
In short, there are millions of websites missing out on a huge source of SEO potential. By implementing schema you will hold a majority stand against your competitors.
Creating schema according to RankBrain algorithm:
RankBrain is one of the Core Algorithm for determining search results according to their relevance. Schema is one of the important parts of this algorithm. RankBrain has been cited as part of the overall Google Hummingbird algorithm.
In 2015, Google stated that RankBrain was being used to process 15% of queries the system had never encountered before. By 2016, Google was applying RankBrain to all queries.
So the old concept of One-keyword-one-page won’t work anymore.
By implementing schema in such a way that some of the required points for relevancy of a particular query can be found, this can also increase the chance of being in SERP at a good position. An example of our schema which has been shown below (The code may change depending to the site’s content):
The main part in the entire above schema is shown below “How to section”:
“object”:{
“@type”:”HowToStep”,
“name”:”Queries”,
“itemListOrder”: “http://schema.org/ItemListOrderAscending”,
“itemListElement”:[
{
“@type”: “Question”,
“position”: “1”,
“text”: “What’s 2 + 2?”
},
{
“@type”: “Question”,
“position”: “2”,
“text”: “What’s 21 + 22?”
}
]
}
},
“exampleOfWork”:{ //how to
“@type”:”HowTo”,
“name”:”How to choose a good sunglass for better performance?”,
“url”:”https://shop.heavyglare.com/blog/high-performance-sport-sunglasses-guide/”,
“description”:”Read the article to know the process of choosing a good sunglass”,
“image”:”https://shop.heavyglare.com/blog/wp-content/uploads/2017/10/High-Performance-Sport-Sunglasses-Guide.jpg”,
“inLanguage”:”en-US”,
“keywords”:”lens,sunglass lens characteristics,sunglass lenses,sunglass lens issues”,
“steps”:{
“@type”:”HowToStep”,
“name”:”Queries”,
“itemListOrder”: “http://schema.org/ItemListOrderAscending”,
“itemListElement”:[
{
“@type”: “HowToDirection”,
“position”: “1”,
“name”:”Aim to protect your eyes first and foremost.”,
“description”:”Excessive exposure to UV radiation can cause a variety of problems for your eyes such as cataracts, burns, and cancer.”
},
{
“@type”: “HowToDirection”,
“position”: “2”,
“name”:”If you want your sunglasses to protect you from these risks, look for pairs that block at least 99% of UVB rays and at least 95% of UVA rays.”,
“How to section” Actually increases the land page’s ranking probability. The “How to section” is directly proportional to the page’s intent which also increases the relevancy score for some query hit.
SCHEMA IMPLEMENTATION:
- First go to the Google Tag Manager.
- Then active the preview mode.
- Next create one tag.
- Select custom HTML and paste the above code there and save the Tag.
- Then create one trigger and select ‘Page View’.
- If you want to implement the code for all pages then select ‘All Page View’ and if you want to implement the code for some particular pages then select ‘Some Page View’ and select the page path and put the page path in it.
- Add the trigger in the Tag.
- Then at last submit it.
CONCLUSION:
Structured data markup is an important aspect of any comprehensive SEO solution. It is recommended that one should implement the schema types that are most applicable to the business. This will likely provide a competitive edge in the SERPs, and it is a cost-effective way to boost the organic search results.
11. COSINE SIMILARITY IMPLEMENTATION IN SEO
Introduction:
Cosine Similarity is a measure of similarity between two non-zero vectors that estimates the cosine angle between them. If the cosine angle orientations between two vectors are the same then they have a cosine similarity of 1 and also with different orientation the cosine similarity will be 0 or in between 0-1. The cosine similarity is particularly used in positive space, where the outcome is neatly bounded in [0, 1].
Purpose:
In information retrieval, Cosine Similarity is a commonly used algorithm in various fields; in our case, we used Cosine Similarity to check Content similarity between two websites. There are many applications of Cosine Similarity that we created which is totally SEO focused, for instance:
- Anchor Text Similarity
- Document to Document Similarity
- Keyword Similarity between your site and the competitor’s site
Analysis:
Through all the applications we created the base formula is the same; we modified our application according to the requirement. We used R language to compile our analysis.
Base Formula:
Given two vectors of attributes, A and B, the cosine similarity, cos(θ), is represented using a dot product and magnitude as:
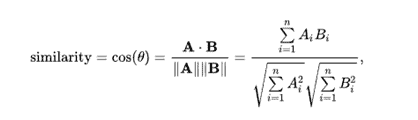
Where Ai and Bi are components of vector A and B respectively. For text matching, the attribute vectors A and B are usually the term frequency vectors of the documents. The cosine similarity of two documents will range from 0 to 1, since the term frequencies cannot be negative. The angle between two-term frequency vectors cannot be greater than 90°. We are using cosine similarity to measure the cosine angle of two website’s content whether the site’s content is similar or not if it is then how much. The range we prefer is [ 0.3-0.5 ].
USE IN SEO:
3 Applications that we use the most in competitor analysis:
1. Anchor Text Similarity:
The anchor element is used to create hyperlinks between a source anchor and a destination anchor.
Taken two specific websites, one is the main site and another is the competitor of the main site. This method is used for finding a site’s anchor text similarity with the site’s competitor, in other words, the common anchor texts. Similarity is measured by a cosine angle.
We need to scrape the sites for all anchor texts from a given link:

Cleared and vectorized all the content then stored into a data frame
Same method follows for the competitor’s site
Creating a Corpus which contains both of the site’s anchor text
Creating a term document matrix to find out there frequency
Applying the base formula and intersecting to sort out the common anchor text

- Document to Document Similarity :
In this method what we do is, we scrape all the content from the main site and from the competitor site and store it into a variable later on we convert it into a data frame for further analysis
Creating Term Doc Matrix:
3. Keyword Similarity between your site and the competitor’s site :
We take a particular keyword from the main site as the main term to run the cosine similarity to determine how much it is similar.
After the test run if the degree of the output is very similar this will help the main site to rank better in SERP. Note: The similarity of the content can cause plagiarism. The only thing we need to compare is the keywords. Cosine Similarity base algorithm: The Cosine Similarity procedure computes similarity between all pairs of items. It is a symmetrical algorithm, which means that the result from computing the similarity of Item A to Item B is the same as computing the similarity of Item B to Item A.
- A and B are two vectors contains integer values (Cosine Similarity function computes the similarity of two lists of numbers)
- The dot product of the two vectors divided by the product of the two vectors’ lengths (or magnitudes).
- The cosine similarity is particularly used in positive space, where the outcome is neatly bounded in [0, 1].
CONCLUSION:
The measurement of similarity using Cosine similarity algorithm is way more efficient and simple to work with. Gives an output which does not complicate the analysis and also for the competitor research Cosine Similarity is one of the most useful algorithm we’ve seen.
12. USING SENTIMENT ANALYSIS TO ANALYZE THE EMOTION (POSITIVE OR NEGATIVE) ASSOCIATED WITH A PARTICULAR CONTENT OF A SITE:
Introduction:
Sentiment Analysis is the process of determining whether the content is positive, negative or neutral. By analyzing the content you can identify what kind of emotion the content reflects. A sentiment analysis system for text analysis combines natural language processing (NLP) and machine learning techniques to assign weighted sentiment scores to the entities, topics, themes, and categories within a sentence or phrase.
Analysis:
Basically Sentiment analysis is the process of computationally identifying and categorizing opinions expressed in a piece of text, especially in order to determine whether the writer’s attitude towards a particular topic, product, etc. is positive, negative, or neutral.
There are three different sentiment dictionaries, afinn, nrc and Bing we used where we get the word stock that particularly expresses many different kinds of emotion which makes our work easier those words are predefined what a particular word reflects.
Sentiment anaysis can be applied at different levels of scope:
- Document-level sentiment analysis obtains the sentiment of a complete document or paragraph.
- Sentence level sentiment analysis obtains the sentiment of a single sentence.
- Sub-sentence level sentiment analysis obtains the sentiment of sub-expressions within a sentence.
Types of Sentiment Analysis:
Fine-grained Sentiment Analysis
This is usually referred to as fine-grained sentiment analysis. This could be, for example, mapped onto a 5-star rating in a review, e.g.: Very Positive = 5 stars and Very Negative = 1 star.
Emotion detection
Emotion detection aims at detecting emotions like happiness, frustration, anger, sadness, and the like.
Intent analysis
The intent analysis basically detects what people want to do with a text rather than what people say with that text.
Reading the text file:
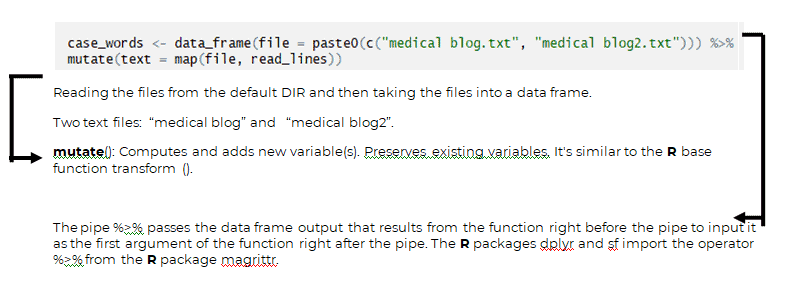
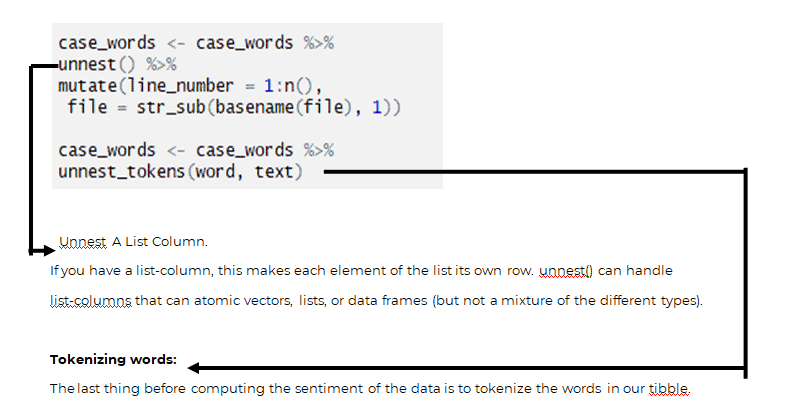
Tibble to Doc: This gives us a tibble with a single variable equal to the name of the file. We now need to unnest that tibble so that we have the document, line numbers and words as columns.
SENTIMENT ANALYSIS OF THE TEXT:
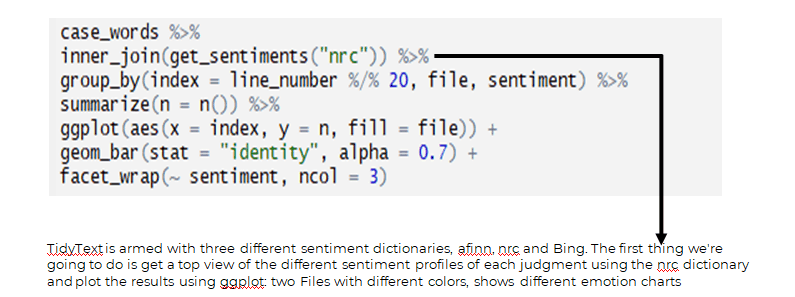
OUTPUT:
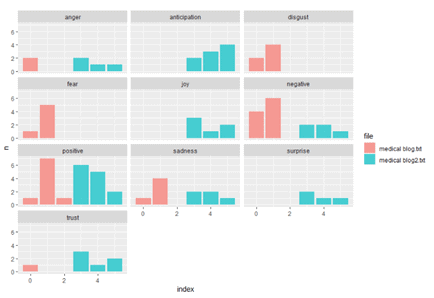
Google had already filed a patent for an algorithm that would ensure “each snippet comprises a plurality of sentiments about the entity,” which, in theory, would keep the emotional content of the snippets relatively balanced. Said by “searchenginepeople”.
In our case we used sentiment analysis in various reports which indicates several factors to judge upon. It totally depends on what task is require, we use in review analysis, content analysis, Use of sentiment analysis algorithms across product reviews lets online retailers know what consumers think of their products and respond accordingly. This can specially be used to gain insight on customer sentiment of their products and services. As for SEO creating content according to the positive sentiment, this could really help in ranking in SERP.
CONCLUSION:
As sentiment analysis tools become increasingly available the SEO industry cannot help but be affected by them. So we started analyzing contents which indicates various forms of sentiment that really helps in product analysis and review analysis.13. USING TF-IDF DETERMINING A KEYWORD’S VALUE AGAINST THE DOCUMENT:Introduction:
In information retrieval TF-IDF stands for Term Frequency-Inverse Document frequency. The tf-idf weight in often used to indicate a keyword’s relevance of a particular document. Variations of the tf-idf weighting scheme are often used by search engines in scoring and ranking a document’s relevance given a query. This weight is a statistical measure used to evaluate how important a word is to a document in a collection or corpus.Analysis:
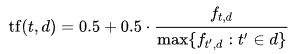
The statistic tf-idf is intended to measure how important a word is to a document in a collection (or corpus) of documents.Term frequency:The number of times a term occurs in a document is called its term frequency. In the case of the term frequency tf(t,d), use the raw count of a term in a document.t= Termsd= DocumentAugmented frequency, to prevent a bias towards longer documents, e.g. raw frequency divided by the raw frequency of the most occurring term in the document:
Inverse document frequency:
An inverse document frequency factor is incorporated which diminishes the weight of terms that occur very frequently in the document set and increases the weight of terms that occur rarely.
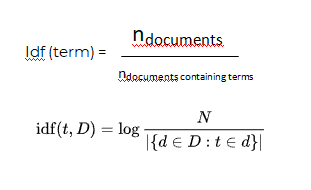
N= Total number of documents in the corpus
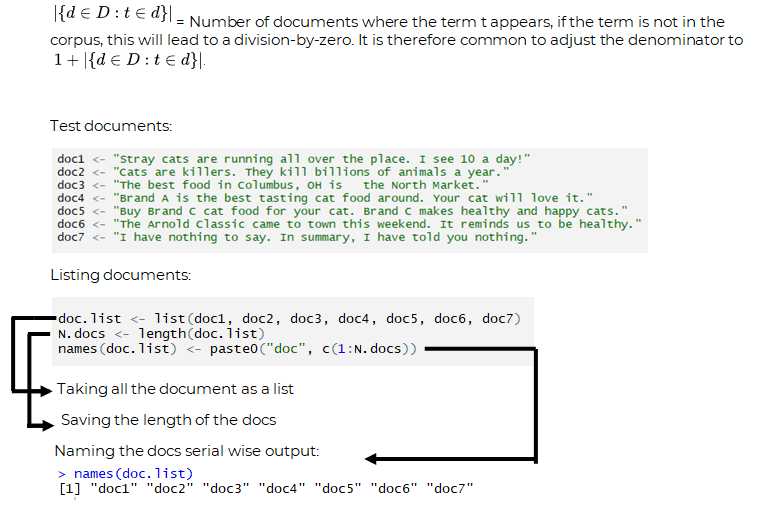
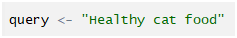
Test Query:
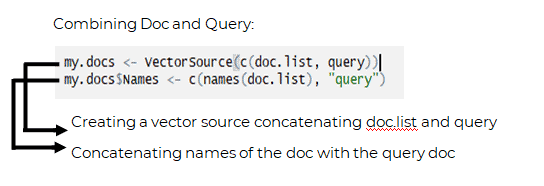
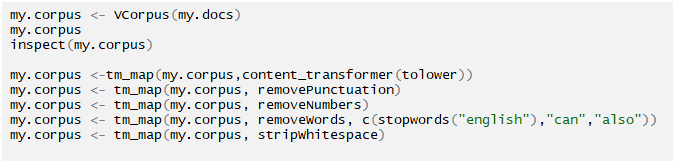
Creating Corpus and clean it:
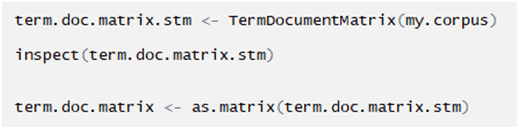
Creating term document matrix:
Creating a function for calculating tf-idf:
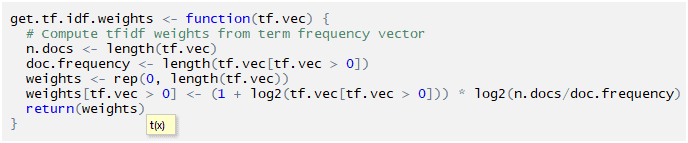
Calling the tf-idf function:

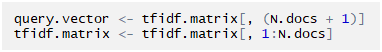
Getting the tf-idf value of query and docs separately:
Getting each and every Doc score:

Converting the results into a dataFrame:

Printing the result according to the score in decreasing order:

OUTPUT:
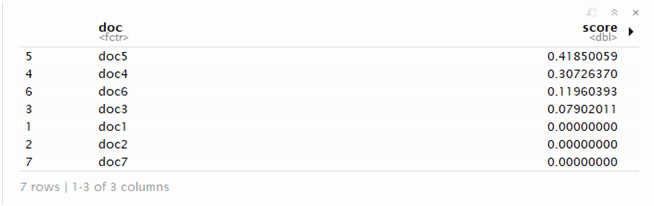
Printing only the 1st and 2nd row:


Results are indicating a relevance feedback for each and every particular doc.USE IN SEO:TF-IDF is very useful method to find a keyword and check how much relevance it is to a particular document. By implementing keyword that are more relevant to the actual document can increase visibility in SERP and it can give a good ranking opportunity for any site.CONCLUSION:TF-IDF is intended to reflect how relevant a term is in a given document. In SEO, terms or keywords are very crucial, one of the important factors for ranking high in SERP. TF-IDF actually helps to observe how much a query is relevant to the document.
14. USING ADABOOST TO SOLVE CLUSTERING PROBLEMS FOR FOCUS KEYWORDS OF A PARTICULAR CONTENT:
Introduction:
AdaBoost, another way to say “Adaptive Boosting”, is the principal functional boosting calculation; it centers on arrangement issues and means to change over a lot of frail classifiers into a solid one.
Generally this method creates a strong classifier from a number of weak classifiers. This is done by building a model from the training data, then creating a second model that attempts to correct the errors from the first model.
Analysis:
AdaBoost is a popular boosting technique which helps you combine multiple “weak classifiers” into a single “strong classifier”. AdaBoost can be applied to any classification algorithm, so it’s really a technique that builds on top of other classifiers as opposed to being a classifier itself.
Retrains the algorithm iteratively by choosing the training set based on the accuracy of previous training.
The weight-age of each trained classifier at any iteration depends on the accuracy achieved.
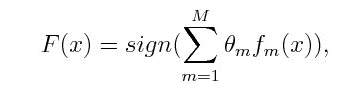
where f_m stands for the m_th weak classifier and theta_m is the corresponding weight. It is exactly the weighted combination of M weak classifiers.Fetching the file and clearing them:
USE IN SEO:
Basically this algorithm helps on classification problems and aims to convert a set of weak classifiers into a strong one.
Well there are layers of work to do to get a proper use of this algorithm mainly if there are lots of data (text, product, categories) present in the site which needs a clear-cut classification we mostly use Hierarchical, K-means algorithm to sort it out and make it into a cluster of information then we use LDA to categorize each and every topic according to their tf-idf weight, In here sometime the weak clusters have problems getting into a proper cluster that’s why need to use Ada-boost to make a strong cluster.
CONCLUSION:
Adaboost really helps in clustering, so later on it can help in getting a proper view in focus keywords. In this context, AdaBoost actually has two roles. Each layer of the cascade is a strong classifier built out of a combination of weaker classifiers, as discussed here. However, the principles of AdaBoost are also used to find the best features to use in each layer of the cascade.
This algorithm tells you what the best “features” are and how to combine them to a classifier.
15. USING CO-OCCURRENCE MATRIX FOR DOCUMENT CLASSIFICATION AND TAGGING:
Introduction:
Co-occurence matrix have specific entities in rows and entities in columns and number of times each entities in rows appears in same context as each entities in columns. Basically words co-occurrence matrix describes how words occur together that in turn captures the relationships between words.
Analysis:
We use Co-occurence matrix for text processing also this implementation is used in applications like sentiment analysis, clustering similar word, document classification and tagging. Words co-occurrence statistics describes how words occur together that in turn captures the relationships between words. Words co-occurrence statistics is computed simply by counting how two or more words occur together in a given corpus.
Fetching the documents.
Creating corpus then the term document matrix:

Calculating the Co-occurrence matrix:
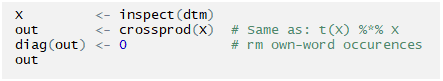
The base formula we used is
Transpose of the selected matrix multiplied by the selected matrix.
USE IN SEO:
This algorithm helps in identifying tags, analysis on content by its sentiment, classifying documents and also it preserves the semantic relationship between words. This really helps to choose LSI keywords which relates to the main focus keyword.
CONCLUSION:
Co-occurrence matrix is one of the basic algorithms demonstrating how to measure words closeness. We used this algorithm to analyze one’s site and suggest keywords that has semantic relativity with LSI keywords and focus keywords.
16. SSR AND CSR HOW IT AFFECTS RENDERING FROM SEO POINT OF VIEW
Introduction:
SSR:
Server side Rendering is one of the most popular technique in website rendering. HTML files are converted by the server into legible information that a browser can use. One major benefit of using SSR is in having an app that can be crawled for its content even for crawlers that don’t execute JavaScript code. This can help with SEO and with providing meta data to social media channels. SSR can also often help with performance of a particular website.
CSR:
Client side Rendering, renders browser content via JavaScript. So users receive a bare HTML document along with a JavaScript that assists with rendering the site using the browser. CSR more suitable when it comes to dynamic content. Also, it’s more beneficial considering browser performance.
Analysis:
SSR:
When a user’s browser send request to a server to established an HTTP conversation which takes a few milliseconds and can depend on various factors server location, server load, internet speed and ofcourse the how optimized the website is. When the request is approved and the HTTP communication is established, the browser receives the rendered HTML and this is displayed on the screen. This occurs each and every time a browser sends request to a server as long as the browser does not have a cached version of the website.
CSR:
On the other hand the recent method of rendering websites and has gained popularity after JavaScript libraries began incorporating it into their style of development. Now days most of the search crawler are able to parse JavaScript files, For Scraping and parsing Dynamic content CSR proves to be the most useful technique to use But unfortunately the website cannot load until all of the necessary JavaScript is downloaded onto the browser and also by any chance the user has a slow internet connection, the loading time of that particular website will very high which might affect user’s experience.
IMPACT IN SEO:
First meaningful paint, by doing SSR but only if a particular site’s configuration has a good Time to the First Byte, also if the server is slow and overloaded there might be an issue which will affect the site’s performance.Prerendering a particular site using react-snap, react-static, Gatsby can really help in FMP.
For rich site interactions and fast website rendering after the initial load with JavaScript libraries CSR can provide a better TTFB.
CONCLUSION:
CSR and SSR can both be implemented depending to the site. Both of them have Pros and Cons. CSR can hurt SEO if not implemented correctly, initial load might require more time and more issues, as well as for SSR a particular server will receive frequent requests resulting in slow page rendering and also site’s user interaction might not be very good but the Search engines can crawl the site for better SEO.
17. WEB SCRAPING USING R FRO COMPETITOR ANALYSIS
Introduction:
The availability of data in the web is growing exponentially. With the amount of data available over the web, different kind of analysis is now possible in various fields for Data Scientists. But most of the data available in web are not in readable format, unstructured or unsupervised, therefore scraping data from the web and creating a model that makes sense so you can get the desire output and later on the format can easily be accessed and used.
Analysis:
Nearly all the major programming languages are able to perform web scraping. We used DOM parsing to retrieve the dynamic content generated by client-side scripts. It is also possible to parse web pages into a DOM tree, based on which programs can retrieve parts of these pages.
In our case we used scarping technique to use in competitor analysis, to check how much difference is between the main site and the competitor’s site.
Library loading

Keyword input:
Number of urls
Checking H1
Checking span tag

Checking b tag

Checking p tag
Checking body tag
Checking div tag
The scraping depends on what data is required from a particular site, according to the requirement the code might change.
USE IN SEO:
The data we get after scraping a targeted website we can get a brief idea of the site’s structure and also which keywords, contents are important to drive traffic. Mostly we used scraping for competitor analysis with a particular search term which may lead to a higher ranking possibility in SERP.
CONCLUSION:
R can give you great leverage in scraping data from different websites. By doing so we can get an overview of any sites structure which will help us in many analysis apart from competitor analysis. Scraping is very useful in the field of SEO.
18. USING FUZZY C MEANS CLUSTERING TO DETERMINE CUSTOMER BEHAVIOUR PATTERN BASED ON THEIR NEEDS:
Introduction:
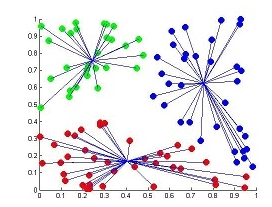
Clustering or cluster analysis involves assigning data points to clusters such that items in the same cluster are as similar as possible, while items belonging to different clusters are as dissimilar as possible. Clusters are identified via similarity measures. These similarity measures include distance, connectivity, and intensity. Different similarity measures may be chosen based on the data or the application.
Fuzzy c-means (FCM) is a method of clustering which allows one piece of data to belong to two or more clusters. This method is frequently used in pattern recognition. It is based on minimization of the following objective function:
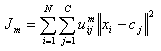
Analysis: This algorithm works by assigning membership to each data point corresponding to each cluster center on the basis of distance between the cluster center and the data point. More the data is near to the cluster center more is its membership towards the particular cluster center. Clearly, summation of membership of each data point should be equal to one. After each iteration membership and cluster centers are updated according to the formula:
Algorithm:
Let X = {x1, x2, x3 …, xn} be the set of data points and V = {v1, v2, v3 …, vc} be the set of centers.
1) Randomly select ‘c’ cluster centers.
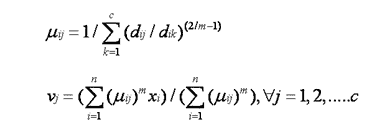
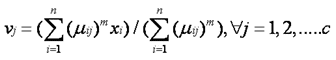
2) Calculate the fuzzy membership ‘µij’ using:
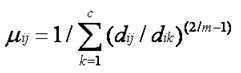
3) Compute the fuzzy centers ‘vj’ using:
4) Repeat step 2) and 3) until the minimum ‘J’ value is achieved or ||U(k+1) – U(k)|| < β.
where,
‘k’ is the iteration step.
‘β’ is the termination criterion between [0, 1].
‘U’ = (µij)n*c’ is the fuzzy membership matrix.
‘J’ is the objective function.
USE IN SEO:
For some particular product review customers can be grouped into fuzzy clusters based on their needs, brand choices, psycho-graphic profiles, or other marketing related partitions.
Source: https://www.quora.com/How-does-BM25-work
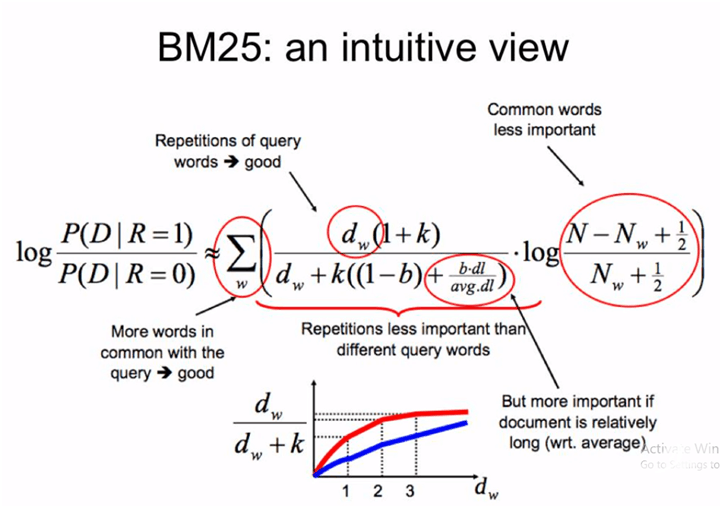
BM-25 is a popular and effective ranking algorithm based on binary independence model.
Adds document and query term weights

k1, k2 and K are parameters whose values are set empirically
dl is doc length
Typical value for k1 is 1.2, k2 varies from 0 to 1000, b= 0.75
LIMITATION:
BM-25 fails when the document is too long.
19. USING QUERY TERM PROXIMITY TO IMPLEMENT KEYWORDS IN A DESIGNATE POSITION WITHIN A SPECIFIED DISTANCE ACCORDING TO SEARCH ENGINE’S PREFERENCE:
Introduction:
A particular query or term within a specified distance, where two or more separately matching term occurs in corpus is query term proximity. The specified distance is the number of intermediate words or characters. In addition to proximity, some implementations may also impose a constraint on the word order, in that the order in the searched text must be identical to the order of the search query. Especially for free text queries on the web, users prefer a document in which most or all of the query terms appear close to each other, because this is evidence that the document has text focused on their query intent
Analysis:
Term proximity is a feature that partially captures the dependence of terms in documents. Information retrievals models are often based on the assumption those terms occur independently of other terms in a document.
In regards to implicit/automatic versus explicit proximity search, most Internet search engines only implement implicit proximity search functionality. That is, they automatically rank those search results higher where the user keywords have a good “overall proximity score” in such results.
USE IN SEO:
Proximity searching can be used with other search syntax and/or controls to allow more articulate search queries. Sometimes query operators like NEAR, NOT NEAR, FOLLOWED BY, NOT FOLLOWED BY, SENTENCE or FAR are used to indicate a proximity-search limit between specified keywords.
By implementing keywords to a designated position which satisfies search engine will positively increase visibility in SERP.
20. USING BM-25 TO DETERMINE RELEVANCY OF PARTICULAR DOCUMENT TO A PARTICULAR QUERY:
Introduction:
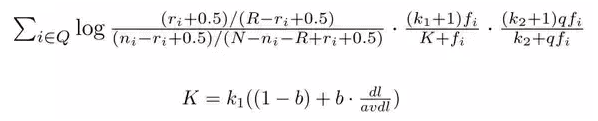
Okapi BM25 (BM stands for Best Matching) is a ranking function used by search engines to rank matching documents according to their relevance to a given search query. This algorithm is based on the probabilistic retrieval framework; BM models incorporate local and global weight components. The precursor of the ranking functions of these models is a formula of the general form.
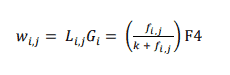
wi, j = weight of term i in document j
Li, j = local weight of term i in document j
Gi = global weight of term i
fi, j = frequency of term i in document j
k = a smoothing correction
F4 = a best match scoring function that compute RSJ weights
Analysis:
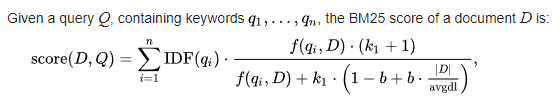
The name of the actual ranking function is BM25. It usually referred to as “Okapi BM25” (Online Keyword Access to Public Information). BM25 is a bag-of-words retrieval function that ranks a set of documents based on the query terms appearing in each document, regardless of their proximity within the document.

Source: https://www.quora.com/How-does-BM25-work
BM-25 is a popular and effective ranking algorithm based on binary independence model.
Adds document and query term weights
k1, k2 and K are parameters whose values are set empirically
dl is doc length
Typical value for k1 is 1.2, k2 varies from 0 to 1000, b= 0.75
LIMITATION:
BM-25 fails when the document is too long.
USE IN SEO:
BM25 is a bag-of-words retrieval function that ranks a set of documents based on the query terms appearing in each document, regardless of their proximity within the document. By implementing according to the algorithm the probability of ranking higher increases.
21. USING SEMANTIC PROXIMITY TO DETERMINE PARTICULAR KEYWORD’S SEMANTIC RELATIONSHIP BETWEEN UNITS OF LANGUAGE, CONCEPTS OR INSTANCES:
Introduction:
A concept whereby a set of documents or terms within term lists are assigned a metric based on the likeness of their meaning/semantic content. This defines two entities to be similar if: (i) both belong to the same class, (ii) both belong to classes that have a common parent class, or (iii) one entity belongs to a class that is a parent class to which the other entity belongs. Furthermore, two relationships are similar if (i) both belong to the same class, (ii) both belong to classes that have a common parent class, or (iii) one relation belongs to a class that is a parent class to which the other relation belongs.
Analysis:
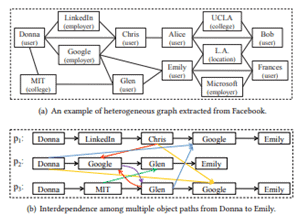
Semantic proximity search is an important task on many real-world heterogeneous networks. It takes an object in the network as the query, and ranks the other objects according to a semantic relation. The different ways that how two objects are connected imply different kinds of semantic relations.
USE IN SEO:
Nowadays knowing one information resource in the internet, it is often of immediate interest to find similar resources. The Semantic Web provides semantic extensions to find similar data by content and not just by arbitrary descriptors.
In SEO semantic plays a major part after each and every day search engine’s algorithm updates to provide users a better and relevance results in SERP. Determining the Semantic similarity between queries and results is important to get rank higher. The range and the quality of content increases by using semantically similar terms.
22. USING NLP ON NEWS HEADLINES TO PREDICT TRENDS:
Introduction:
NLP techniques can be used to extract different information from the headlines such as sentiments, subjectivity, context and named entities. This extracts indicator vectors using each of these techniques, which allow us to train different algorithms to predict the trend. Linear regression, Support Vector Machine etc.
Analysis:
Latent Sentiment Analysis is done by building up a corpus of labeled words which usually connote a degree of positive or negative sentiment. There exists several word embedding techniques such as Word2Vec, TF-IDF, Bag-of-words and those can be combined with N-grams in order to augment the information they contain. We have tested those three techniques, with and without using N-grams. Hereafter, we will explain the concepts behind those techniques. After having cleaned the text by removing stop words and named entities, we need to convert the remaining words to vectors of fixed length to compose the dataset used by the machine learning algorithms.

The best results we found were using linear regression on bag-of-words vectorized data, which had 57% accuracy. This result is due to the algorithms not properly extracting information from the large vectors. The headlines are also very context dependent, with recurrent actors for periods of times, before becoming irrelevant.
USE IN SEO:
Predicting trends can help to understand the market better to implement keywords accordingly. Using NLP can improve the analysis to predict trends, which will help in SERP to rank better.
23. USING GEPHI FOR WEBSITE INTERNAL LINKING BY THEIR PAGE WEIGHT
Introduction:
Gephi is an open-source visualization and exploration platform for scientists and data analysts. It helps data analysts to intuitively reveal patterns and trends highlight outliers and tells stories with their data.
We used this software to analyze a particular website’s inlinks and how they are connected to each other and how we can improve the linking to get the best link juice flow route to every focus page present in the site.
Analysis:
This has wide varieties of application which can be used depending on the user’s requirement like, link analysis, exploratory data analysis, social network analysis, biological network analysis, and poster creation. Its main features include dynamic filtering, real-time visualization, and input/output; create cartography, layout, and data table & editions.
After crawling and extracting all the necessary links of your site using screaming frog, the data has been collected and imported into Gephi then we were able to request any nodes of your website and display links between them(Basically page nodes, collected through site crawl data).
Crawling the website and collecting the data:
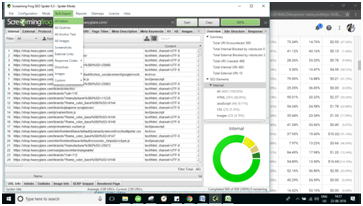
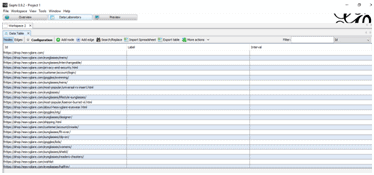
The tool we used to perform a crawl of your site is Screaming Frog. Once Screaming frog has finished crawling your site we get lots of links which includes image, js files, css files and many unnecessary things. Mainly we were interested in pages not the other files, so we needed to exclude those things from the crawl data.
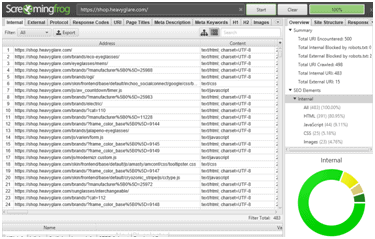
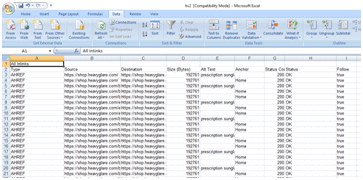
After we gathered the crawled data, we exported the file from Screaming Frog:
“Bulk Export”>”All links” to an excel spreadsheet.
Later on we filtered and cleaned the spreadsheet by removing the first column “Type”, and also all the other columns beside “Source” and “Target.” But before that we renamed the “Destination” column to “Target”.
After that we also filtered images, CSS and JavaScript files. And also removed links like tags, category, duplicate links, paginations from the source.
Bluk Export >> all links
Exported the crawled link into an excel sheet.
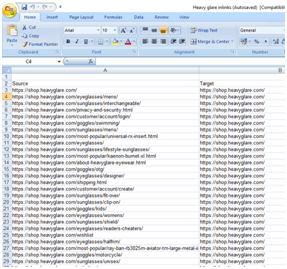
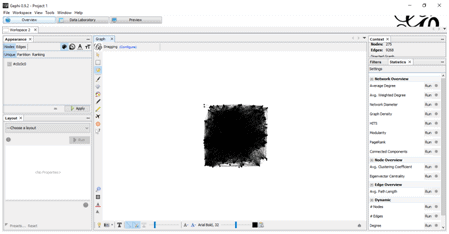
Filtered and Renamed “Destination” to “Target”. Importing the file in Gephi: In Gephi we imported the excel spreadsheet from “Data laboratory” section. Once all the data is in the “Data Laboratory,” then we can see a graphical representation of the data, in the “Overview” section. This may not be a proper layout to work with, need tuning in a proper layout algorithm.
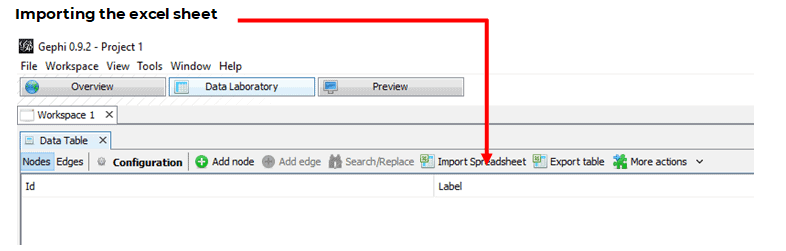
After importing the excel sheet-
An overview of the present layout-
Tuning the Graph:
Generally all the main layouts run using “forced-based” algorithm. The layout algorithm we used to clarify the nodes (are the webpage links) and edges (shows the links between webpages) is “Force-Atlas 2”.By adjusting Scaling and Gravity the graph came to a viewable position.Adjusting the view-
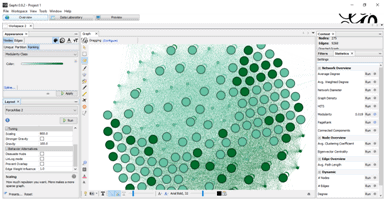
Complete overview-
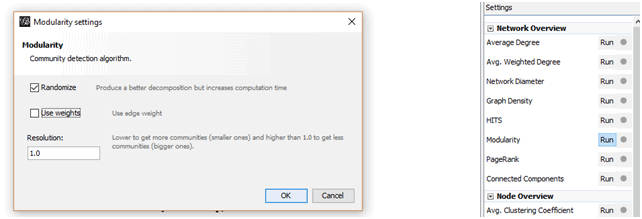
After adjusting the view, we calculated the Pagerank and Modularity.
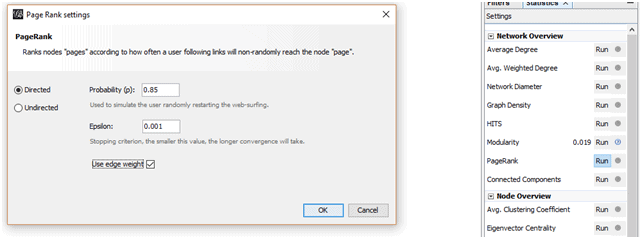
These options are available in the “Statistics” tab, and then we ran using the default settings for PageRank, but for Modularity we un-ticked “Use weights.” This will append data about your pages in new columns that will be used for the visualization and plotting later on.Ran Modularity-
Ran PageRank-
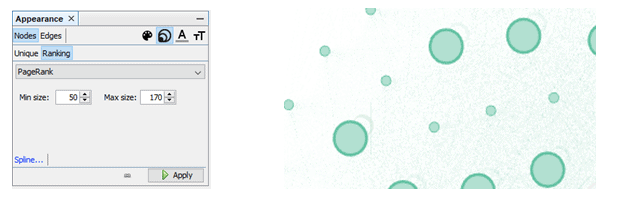
PageRank identification tuning:
We choose nodes then its size, then the ranking tab, gave min size, gave max size.
This highlights with high page rank in large circles and low page rank with small circles according to the given max-min size.
Modularity identification tuning:
In here we choose nodes then Color, then the ranking tab, then choose Modularity class.
This will highlight the nodes which has a high modularity are being present as deep colored circle, and the nodes which has low Modularity, those nodes are being present as faded colored circle.

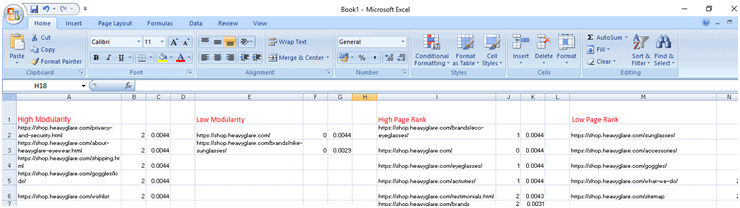
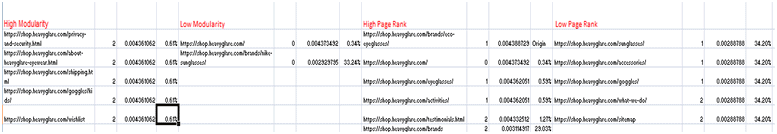
Arranging Data in the Spreadsheets: (According to their PageRank and Modularity)
Basically a table, then 4 columns has been created to note down the measurements according to their:
PageRanks
Modularity
Now in the first column we added those links which has a high modularity.
Then in the second column we added those links which has a low modularity.
Then in the third column we added those links which has a high PageRank.
Then in the fourth column we added those links which has a low PageRank.
Note: The top most ranked page which has the highest PageRank according to Gephi will be count as the root page/ the main page/the origin page.
Calculations of the relative distances between nodes:
This basically measures the distance from the top most Ranked page to the every other page, which are present in the data table created or spreadsheet previously (According to their PageRank and Modularity)
The distances are showed in percentage:
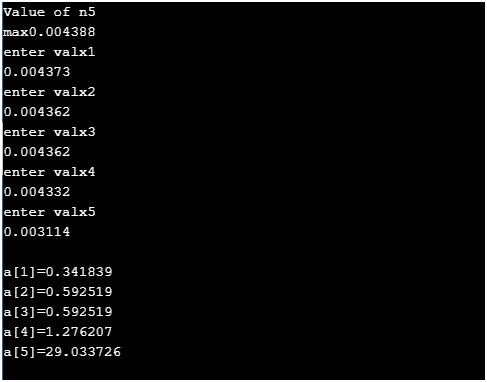
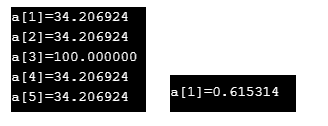
To calculate percentage we used a little c program which takes the max page rank value and all the other page rank values and then gives a result which indicates the relative distance between the origin node and the entire nodes in the spread sheet.
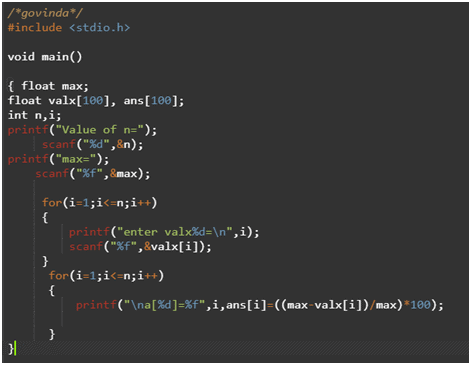
Output of the relative distance in a[i] ( i= 1,2,3,4,5 ):
Plotting the Internal structure:
There are two general theories of page rank distribution to maintain link equity that we followed is:
1. When the relative distance from the origin page to any other page’s percentage is high, we need to pass the page rank.
2. When the relative distance from the origin page to any other page’s percentage is low, we need to leave that node as it is (when these kinds of nodes have low modularity then only we need to pass modularity from another page with high modularity count).
For example:
Suppose,
A is the origin page with high page rank, has low modularity.
B is any one of the page in the website with low page rank.
C is also any one of the page in the website with high modularity
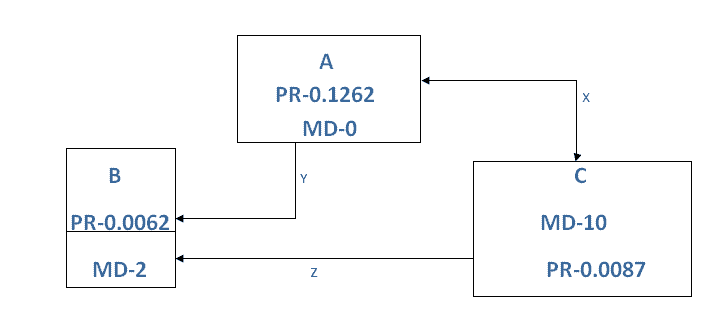
X- Both side arrow connectivity between A and C means, both nodes will pass PR and MD to each other to maintain link equity.
Y- This basically means Only from A will pass PR and MD to B to maintain link equity.
Z- Only from C, PR and MD will pass to B to maintain link equity.
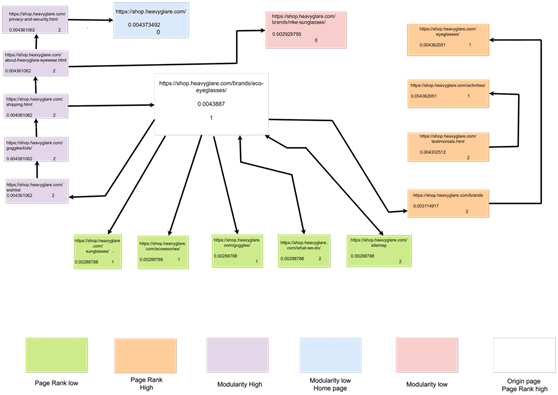
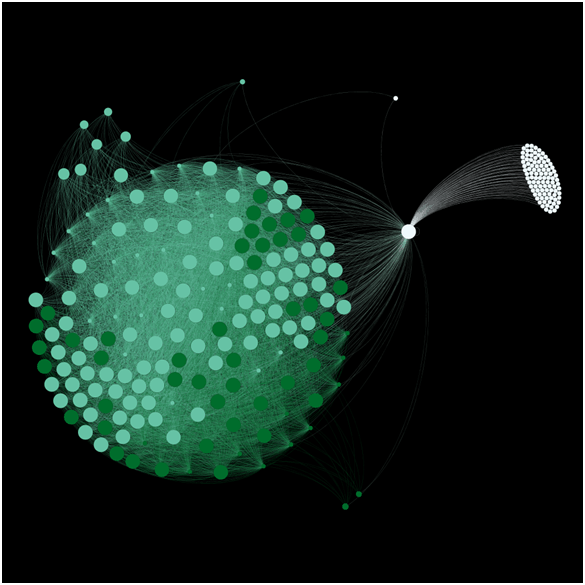
Site’s linking structure, Benefits the homepage:
USE IN SEO:
Generally a very important factor of a strong SEO strategy is to understand how a website is structured, how the pages of a website are connected, how the page rank flows through it. This is where Gephi steps in, through a visual representation of the internal structure of a particular site, we’ll be able to diagnose and detect SEO issues regarding any page rank deficiency, Link equity and also how Google might crawl your website, then we built a network using Gephi which allowed us to detect the issues which might affect the ranking of your page later on.
Note: If there are improper page rank distributions in the network/structure also if the main target page has low page rank, then the main target page won’t get rank higher. Regarding these types issues Gephi is used.
CONCLUSION:
This analysis covers all the basic understanding of the internal linking structure also gives a general overview of the network visualization. This is yet an important analysis help to design a better internal linking strategy in the near future.
After gathering the data, analyzing the data and calculating the data is finished, and then comes the linking strategy internally, which will pass PR MD in such a way that every page will have an equal PR and MD at last.
Through Gephi we have a basic strategy to maintain the link equity of the whole website.